Risk/Reward vs Win Rate: The Breakeven Line Every Strategy Must Beat

This article is for informational and educational purposes only. It does not constitute financial advice or an investment recommendation. Trading in financial markets carries a high risk of loss.
Introduction
Many traders look for a high win rate, and many others for a high reward-to-risk ratio, as if one of the two were enough on its own. In practice, a strategy that wins 70% of its trades can lose money, and so can one with a 1:3 ratio. The result depends on how the two numbers combine.
This article is divided into three sections. The first explains the breakeven line that links win rate and reward-to-risk ratio. The second shows why the two are not independent. The third covers the effect of costs and how to read these numbers in the MetaTrader 5 Strategy Tester.
1. The breakeven line
Expectancy in R
If every trade risks 1R and winning trades earn R on average, the average result per trade, or expectancy, is:
Expectancy (R) = Win rate × R − (1 − Win rate)
A strategy only makes money over time if this value is positive. Setting it to zero gives the minimum win rate needed for each ratio:
Breakeven win rate = 1 ÷ (1 + R)
| Reward-to-risk ratio | Breakeven win rate |
|---|---|
| 1:0.5 | 66.7% |
| 1:1 | 50.0% |
| 1:1.5 | 40.0% |
| 1:2 | 33.3% |
| 1:3 | 25.0% |
Values before spread, commissions and swaps.
Above or below the line
Every strategy can be placed as a point on a chart with the ratio on one axis and the win rate on the other. The strategy is profitable when its point sits above the breakeven line, whatever its win rate or its ratio.
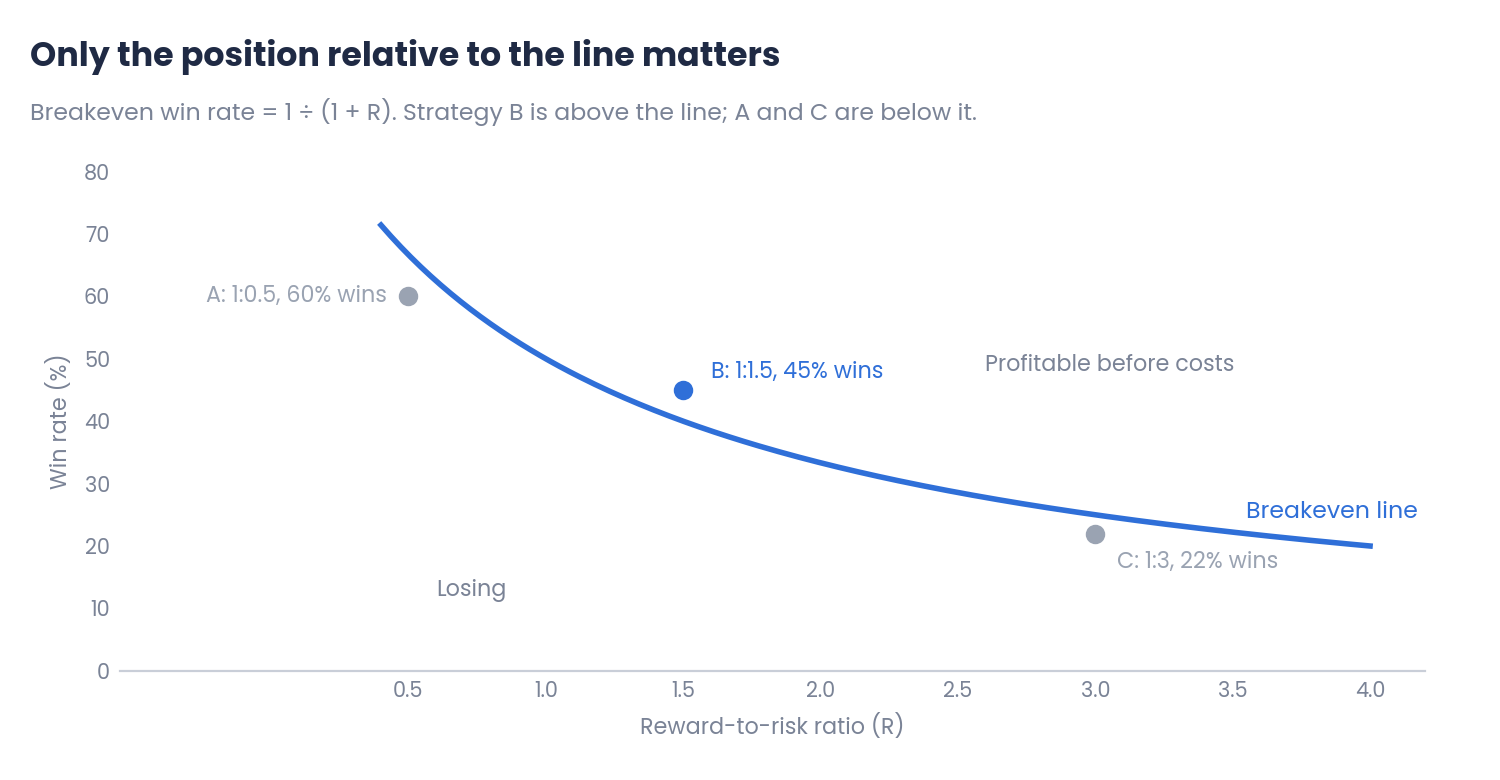
Figure 1. Three strategies relative to the breakeven line
Strategy A wins 60% of its trades but needs 66.7% with a 1:0.5 ratio. Strategy C has an attractive 1:3 ratio but wins only 22%, below the 25% it needs. Strategy B, with less striking numbers, is the only one above the line.
2. Why win rate and ratio are linked
Moving the target changes the win rate
Win rate and ratio are not two separate settings. With the same entry and the same stop, a more distant target is reached less often. Increasing the ratio lowers the win rate, and the question is whether it lowers it more or less than the breakeven line does.
A simple experiment shows this. On prices that move completely at random, with a fixed 1R stop and different targets, the win rate obtained for each ratio is:
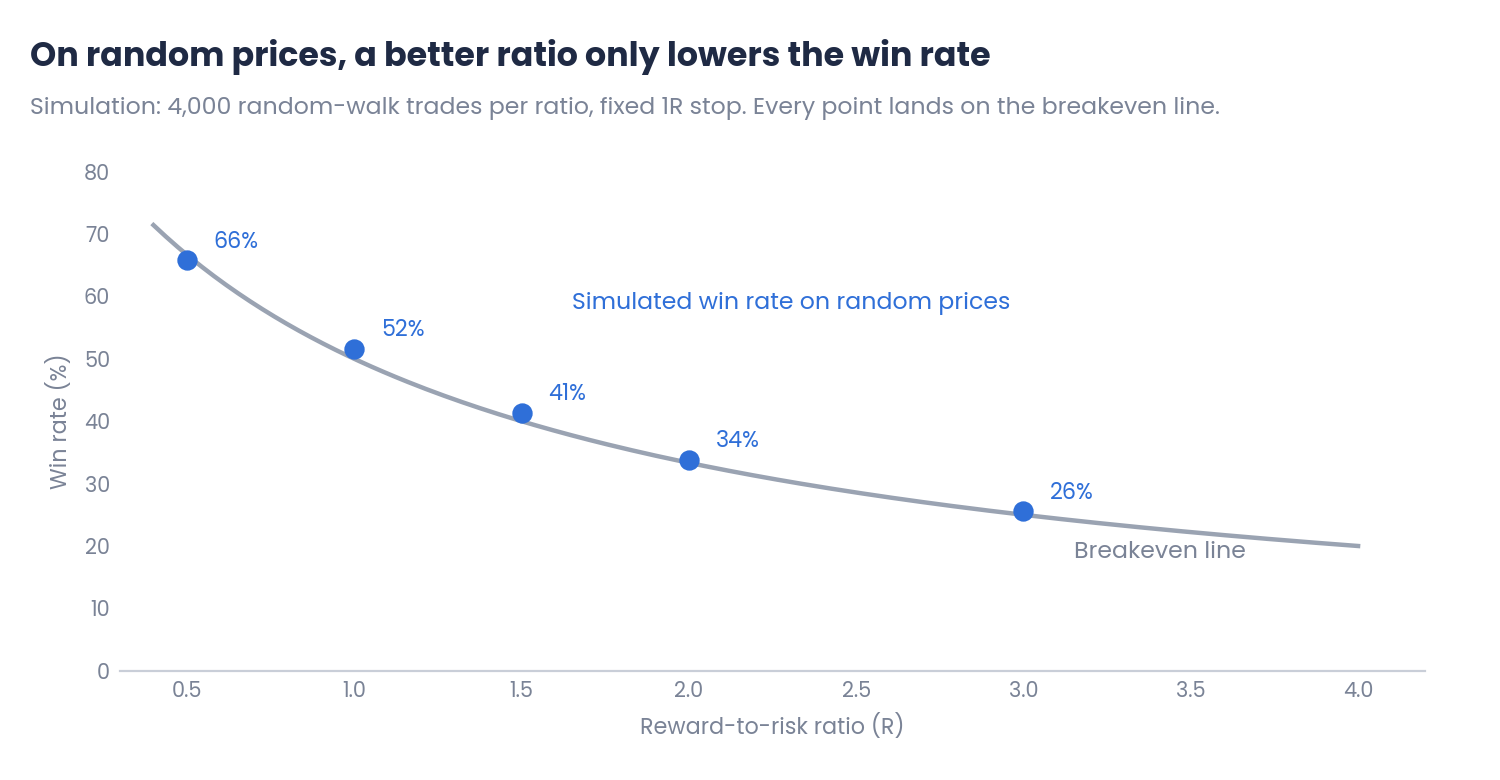
Figure 2. Win rate by ratio on simulated random prices
Every point falls on the breakeven line. When price has no direction, every ratio gives zero expectancy before costs, and a larger ratio simply produces fewer winning trades. A ratio alone gives no edge. The edge has to come from the entry, the exit or the market conditions the strategy exploits.
Planned ratio and real ratio
The ratio planned on the chart is rarely the one obtained. Several things make the real ratio smaller:
- Partial closes and trailing stops: part of the position exits before the target, so the average win is below the planned.
- Moving the stop to breakeven: it turns some losses into zero, but also some future winners into zero.
- Slippage: stops filled worse than planned make the average loss larger than 1R.
For this reason, the useful ratio is calculated from results: average winning trade divided by average losing trade.
3. Costs and reading the numbers in MT5
Costs raise the line
Spread, commission and swap are paid on every trade, winning or losing. If c is the cost per trade expressed in R, the breakeven win rate becomes:
Breakeven win rate with costs = (1 + c) ÷ (1 + R)
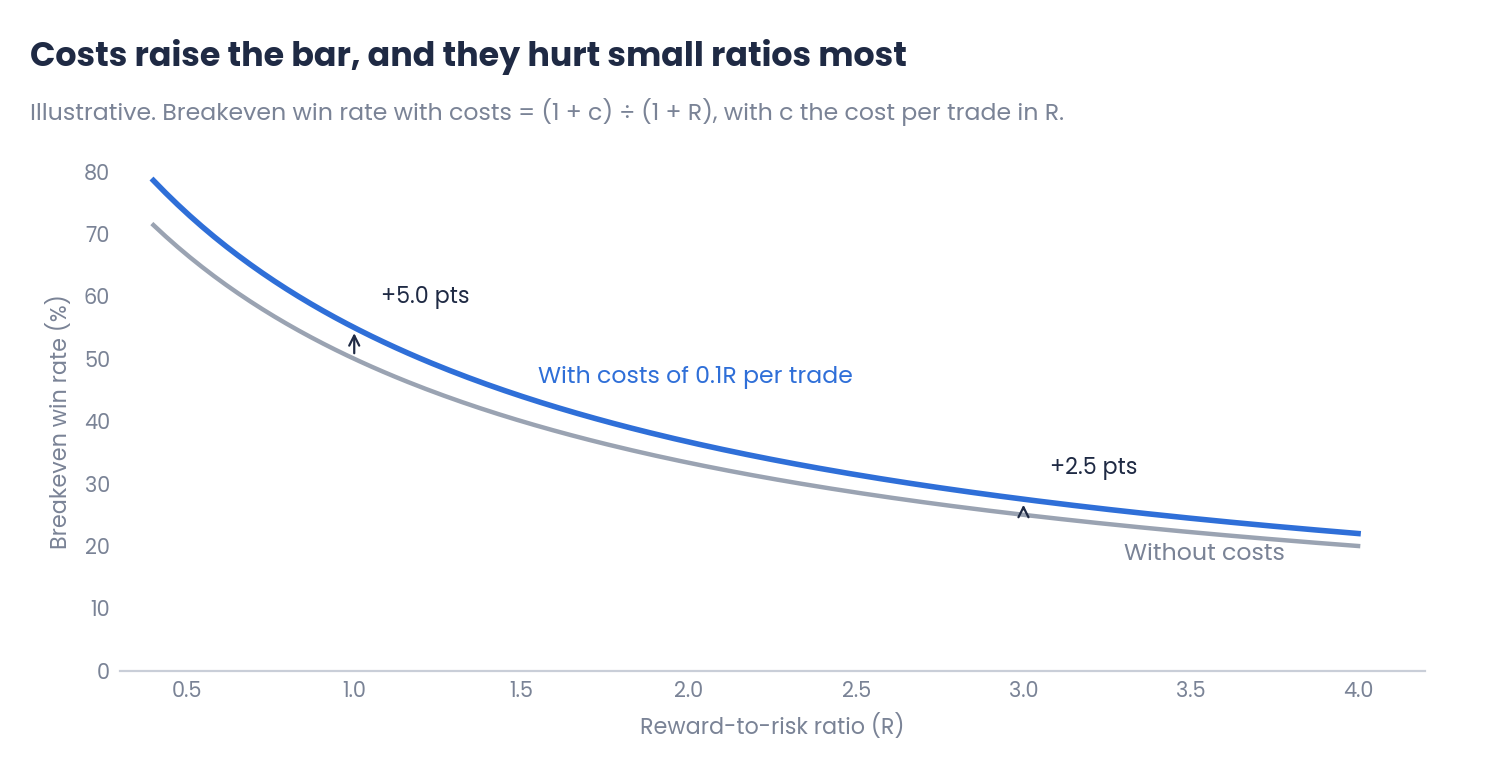
Figure 3. Breakeven line without costs and with costs of 0.1R per trade
The same cost raises the line more for small ratios: 5 points with a 1:1 ratio and 2.5 points with 1:3. Strategies with small targets and high win rates, typical of scalping, are the most sensitive to costs. A tight stop also makes the same spread a larger fraction of R.
Step-by-step example from a Strategy Tester report
The MT5 Strategy Tester report includes everything needed: the percentage of profit trades, the average profit trade and the average loss trade. Suppose a backtest with these results:
| Step | Calculation | Result |
|---|---|---|
| 1. Data from the report | 200 trades, 42% profit trades, average profit 180 USD, average loss 110 USD | Starting data |
| 2. Real ratio | 180 ÷ 110 | R = 1.64 |
| 3. Breakeven win rate | 1 ÷ (1 + 1.64) | 37.9% |
| 4. Margin above the line | 42% − 37.9% | 4.1 points |
| 5. Expectancy per trade | 0.42 × 180 − 0.58 × 110 | 11.8 USD |
| 6. Win rate 4 points lower | 0.38 × 180 − 0.62 × 110 | 0.2 USD |
Illustrative values. The averages in the report already include the costs simulated by the tester.
The expectancy of step 5 should match the Expected Payoff shown in the report, which is a good way to check the calculation. Step 6 is the important one: with a margin of only 4 points, a slightly worse win rate in live trading is enough to leave the strategy at breakeven. The distance to the line is a simple measure of how much room for error a strategy has.
Common mistakes
- Judging a strategy by its win rate. Without the ratio, the win rate says nothing about profitability.
- Choosing a large ratio expecting more profit. On its own, it only lowers the number of winning trades.
- Using the planned ratio instead of the real one. Partial closes, breakeven stops and slippage change it.
- Ignoring costs on small targets. They can turn a positive expectancy into a negative one.
- Trusting a very thin margin. A few points above the line in a backtest can disappear in live trading.
Conclusions
- The breakeven line: a strategy is profitable only if its win rate is above 1 ÷ (1 + R). Neither a high win rate nor a large ratio guarantees it on its own.
- The link between them: moving the target changes the win rate. On random prices, every ratio lands on the breakeven line, so the edge has to come from the strategy itself. Use the real ratio, calculated from results.
- Costs and MT5: costs raise the line, especially for small ratios. The Strategy Tester report gives the data to calculate the real ratio, the breakeven win rate and the margin above it.
Win rate and reward-to-risk ratio should always be read together. Looking at both, and measuring the distance to the breakeven line, gives a much more realistic picture of a strategy than either one alone. Test any strategy with your own data on demo or in the Strategy Tester, and combine it with disciplined risk management.
References
- Van K. Tharp, Trade Your Way to Financial Freedom, 2nd edition, 2006.
- Alexander Elder, The New Trading for a Living, 2014.
- MetaTrader 5 Help: Strategy Tester report (Expected Payoff, Profit Factor, profit and loss trades).
Disclaimer
This content is for informational and educational purposes only. It does not constitute financial advice or a recommendation to buy or sell any instrument. Expectancy calculated from past results is not a forecast. The charts and examples are illustrative, and every asset and every broker is different. Trading forex, CFDs and other leveraged products carries a high risk of loss. Every trading decision, and its outcome, is the sole responsibility of the reader. The author accepts no liability for any loss arising from the use of this information.