

A profitable closing balance can hide a difficult week. When I review an EA I want both the closed-trade record and a view of what the account was worth while trades were open. The two curves explain different parts of the same experience, and I write down which one a drawdown figure refers to before comparing reports.
Drawdown is a loss path, not a forecast
Drawdown describes a decline from an earlier peak to a later low in an account record. It helps a reader understand the size and path of loss that occurred in a selected period. It does not predict the largest future loss, and it does not tell you on its own whether a strategy is suitable for a particular account.
For automated trading, drawdown matters because a strategy can keep following its rules while the account experiences a sequence of losses, changing spreads or open-position losses. A headline return cannot show that path by itself.
Start by asking which curve is being measured
A balance curve reflects closed trades. Equity also includes the unrealised profit or loss of open positions. That difference is important: an account can look stable on closed balance while open positions have moved materially against it.
MetaTrader 5 records separate balance and equity drawdown statistics in its tester output. Its official documentation describes maximum equity drawdown as a monetary decline and separately records the percentage figure. When you compare reports, first check the platform label, the currency, the date range and whether the figure is based on balance or equity.
- Balance or equity: Open positions can make the two curves diverge.
- Money and percentage: Both depend on the account scale and reporting convention.
- Date range and trade count: A short or narrow sample may not include difficult conditions.
- Position size and exposure: A drawdown can be shaped by sizing as much as entry logic.
- Market and execution conditions: Spread and slippage, commissions and liquidity can change realised outcomes.
Read drawdown beside the rest of the record
Maximum drawdown is one useful observation, not a complete risk score. Review it with the equity curve, number of trades, holding time, leverage, concentration, losing periods and the account conditions used. Two records can show the same maximum percentage while arriving there in very different ways.
Use the EA evaluation checklist to place drawdown alongside the strategy evidence and operating checks needed before live use. If you are examining a public account, the Myfxbook track-record guide explains what its verification labels and account details can establish.
The MetaTrader 5 Strategy Tester statistics reference lists profit factor, balance drawdown and equity drawdown separately for this reason. Its optimisation-criteria guide also cautions against treating a single criterion as a universal measure of system quality.
For a broader evaluation process, compare historical testing with forward evidence in Backtesting vs Forward Testing, then review the available SmiteFX systems with the operating conditions in mind.
Set a review point before running live
Before enabling an automated strategy, write down what you have reviewed: the account type, intended lot size, relevant drawdown figure, and the events that would cause you to pause and reassess. Those events might be a loss level, an unusual execution difference, an operational fault or a change in account conditions. The appropriate threshold is personal to the account and risk tolerance; it is not supplied by a marketing claim.
A VPS may help a terminal remain available, but it cannot remove market movement, liquidity changes or execution risk. The VPS setup checklist covers the separate availability and monitoring questions. Keep the initial configuration proportionate to risk you understand and monitor whether the live setup continues to resemble the evidence you reviewed.
Keep the conclusion proportionate
A low historical drawdown is not a promise of low future risk. A higher drawdown is not automatically proof that a strategy is defective. The useful question is what was measured, over which period, under which conditions, and whether the loss path is one you could tolerate without changing a plan impulsively.
Leveraged CFD trading carries a high risk of loss. ESMA's product-intervention analysis explains why clear risk information is required for retail CFD communications. This article is educational and is not investment advice.
Sources reviewed 7 October 2026
- MetaTrader 5 tester statistics
- MetaTrader 5 optimisation criteria
- ESMA CFD product-intervention analysis
Work through a balance and equity example
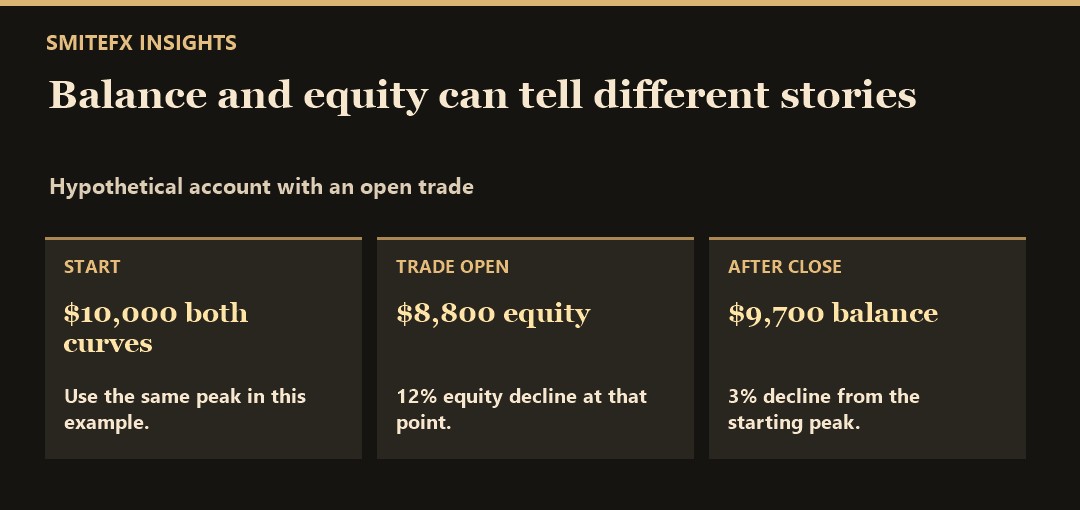
Suppose balance and equity both start at $10,000. With a position open, the account balance remains $10,000 while floating losses take equity to $8,800. Before any earlier peak higher than $10,000, the observed equity decline from that peak is 12%. The balance is unchanged at this stage, so the balance drawdown from the same starting point is 0%. These numbers are hypothetical.
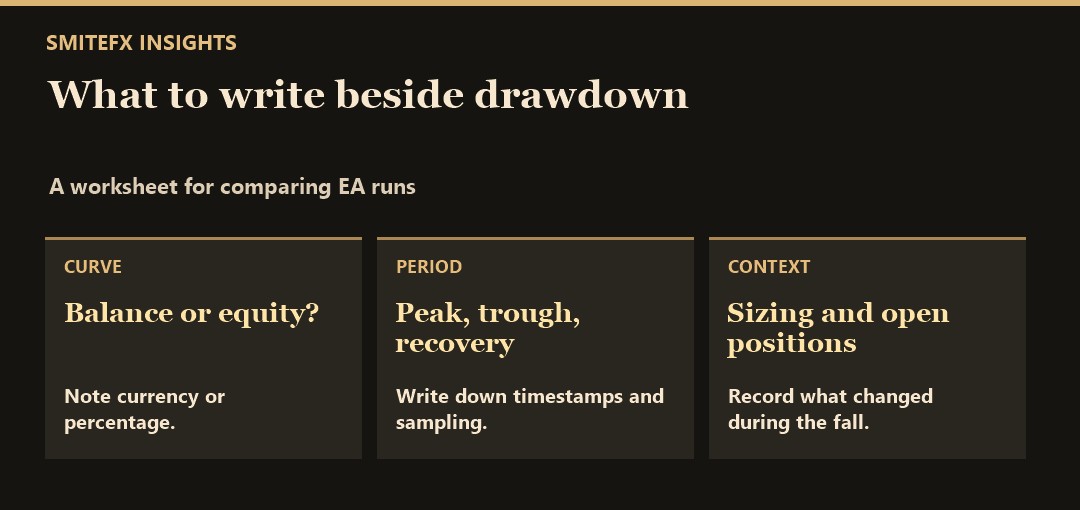
If the position later closes at a $300 loss, balance drops to $9,700. Its drawdown from the starting level is now 3%. The account still experienced the earlier 12% equity decline. Record the timestamps, sampling frequency and whether fees or floating values were included. With coarse sampling you may miss the lowest equity point, so do not assume a snapshot reveals every intraday movement.
For a useful review record I add the start and end of the decline, the maximum number of simultaneous positions, and whether there was a change in sizing. I distinguish recovery from a new high and record when the previous peak was actually regained. If the curve has not recovered by the end of the period, I mark the recovery time as ongoing.
For a SmiteFX product reference, see Fortress MT5. When reviewing this EA, keep an untouched demo report with both curves. Compare the same period, sizing method and account currency before drawing any conclusions about the difference between two runs.




