Is your edge real? Testing 49,000 rule variants after spread and swap - and the one gold timing rule that survived

Introduction
Most trading rules look good in a quick backtest. Fewer survive the real spread. Even fewer survive the swap, a period of history they were not tuned on, and one simple question: would any other entry time have done just as well?
In a series of studies I ran about 49,000 backtests in MetaTrader 5, plus several smaller targeted tests. They covered scalping, opening-range breakouts, Smart Money Concepts, trend following, pairs trading, dip-buying, overnight holds, calendar effects and the synthetic indices. The data came from two MT5 servers: Deriv (forex, metals, stock indices, crypto and synthetic indices) and a prop-firm demo server (FTMO). Every test used the same four rules, and almost everything failed them.
This article has three parts. The first part explains the four rules and shows, with real numbers, how each common shortcut makes a losing rule look like a winner. The second part goes through each family of strategies I tested and why it failed. The third part presents the MQL5 script that applies the rules, SessionEdgeTester, and walks through the one result that passed clearly: a gold rule that buys at 18:00 New York time and sells 9 hours later. The script is attached and is also free in CodeBase. You can run the same test on your own broker in about 20 seconds.
Nothing here is a recommendation to trade. The point is the method. If you build or buy Expert Advisors, the same checks will save you money whatever strategy you use.
Part 1. The four rules of an honest test
1. Costs come from the terminal, not from a guess. Each trade pays the larger of 1.5 times the live spread and the spread recorded on the entry bar. If a bar was quoted at a wide spread, the trade pays that. Commission is added on top. Swap is the broker's live swap, charged for every server midnight the trade crosses, and three times on the rollover day.
2. Rules are fixed in advance and the last 40% of history is held back. Every parameter is set before the run. The first 60% of the history is the in-sample part and the last 40% is the out-of-sample part. A rule passes only if the out-of-sample t-statistic is at least 2 and the in-sample average is positive. A rule that only works in-sample is curve-fitted. A rule that only works out-of-sample may be luck or a regime, so both halves are always shown.
3. There is a baseline. A rule can make money simply because the market went up. To separate timing from drift, the same holding period is tested from every other hour of the day, or a random entry with the same stop and target is tested on the same bars. If the baseline does as well, the "edge" is the trend, not the rule.
4. Correlated markets count once. US500, US100 and US30 move together. Testing a rule on all three and adding the trades triples the sample without adding information. Results are pooled per date, one observation per day.
What happens when you skip a rule
Each rule exists because I saw a real result change sign without it. Four examples from my own data:
Skipping rule 1, part a: using a spread snapshot. Deriv's Drift Switch indices switch between up-drift, down-drift and flat regimes. A first pass that charged the spread seen at run time (about 0.008% of price) showed a strong trend-following profit. Re-run on 2.6 million real bid/ask ticks per index, the picture reversed. The average spread was 0.069% on DSI30, about nine times the snapshot, and it is not constant: it widens with the trend. On DSI30 the average spread was 0.038% when the last 15 minutes had moved less than half a standard deviation, and 0.120% when it had moved more than two. The spread is widest exactly when there is a trend to follow.
| Index | Window | Gross | Cost (real bid/ask) | Net, 31 days |
|---|---|---|---|---|
| DSI30 | 15 min | +43.6% | 64.2% | -20.6% |
| DSI30 | 30 min | +30.8% | 40.5% | -9.7% |
| DSI20 | 15 min | +74.4% | 95.0% | -20.5% |
| DSI10 | 15 min | +54.8% | 105.4% | -50.7% |
The signal is real: the gross result is large and positive on every index. The cost is about twice the capturable drift. A bar-based backtest that uses the spread field of each bar is also misleading here, because that field holds a low spread within the bar, not the spread you pay when the trend runs. For any instrument with a variable spread, check the cost with tick data.
Skipping rule 1, part b: ignoring swap. An earlier gold overnight test in the Strategy Tester on Deriv (472 nights, 2023-2026, buy 22:15 server time, sell 07:00) made +$1,136 on 0.05 lot. The swap paid over the same nights was about $1,590, more than half of the gross gain. Without swap the rule looks twice as good as it is.
Skipping rule 2: choosing the best in-sample setting. In the 49,000-backtest tournament described below, the best in-sample setting for each market was positive out-of-sample only 49% of the time. Even the top 1% of in-sample Sharpe ratios (3.25 and above) were positive out-of-sample only 50% of the time. Picking the best backtest is a coin flip.
Skipping rule 3: no baseline. The "Gotobi" effect says the yen weakens on Japanese settlement days. On Deriv's USDJPY, EURJPY, GBPJPY and AUDJPY, the long 07:00-10:00 Tokyo window on fix days made +2.20 bp per trade in the last 40% of history, t 5.1. That looks like a strong pass. But the same window on ordinary days made +1.56 bp, because the yen fell from 2019 to 2026. The gain over the baseline was about 0.6 bp. The rule was measuring the yen trend, not the fix flow.
Part 2. What failed, family by family
The tournament: 49,448 backtests on Deriv
The broadest test was a brute-force tournament. It covered 208 Deriv symbols (stock indices, forex majors, metals, energies, 37 cryptos, every synthetic family and 20 large US stocks and ETFs) on M15, H1 and D1. That gave 543 market/timeframe series. On each, 13 strategy families with 96 settings each were run: moving-average cross, Donchian breakout, RSI reversion, RSI(2) trend, Bollinger fade and breakout, momentum, streak reversal and continuation, session breakout, time of day, day of week, a martingale grid and buy-and-hold. Settings were chosen on the first 60% and scored on the last 40%. Costs were the bar spread and the current swap.
- Every family lost on its median out-of-sample result after costs. The least bad was RSI(14) reversion (median Sharpe -0.15). The worst were streak continuation (-1.31) and session breakout (-0.80).
- Martingale grids were positive out-of-sample in 39% of cases. They move risk into the tail; they do not create an edge.
- 598 settings were significant in-sample (t > 2). By chance about 14 of them would stay significant out-of-sample. 36 did, and 26 of those 36 were the Drift Switch indices, which then failed the real tick-spread test shown above. The other 10 were about what chance produces. One of them was a gold evening long, which pointed to the rule that survives at the end of this article.
Synthetic indices
Step, Volatility, Jump, Boom/Crash, DEX, Range Break and Drift Switch indices are generated by the broker. I ran randomness tests on more than 60 of them. The Step Index test is the most complete: 30 days of raw ticks, 2,641,469 price changes of exactly 0.1, with a spread of one tick.
| Test (Step Index ticks) | Result | Random benchmark |
|---|---|---|
| Share of up-ticks | 49.987% (z -0.42) | 50% |
| Runs test | 1,321,366 runs vs 1,320,735 expected (z 0.78) | |z| < 3 |
| Serial correlation, lags 1 to 10,000 | all between -0.0010 and +0.0009 | ±0.0018 |
| Chance of continuing after 1 to 9 ticks in a row | 48.9% to 51.0%, all inside their 3-sigma bands | 50% |
| Hour of day, share of up-ticks | 49.76% to 50.21% | ±0.90% |
| Largest bias found anywhere | 1.04% in one bucket | worth 0.021 ticks against a 1-tick spread |
The other families gave the same answer. Volatility indices are Gaussian random walks with no volatility clustering. Jump, DEX and Boom/Crash spike timing is memoryless (the gaps between spikes have a coefficient of variation of about 1, the signature of a Poisson process). Range Break direction does persist (58%), but price drifts back between breaks, so it nets about zero before spread. Drift Switch has a real trend, as shown above, and a spread that eats it. Wherever a synthetic has structure, its spread or swap is set to about the size of that structure.
Scalping and intraday rules
This test used M1 and M5 data from 2020 to October 2026 on nine FTMO markets: US500, US100, US30, GER40, UK100, XAUUSD, EURUSD, GBPUSD and USDJPY. The terminal's "Max bars in chart" had to be set to Unlimited; the default only returned about 72 days of M1. Costs were 1.5 times the live spread plus commission, which is 0.7 to 1.6 bp per trade. If a stop and a target fell inside one bar, the stop was counted.
- Intraday momentum (the early-session move predicts the last 30 or 60 minutes): negative out-of-sample on 8 of 9 markets.
- Opening-range breakout (5, 15 or 30-minute range, several stops and targets): weak. The best was US100 with a 30-minute range: +3.9 bp, t 1.35. Nothing reached t 2.
- M5 scalps (N-bar breakout, RSI(2) reversion, VWAP fade): every best-in-sample version lost out-of-sample on all nine markets, from -0.2 to -2.0 bp per trade. Before costs the result was about zero. The spread was the whole result.
In total 432 rule versions were tested. One was significant in-sample. None stayed significant out-of-sample.
Smart Money Concepts
Five popular SMC entries were coded mechanically, with fixed rules: break of structure (BOS), market structure shift (MSS), liquidity sweep, fair value gap (FVG) retrace and order-block retest. All used the same exits: a stop at the structural level (capped between 0.5 and 3 ATR), a 2R target and a time stop. The key control was a random entry with exactly the same stop, target and costs. Markets were XAUUSD, EURUSD, GBPUSD, Volatility 75 and Step Index on M5 and M15.
| Market, TF | BOS | MSS | Sweep | FVG | Order block | Random |
|---|---|---|---|---|---|---|
| XAUUSD M15 | +0.049 | -0.008 | -0.051 | +0.039 | +0.058 | +0.004 |
| EURUSD M15 | -0.103 | -0.070 | -0.257 | -0.142 | -0.196 | -0.182 |
| GBPUSD M15 | -0.098 | -0.062 | -0.151 | -0.138 | -0.129 | -0.103 |
| Volatility 75 M15 | +0.036 | +0.014 | -0.061 | +0.001 | +0.052 | -0.037 |
| Step Index M15 | -0.110 | -0.079 | -0.026 | -0.035 | +0.025 | -0.027 |
| EURUSD M5 | -0.155 | -0.166 | -0.299 | -0.272 | -0.309 | -0.317 |
Values are out-of-sample expectancy in R per trade, after spread. Across 50 strategy/market tests, 21 beat the random entry (a coin flip would give 25), and none was statistically significant; the highest t was 1.04. A second run with wider swings and a 1:3 target gave the same picture. Where SMC entries made money (gold M15 in 2025-2026), the random entry made money too. That is the trend, not the pattern. On Deriv forex at M5 the spread is 28-34% of a 5-minute ATR, so every entry, random included, starts 0.2-0.3R behind.
This does not mean a discretionary SMC trader cannot make money. It means the mechanical pattern carries no measurable edge, so if you make money with it, the edge is in your filtering, timing or sizing. Measure those separately.
Breakouts, and the order at the other side's stop
A common idea is to fade breakouts: place a limit order where breakout traders keep their stop-losses. I tested both on 12 FTMO symbols, May 2025 to October 2026, with the previous 1-hour candle as the range, each trade replayed on M5 bars with the bar's median spread. Each variant had 91,943 trades.
| Variant | Win rate | Average R | Symbols positive |
|---|---|---|---|
| Breakout, stop at other edge, target 1R | 48.6% | -0.057 | 1 of 12 |
| Breakout, stop at the middle, target 1R | 43.6% | -0.211 | 0 of 12 |
| Fade, stop 1 range, target the middle | 63.1% | -0.051 | 0 of 12 |
| Fade, stop 1 range, target the other edge | 49.3% | -0.044 | 1 of 12 |
| Fade, stop 0.25 range, target 1R | 45% | -0.24 | 0 of 12 |
The fade is the mirror image of the breakout. Its sell limit at the candle high fills exactly when the breakout's buy stop fills, at the same price. So the two results add up to minus two spreads (-0.044 + -0.057 ≈ -0.10R), and the gross edge on both sides is about zero. A 63% win rate did not help: the losses were larger than the wins. A calibration that searched 8,064 filter and exit combinations per market on the first 60% found nothing that held up across markets.
Slower effects: calendar, dip-buying, trend, pairs and overnight holds
These tests used FTMO H1 and D1 history (stock indices from December 2017, gold from 2005) and Deriv history from 2010, with swap charged per night.
| Rule | Out-of-sample result | Verdict |
|---|---|---|
| Turn of the month, stock indices | +5.8 bp, t 0.47 | Fail |
| Long before a Fed decision | In-sample +27 bp (t 2.35), out-of-sample +7.5 bp (t 1.06) | Fail, fading |
| Dip-buy in an uptrend (close > SMA200, RSI(2) < 10) | +40.7 bp, t 3.44, but in-sample -2.8 bp; lost in 2018, 2020 and 2022 | Fail, regime only |
| Trend portfolio, 19 markets, volatility-scaled | -2.4% a year, negative even before costs | Fail |
| Pairs: gold/silver, US500/US100, GER40/EU50, EURUSD/GBPUSD | -37 bp per trade, t -2.3 | Fail |
| Stock-index overnight hold, 18:00-09:00 New York, 8 indices | -2.1 to +3.3 bp, no t above 1.2; every best in-sample window faded | Fail |
| London 4 pm fix fade, 21 FX pairs | -2.5 bp, negative in both halves on every pair | Fail |
| Crypto weekday, weekend and session rules | All negative after swap and spread | Fail |
| Monday long, cash session, 6 indices, pooled per date | +7.7 bp, t 2.37 over 389 Mondays; in-sample +7.0 bp (t 1.44), out-of-sample +8.7 bp (t 2.34) | Small edge, watch |
The dip-buy result deserves a closer look, because many "buy the dip" robots are sold on exactly this kind of backtest. Its out-of-sample period (mid 2023 to 2026) was a strong bull market, and it made +40 bp per trade. Its in-sample period, which included the 2022 bear market, was slightly negative. Buying at random on uptrend days gave the same out-of-sample gain, so the timing added nothing. It is a bet on the bull market, and it loses in every volatile year.
The table below summarises all families. Each line is many settings.
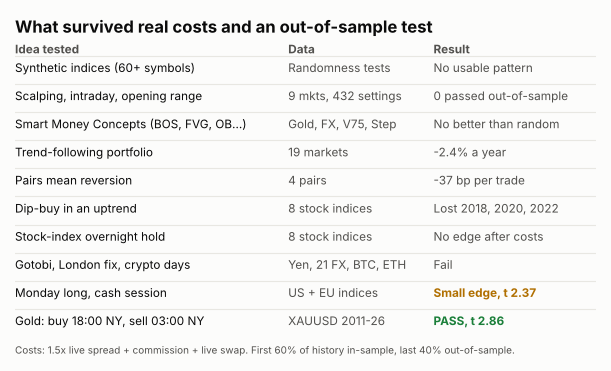
Three patterns repeated across all of it:
- Short-term rules lose to the spread. On M1 to M15, the typical move a rule captures is the same size as the round-trip cost.
- In-sample winners fade. When I picked the best of 64 overnight windows on the first 60% of the data, it faded or flipped sign in the last 40% on every stock index.
- Regime rules only work in their regime. Dip-buying, the yen-short trades and trend rules all looked good in the years their market trended their way.
A note on execution
Backtests assume a fill. I checked that with 24 live market orders on a Deriv demo account, at minimum lot, with a stop at three times the spread. Entry fills were within one spread in every case, in both directions, with no requotes. Forex and gold orders took 0.2-0.36 seconds round trip and their stops filled at or next to the stop price. Synthetic-index orders took 0.8-1.25 seconds. One Boom 500 stop was closed 7,286 points past the stop because a spike jumped the whole stop zone. On spike indices a stop-loss against the spike direction is not a loss cap; only position size is. Demo fills are not a guarantee of real fills, so repeat such a check on a small real account before relying on it.
Part 3. The script: SessionEdgeTester
SessionEdgeTester tests one kind of rule: buy (or sell) at a fixed hour on chosen weekdays and exit a fixed number of hours later. It reads H1 history from the terminal and places no trades. It applies the first three rules automatically: real costs, a fixed rule with a 60/40 split, and a baseline of every other entry hour.
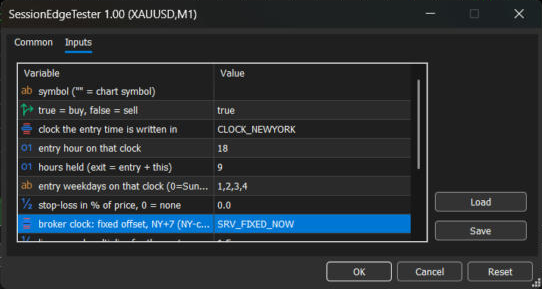
| Input | Meaning |
|---|---|
| Sym | Symbol to test. Empty means the chart symbol. |
| GoLong | true = buy, false = sell. |
| Clock | The clock the entry hour is written in: server, New York or London. |
| EntryHour, HoldHours | Entry hour on that clock and hours held. |
| Weekdays | Entry days on that clock, as a list (0 = Sunday ... 6 = Saturday). |
| StopPct | Optional stop-loss in % of price, checked on H1 highs and lows. 0 = none. |
| ServerClock | The broker's clock: the current fixed offset, New York + 7 (the common "New York close" servers) or GMT. |
| SpreadMult, ExtraCostPct | Multiplier on the live spread, and extra round-trip cost in % for commission. |
| From, ISShare | Start date, and the share of history used as the in-sample part (0.6). |
| OutFile | Report file in MQL5\Files. |
Loading the full history
A common silent error is testing on whatever history the chart happens to hold. CopyRates can return only part of the data the server has, and a request for a long range can fail. The script first asks the terminal to download history back to the requested start, then copies it in 200-day chunks and joins them without duplicates:
int Load(string s, MqlRates &out[])
  {
   ArrayResize(out,0);
   int n=0;
   if(!SymbolSelect(s,true))
      return 0;
   datetime f0=(datetime)SeriesInfoInteger(s,PERIOD_H1,SERIES_SERVER_FIRSTDATE);
   datetime st=(f0>From)?f0:From;
   ForceHistory(s,PERIOD_H1,st);
   long fdl=0;
   if(SeriesInfoInteger(s,PERIOD_H1,SERIES_FIRSTDATE,fdl) && (datetime)fdl>st)
      st=(datetime)fdl;
   long step=200*86400;
   for(datetime x=st; x<TimeCurrent(); x=(datetime)((long)x+step))
     {
      MqlRates r[];
      int c=-1;
      datetime y=(datetime)MathMin((long)TimeCurrent(),(long)x+step-1);
      for(int a=0;a<3 && c<=0;a++)
        {
         c=CopyRates(s,PERIOD_H1,x,y,r);
         if(c<=0)
            Sleep(200);
        }
      if(c<=0)
         continue;
      int k=0;
      if(n>0)
         while(k<c && r[k].time<=out[n-1].time)
            k++;
      ArrayResize(out,n+c-k,100000);
      for(int i=k;i<c;i++)
         out[n++]=r[i];
     }
   return n;
  }
ForceHistory() repeatedly calls CopyTime() beyond the oldest loaded bar, which makes the terminal fetch older bars from the server, until the first date reaches the start or two minutes pass. The report prints the first and last bar dates so you can see how much history was really used.
Clocks and daylight saving
A session rule is written in market time ("18:00 New York"), but brokers run on their own clock. Some use GMT. Many use GMT+2 in winter and GMT+3 in summer, so that the New York 17:00 close falls at midnight. A rule written in fixed server hours therefore moves by one hour against New York twice a year on a GMT server. The script converts the wall-clock entry time to server time for each day, with US and UK daylight saving rules:
bool USDst(datetime g) { int y=YearOf(g); return g>=NthSunday(y,3,2)+7*3600 && g<NthSunday(y,11,1)+6*3600; }
bool UKDst(datetime g) { int y=YearOf(g); return g>=LastSunday(y,3)+3600 && g<LastSunday(y,10)+3600; }
int  NYOff(datetime g) { return USDst(g)?-4:-5; }  // NY = GMT + this
int  LDOff(datetime g) { return UKDst(g)?1:0; }
// server = GMT + this (hours), at GMT time g
int  SrvOff(datetime g) { if(ServerClock==SRV_GMT) return 0; if(ServerClock==SRV_NY_PLUS7) return NYOff(g)+7; return gFixedOff; }
datetime ToServer(datetime wall)
  {
   datetime g=wall;
   if(Clock==CLOCK_NEWYORK)
      g=wall-NYOff(wall+5*3600)*3600;
   else
      if(Clock==CLOCK_LONDON)
         g=wall-LDOff(wall)*3600;
      else
         return wall;
   return g+SrvOff(g)*3600;
  }
US daylight saving starts on the second Sunday of March at 02:00 local time (07:00 GMT) and ends on the first Sunday of November at 02:00 local (06:00 GMT). UK summer time runs from the last Sunday of March to the last Sunday of October at 01:00 GMT. SRV_NY_PLUS7 covers the "New York close" servers: their offset is New York time plus 7 hours all year. SRV_FIXED_NOW uses today's offset for all history, which is correct for brokers that never change their clock.
Cost and swap
The cost of each trade is the entry bar's recorded spread, with 1.5 times today's live spread as a floor. Swap is converted to a percentage of price for every swap mode MetaTrader supports, so the result is comparable across symbols:
double CostAt(string s,const MqlRates &e,double live) { double pt=SymbolInfoDouble(s,SYMBOL_POINT); double bar=(e.open>0)?e.spread*pt/e.open*100.0:0; return MathMax(live,bar)+ExtraCostPct; }
double SwapPct(string s,bool lng)
  {
   double sw=SymbolInfoDouble(s,lng?SYMBOL_SWAP_LONG:SYMBOL_SWAP_SHORT), px=Mid(s);
   if(px<=0)
      return 0;
   double pt=SymbolInfoDouble(s,SYMBOL_POINT), tv=SymbolInfoDouble(s,SYMBOL_TRADE_TICK_VALUE), ts=SymbolInfoDouble(s,SYMBOL_TRADE_TICK_SIZE), cs=SymbolInfoDouble(s,SYMBOL_TRADE_CONTRACT_SIZE);
   double notional=(ts>0)?px/ts*tv:cs*px;
   switch((ENUM_SYMBOL_SWAP_MODE)SymbolInfoInteger(s,SYMBOL_SWAP_MODE))
     {
      case SYMBOL_SWAP_MODE_POINTS:
         return sw*pt/px*100.0;
      case SYMBOL_SWAP_MODE_CURRENCY_SYMBOL:
      case SYMBOL_SWAP_MODE_CURRENCY_MARGIN:
      case SYMBOL_SWAP_MODE_CURRENCY_DEPOSIT:
         return notional>0?sw/notional*100.0:0;
      case SYMBOL_SWAP_MODE_INTEREST_CURRENT:
      case SYMBOL_SWAP_MODE_INTEREST_OPEN:
         return sw/360.0;
      default:
         return 0;
     }
  }
int Nights(datetime t1,datetime t2,int r3) { int n=0; for(long d=DayOf(t1); d<DayOf(t2); d++) { int w=WdOf((datetime)(d*86400)); if(w==0||w==6) continue; n+=(w==r3)?3:1; } return n; }
Nights() counts the server midnights a trade crosses on weekdays and triples the one on the day returned by SYMBOL_SWAP_ROLLOVER3DAYS. A hold that stays inside one server day pays no swap. That matters a lot: the same 9-hour gold hold crosses midnight on a GMT server but not on a GMT+2/+3 server.
Two limits are worth stating. Today's swap rate is used for all history, and real swap rates changed with interest rates. And the bar spread field is a low value within the bar, which is why the live spread floor exists. For instruments with a dynamic spread, check the hours you trade with tick data (see SpreadClock below).
The trade loop
For each calendar day the script builds the entry time on the chosen clock, converts it to server time, and looks for the exact H1 bars at entry and exit. Days without both bars (holidays, gaps) are skipped rather than filled with a nearby bar:
int Run(const MqlRates &r[],int n,string s,int entryH,bool keep,datetime split,bool &wd[],double live,double sw,int r3,double &sum,double &sq)
  {
   int cnt=0;
   sum=0;
   sq=0;
   for(long d=DayOf(r[0].time)-1; d<=DayOf(r[n-1].time); d++)
     {
      datetime wall=(datetime)(d*86400)+entryH*3600;
      if(!wd[WdOf(wall)])
         continue;
      datetime eS=ToServer(wall), xS=eS+HoldHours*3600;
      int e=Exact(r,n,eS), x=Exact(r,n,xS);
      if(e<0||x<0)
         continue;
      double mv=(r[x].open/r[e].open-1)*100*(GoLong?1:-1);
      if(StopPct>0)
        {
         double lvl=r[e].open*(1+(GoLong?-1:1)*StopPct/100.0);
         for(int i=e;i<x;i++)
           {
            if(GoLong? r[i].low<=lvl : r[i].high>=lvl)
              {
               mv=-StopPct;
               break;
              }
           }
        }
      int nights=Nights(r[e].time,r[x].time,r3);
      double gross=mv-CostAt(s,r[e],live), net=gross+sw*nights;
      cnt++;
      sum+=net;
      sq+=net*net;
      if(keep)
        {
         Acc(0,net);
         Acc(r[x].time<split?1:2,net);
         Acc(3,gross);
         Acc(10+WdOf(wall),net);
         Acc(100+YearOf(r[x].time)-2000,net);
        }
     }
   return cnt;
  }
Entry and exit both use the bar open, which is the first price of the hour. The stop is checked on the highs or lows of the bars held, and when it is touched the trade loses exactly the stop distance, with no allowance for a gap through the stop. With a stop set, treat the result as slightly optimistic.
Results go into buckets: all trades, in-sample, out-of-sample, before swap, each weekday and each year. Each bucket keeps a sum and a sum of squares, so the mean and the t-statistic come straight from them:
double S[200],Q[200];
int N[200];
void Acc(int b,double v) { if(b<0||b>=200) return; S[b]+=v; Q[b]+=v*v; N[b]++; }
void St(int b,double &mu,double &t) { mu=0; t=0; if(N[b]<2) return; mu=S[b]/N[b]; double sd=MathSqrt(MathMax(1e-14,(Q[b]-N[b]*mu*mu)/(N[b]-1))); t=mu/(sd/MathSqrt(N[b])); }
The t-statistic is the mean divided by its standard error. As a rough guide, t below 1.5 is noise, t of 2 means a result this large would appear by chance about one time in twenty if the true edge were zero, and t of 3 about one time in 370. Because many rules are usually tried before one is reported, I treat t 2 out-of-sample as the minimum, not as proof.
The baseline
After the main rule, the script runs the same hold, on the same weekdays, from each of the 24 entry hours, and counts how many other hours did as well:
for(int h=0;h<24;h++)
  {
   double su,sq;
   int c=Run(r,n,s,h,false,split,wd,live,sw,r3,su,sq);
   if(c<2)
      continue;
   double mu=su/c, sd=MathSqrt(MathMax(1e-14,(sq-c*mu*mu)/(c-1))), t=mu/(sd/MathSqrt(c));
   tot++;
   double m0,t0;
   St(0,m0,t0);
   if(h!=EntryHour && mu>=m0)
      better++;
   Out(StringFormat("   %02d:00 %s n %5d | avg %+7.2f bp | t %6.2f%s",h,h==EntryHour?"*":" ",c,mu*100,t,h==EntryHour?"  <- your rule":""));
  }
If many other hours do as well, the result is the market's drift, not the timing. This is the cheapest test there is, and it is the one most published backtests leave out.
The report
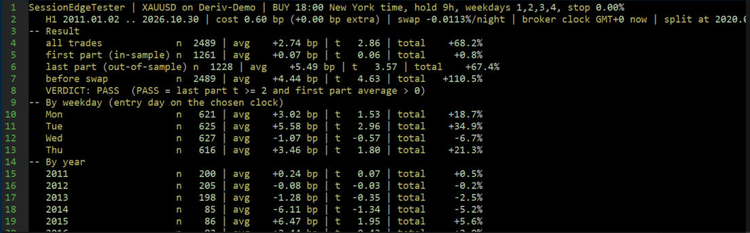
The script prints the result for all trades, the in-sample and out-of-sample parts, the result before swap, each weekday, each year, and the baseline. It then gives a verdict: PASS (out-of-sample t ≥ 2 and in-sample mean > 0), WATCH (out-of-sample t ≥ 1.5 and in-sample mean > 0) or FAIL. The output goes to the Experts tab and to MQL5\Files\SessionEdgeTester.txt.
How to run it
- Copy SessionEdgeTester.mq5 to MQL5\Scripts and compile it in MetaEditor (F7).
- Open a chart of the symbol and drag the script onto it.
- Set ServerClock for your broker. If the server time shown in Market Watch is GMT+2 in winter and GMT+3 in summer, choose SRV_NY_PLUS7. If it is GMT all year, choose SRV_GMT.
- Write the rule on the clock the market uses: New York time for US sessions and gold, London time for European sessions.
- Set ExtraCostPct if your account pays commission. For example, $7 per round lot on EURUSD at 1.08 is about 0.0065%.
- Read the in-sample line first, then the out-of-sample line, then the baseline. Only then look at the total.
The survivor: gold at 18:00 New York
The rule: buy XAUUSD at 18:00 New York time, sell 9 hours later at 03:00 New York, Monday to Thursday evenings. 18:00 is when the metals market reopens after the daily break, and 03:00 is the start of the London session.
On Deriv MT5 data from January 2011 to October 2026 (2,489 trades), after costs and swap:
| Part | Trades | Average per trade | t-stat |
|---|---|---|---|
| All | 2,489 | +2.74 bp | 2.86 |
| First 60% (2011 - mid 2020) | 1,261 | +0.07 bp | 0.06 |
| Last 40% (mid 2020 - 2026) | 1,228 | +5.49 bp | 3.57 |
| Before swap | 2,489 | +4.44 bp | 4.63 |
By weekday (the evening the trade opens): Monday +3.02 bp, Tuesday +5.58 bp, Wednesday -1.07 bp, Thursday +3.46 bp. Friday evening is excluded because the market closes for the weekend.
The baseline is the strongest part of the evidence. The same 9-hour hold, started at each of the other 23 hours, never did as well. Most other hours lost money after costs. The timing matters, not just gold's rise.
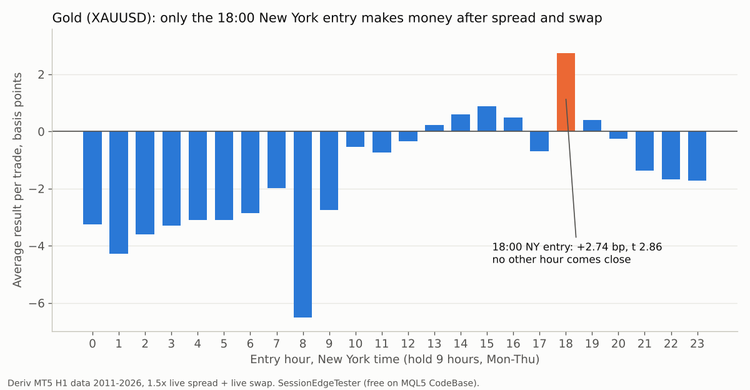
The chart also shows something less comfortable. The neighbouring hours are close to zero: 17:00 is negative and 19:00 is only slightly positive. A real effect tied to the reopen would explain that, since at 17:00 the market is closed or barely open. But it also means the result depends on one exact hour, and a sharp single peak is what an unlucky data-mined result looks like too. That is why the in-sample and out-of-sample split and the year-by-year view matter more than the total.
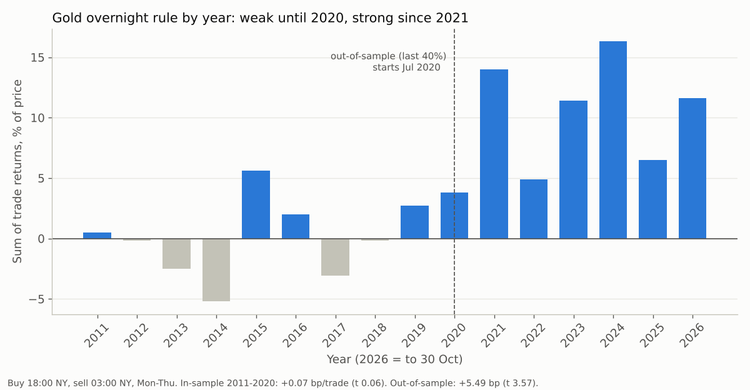
The weaknesses are just as clear, and you should know them before trading it:
- It is recent. The first 60% of history is flat: from 2012 to 2018 the yearly sums are close to zero or negative. The effect appears from about 2019 and is strong from 2021. It may be tied to the current gold bull market and could fade.
- The weekdays matter. Including Sunday evenings, the weekly reopen, drops the result to +1.56 bp, t 1.68: Sunday nights averaged -3.2 bp. Leaving Sunday out is reasonable, because the weekly reopen has the widest spread of the week, but it is a choice made after looking at the data, and you should know that.
- Wednesday is negative. Wednesday evenings averaged -1.07 bp after costs. On a GMT broker that night also carries triple swap, so skipping it there is a cost rule rather than a curve fit.
- Swap takes a large share. Before swap the rule makes +4.44 bp; after swap +2.74 bp. On a broker with a larger long swap on gold, the edge would be smaller. On a GMT+2/+3 broker the hold stays inside one server day and pays no swap at all.
- The clock matters. The earlier Strategy Tester version used a fixed 22:15 server time on a GMT server. In US winter that is 17:15 New York, before the reopen. That version, over 2023-2026, made +$1,136 on 0.05 lot with t 0.46. Part of the difference is the shorter period, but a rule that is tied to the reopen has to be written in New York time.
- A tight stop hurts. The same Strategy Tester run with a 2% emergency stop turned +$1,136 into -$83, because overnight dips that recovered by the morning were locked in as losses.
- The edge per trade is small. About 2.7 bp a night is roughly $1.10 per 0.01 lot at today's gold price. It is worth trading only with tight costs and a sensible size.
Spread timing: why the entry waits
A rule this thin depends on cost. I measured the XAUUSD spread for every server hour over 20 days, 7.6 million ticks, with a second free script, SpreadClock. On a GMT broker the spread is about 15 points for most of the day, but 28 to 35 points around the daily rollover, more than twice normal. That is the hour just before the gold entry.
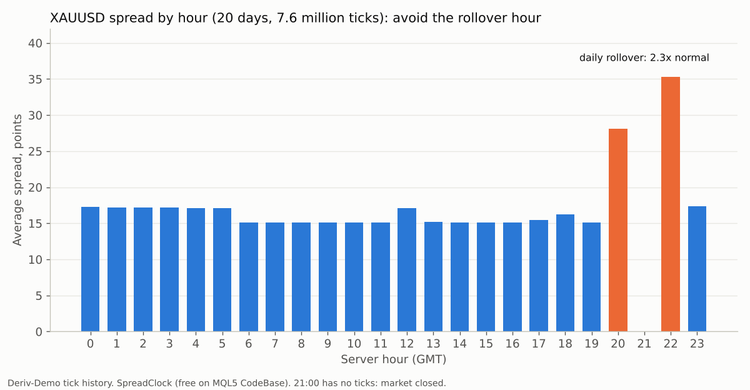
SpreadClock reads real bid/ask ticks with CopyTicksRange in one-day chunks, so it stays inside the terminal's tick limits, and keeps a capped sample per hour for the median and the 95th percentile:
for(datetime d=from; d<to && !IsStopped(); d+=86400)
  {
   MqlTick t[];
   int c=-1;
   for(int a=0;a<3 && c<0;a++)
     {
      c=CopyTicksRange(s,t,COPY_TICKS_INFO,(ulong)d*1000,(ulong)MathMin((long)to,(long)d+86400)*1000-1);
      if(c<0)
         Sleep(300);
     }
   if(c<=0)
      continue;
   for(int i=0;i<c;i++)
     {
      if(t[i].bid<=0 || t[i].ask<=0 || t[i].ask<t[i].bid)
         continue;
      double sp=(t[i].ask-t[i].bid)/pt;
      MqlDateTime m;
      TimeToStruct(t[i].time,m);
      int h=m.hour;
      hsum[h]+=sp;
      hcnt[h]++;
      hpx[h]+=(t[i].ask+t[i].bid)/2;
      if(hn[h]<MaxTicksPerHour && hn[h]<2000)
         hs[h][hn[h]++]=sp;
      else
        {
         int k=(int)(MathRand()%(int)MathMax(1,(int)hcnt[h]));
         if(k<hn[h])
            hs[h][k]=sp;    // reservoir sample
        }
     }
  }
The sample array is global (24 hours × 2,000 values) because it is too large for the stack. The average spread per hour uses every tick; the median and 95th percentile use the reservoir sample.
So the live version of the rule waits for the spread to return to normal before entering, for up to 90 minutes. On a GMT+2/+3 broker the entry is at 01:00 server time and the exit at 10:00, inside one server day, so no swap is charged at all.
Position size: what a thin edge means in money
The 2,489 trades have a standard deviation of about 48 bp per night (from the mean of 2.74 bp and t 2.86). So the edge is about one seventeenth of the normal overnight noise. Most nights are decided by the noise, and the edge only shows over hundreds of trades.
A fixed-lot simulation on a $1,000 Deriv account, 0.01 lot, Monday, Tuesday and Thursday evenings, with a 2.3% stop, gave these results:
| Period | Net | Per year | Max drawdown | Worst month | Months positive |
|---|---|---|---|---|---|
| 2011-2026 (1,862 nights) | +$1,791 | +$113 | $478 (16%) | -$213 | 61% |
| Last 5 years | +$1,563 | +$313 | $478 (17%) | -$213 | 68% |
From 2012 to 2018 the same book was about flat (-$106 over seven years). Most of the dollar profit came after 2021, partly because gold doubled in price, which also doubled the value of 0.01 lot. At today's price one overnight standard deviation at 0.01 lot is about $31, 3% of a $1,000 account, and a stop-out costs about $92. To keep the nightly risk near 1% of equity, the account needs roughly $3,000 per 0.01 lot. On a very small account the minimum lot is simply too big for this rule.
From a surviving rule to an EA
A rule that passes is still not a trading system. The version I run on demo accounts adds:
- position size from recent overnight volatility, targeting a fixed percentage of equity per one-sigma move;
- a hard stop at three sigma, capped at a fixed percentage of the account (wide, because the tight stop test above showed what a 2% stop does);
- a maximum-spread filter and a wait of up to 90 minutes for a normal spread;
- skipping nights with expensive swap on brokers whose hold crosses midnight;
- daily and total drawdown limits, so it can run on prop-firm accounts;
- a self-check that stops the strategy if live results fall far below the backtest.
The last point is easy to skip and important. A backtest gives an expected result per trade and its spread. After 50 or 100 live trades you can test whether the live mean is consistent with the backtest. If it is far below, the broker's real costs or fills differ from the history, and the EA should stop rather than wait for a drawdown to prove it.
The other practical risk is that an automated setup stops without telling you: the PC sleeps, the terminal disconnects, or algo trading is switched off by a profile change. For that I use the third free tool, BotWatchdog, an EA that places no trades and sends a push notification to the MetaTrader mobile app when the connection drops, algo trading is switched off, a watched EA is missing from its chart, a position has no stop-loss, or equity or margin hit a limit, plus a daily "all OK" heartbeat.
Checklist before you trade or buy a rule
- Costs: does the backtest charge your broker's real spread at the hours traded, commission and swap? Check variable-spread instruments with tick data.
- Held-back data: were the settings fixed before the last part of the history was seen? Show both halves.
- Baseline: does the same holding period from other hours, or a random entry with the same stop and target, do as well?
- Independence: are correlated markets counted once per date?
- Regime: does the rule make money in each kind of year, or only in one trend?
- Size: at your minimum lot, what is one normal day's move as a percentage of your account?
- Live check: after 50-100 live trades, is the result per trade consistent with the backtest?
Conclusion
Out of about 49,000 backtests and a dozen targeted studies, the clear survivor was one simple timing rule on gold, and even that one has only worked strongly for about five years. Scalping, intraday momentum, opening-range breakouts, mechanical Smart Money Concepts entries, breakout fades, dip-buying, trend portfolios, pairs, stock-index overnight holds and every synthetic index failed once real costs, held-back data and a baseline were applied. Several of them looked excellent before one of those checks was added.
That is the realistic picture. Most strategies sold or shared online have never been tested against their own broker's spread, swap and an honest out-of-sample period. SessionEdgeTester does the first three checks for any time-of-day rule in about 20 seconds. If a rule fails them, it saves you money. If it passes, you know how small the edge is and where it can break.
Attached: SessionEdgeTester.mq5 (script). Also free in CodeBase: SpreadClock (spread by hour from tick history) and BotWatchdog (phone alerts when an EA, the connection or algo trading stops).




