
From Entry to TP1: How I Managed 3 Gold Buys with a Clear Plan on Screen

The hard part of a gold trade usually starts after it turns green. Floating profit grows, the first target gets close, and the same two thoughts show up: close it before it reverses, or leave it alone and hope. This November 5 trade is a good example of a third option, which is to move protection step by step against levels that are already on the chart.
What gold did today
On the broker’s M5 chart, XAUUSD pushed up toward 4138 around midday, then sold off for most of the afternoon and bottomed near 4111. Then it reversed sharply, and the buy signal came as price started climbing back. It was a choppy session with a lot of two-way movement, the kind where a plan written in advance is worth more than a feeling. 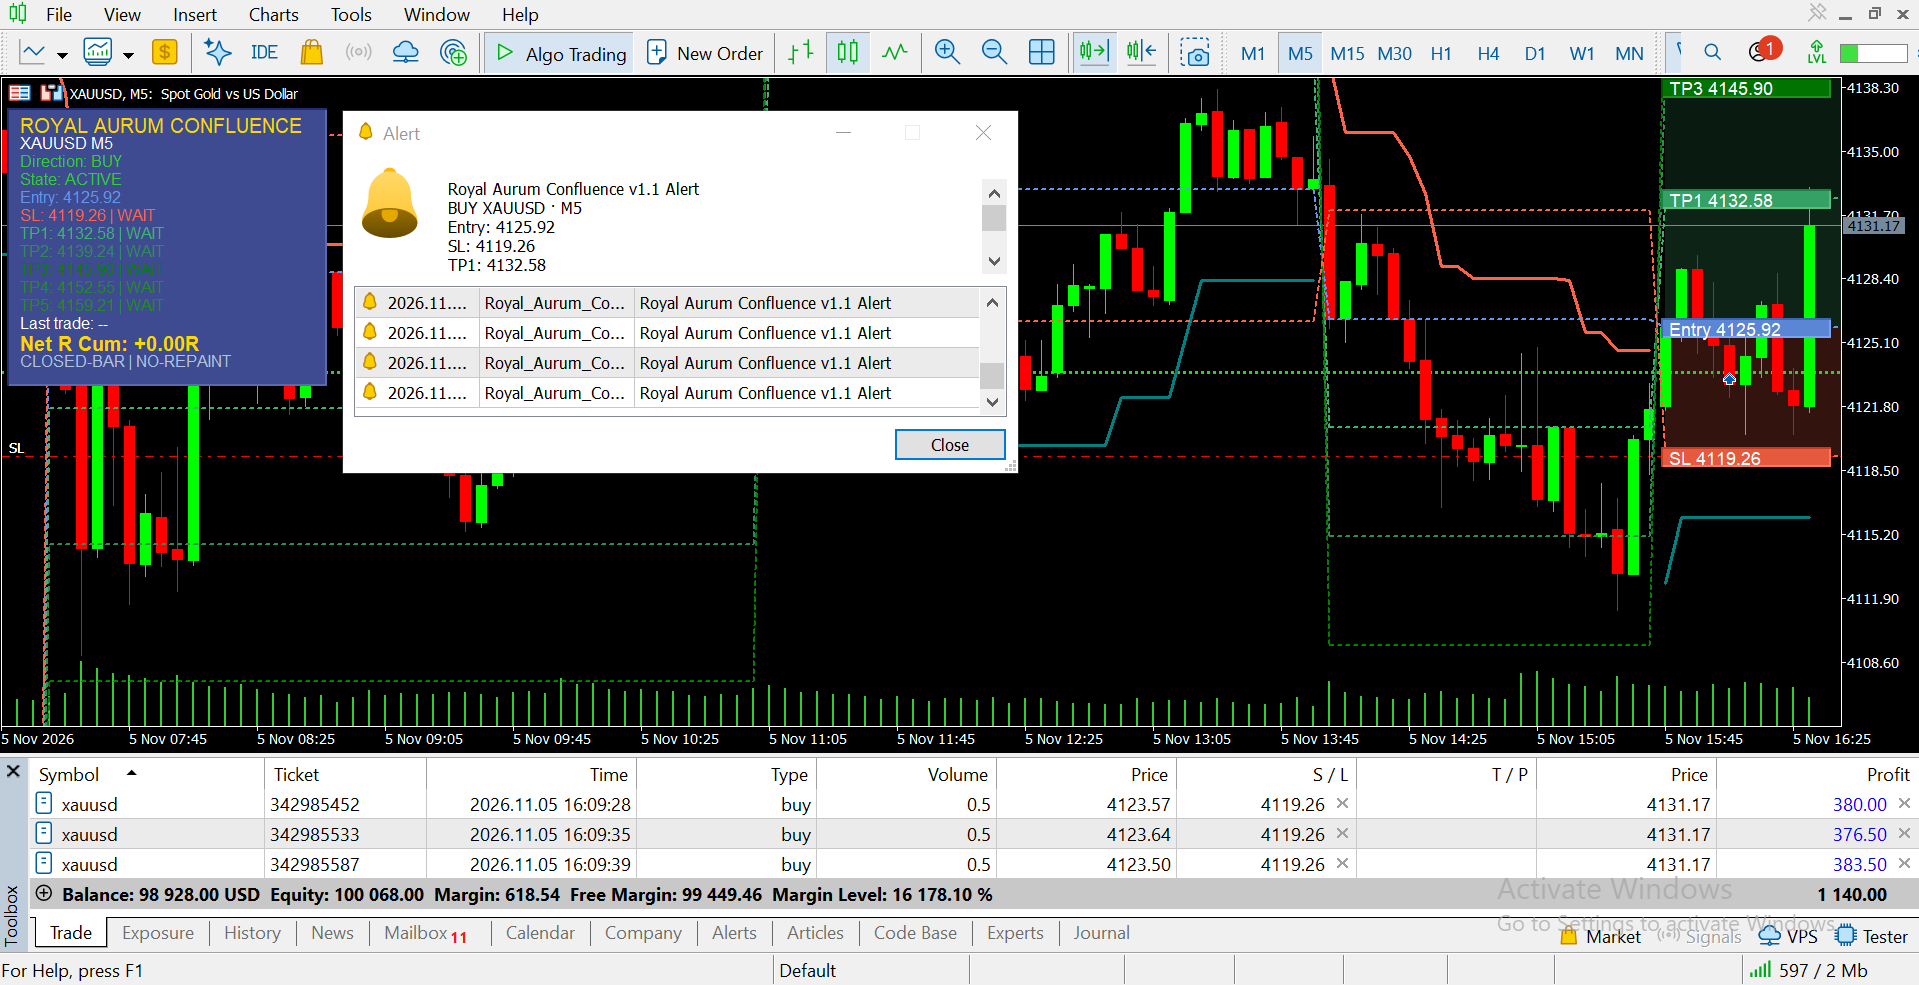
Royal Aurum Confluence printed a BUY plan on a closed M5 candle: entry 4125.92, stop 4119.26, first target 4132.58, with the other targets above it. I opened three 0.5-lot positions on my live account at 4123.57, 4123.64 and 4123.50, slightly below the printed entry because price was still pulling back when I clicked. At this point price was at 4131.17 and floating profit was $1,140.00. The stops were still at 4119.26, so the original risk was fully in place.
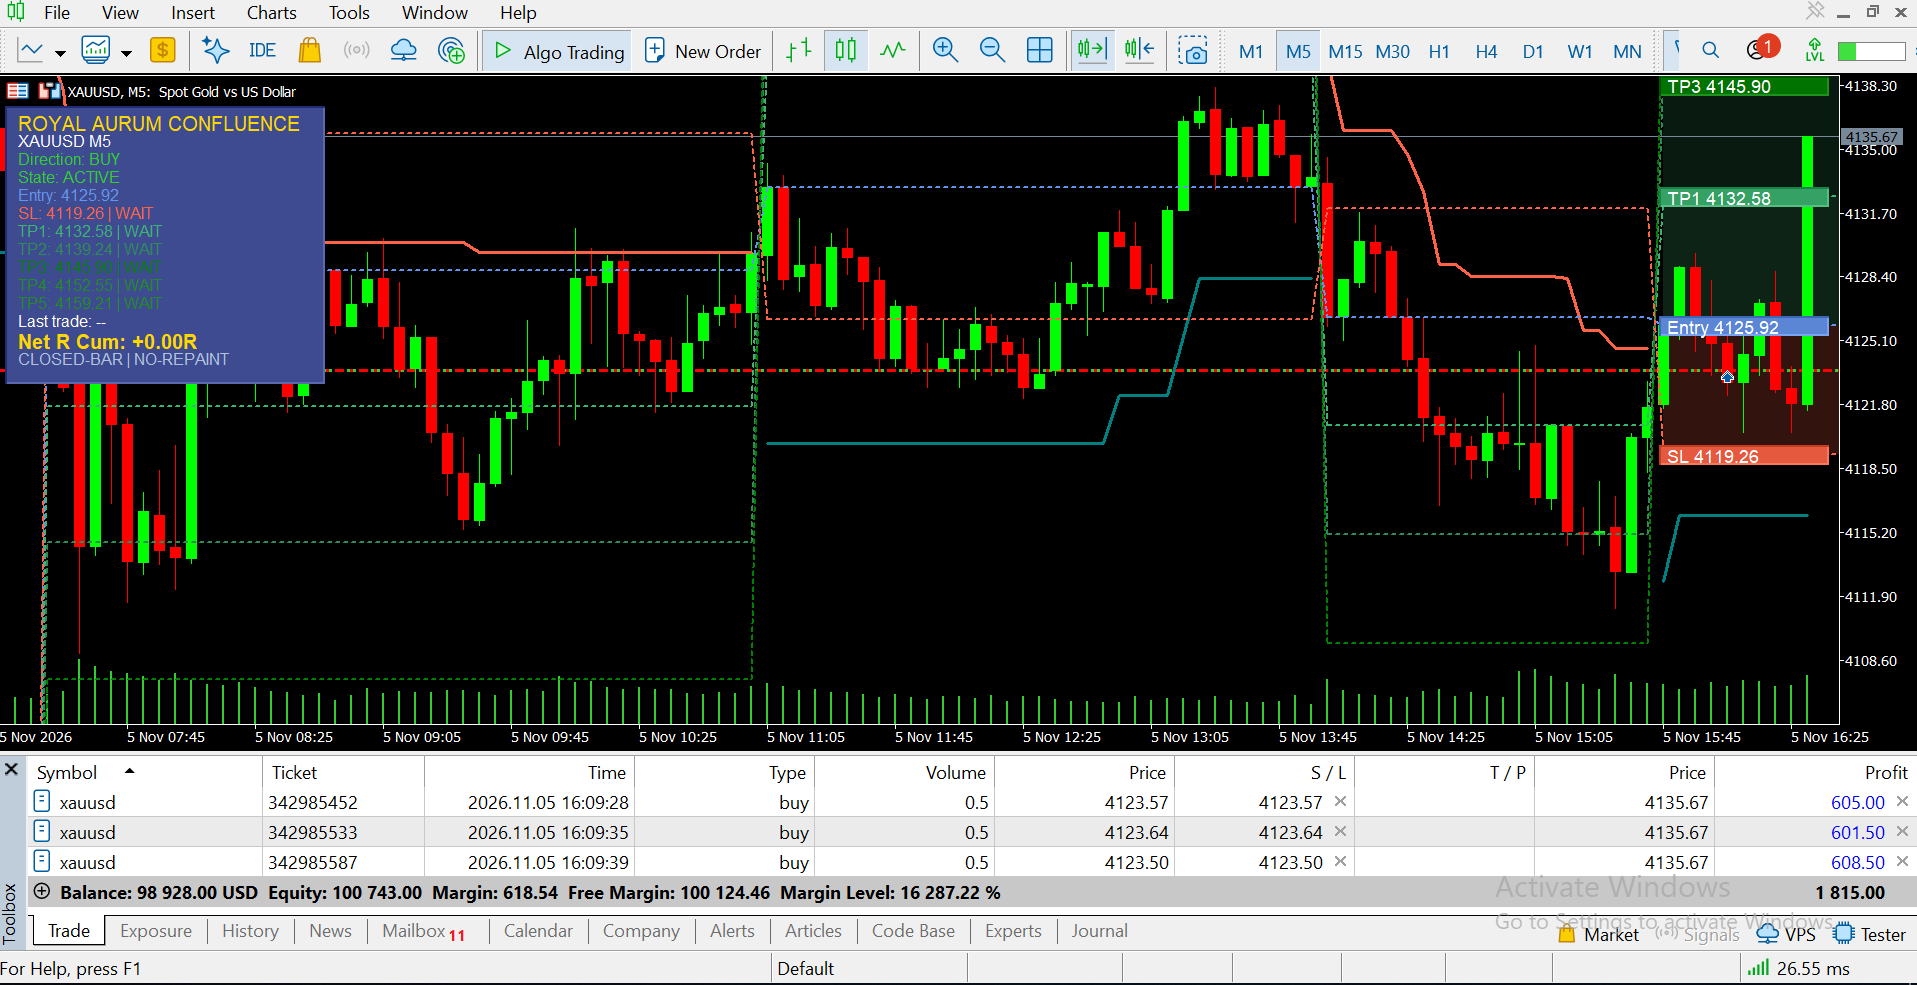
Gold kept pushing and traded through the TP1 level up to 4135.67, with floating profit at $1,815.00. The panel still read WAIT for TP1, because the indicator works on closed bars and that candle was still forming. I didn’t wait for the label. I moved each stop to its own entry price, which is a manual decision, since the indicator only draws the levels. From that moment the trade could no longer turn into a loss, apart from normal slippage and costs.
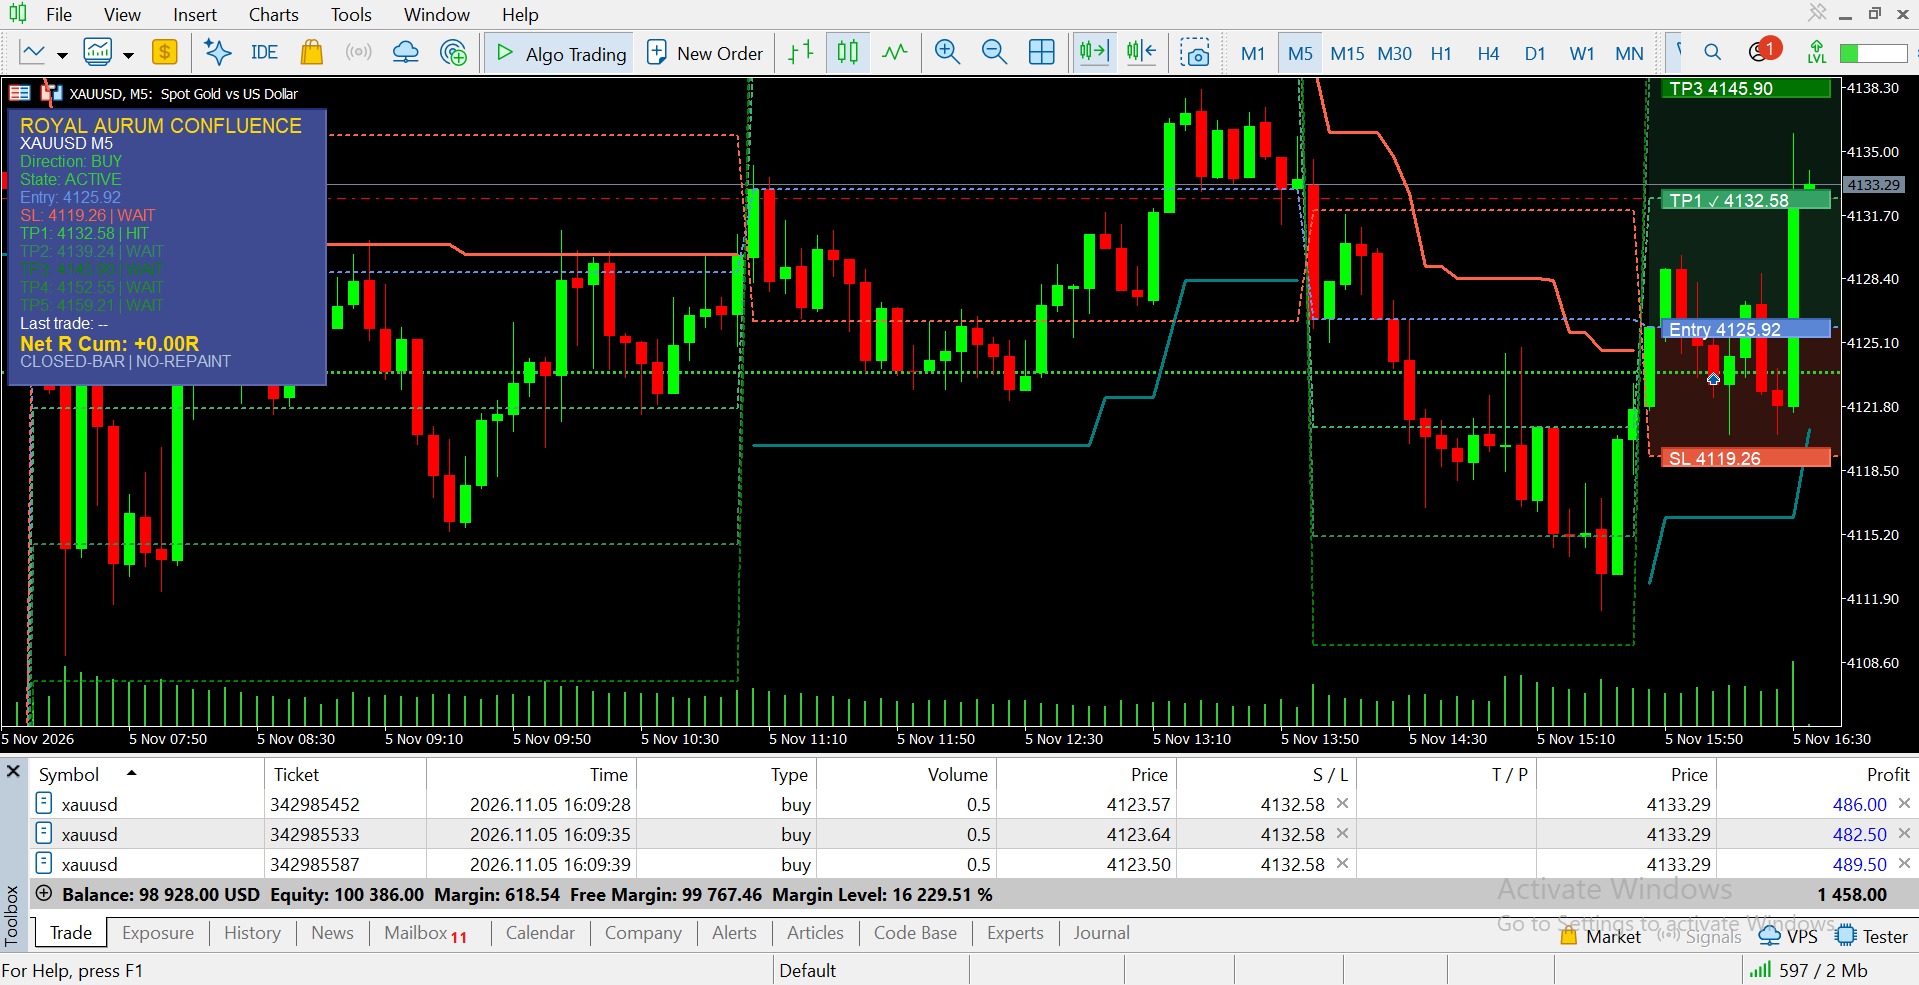
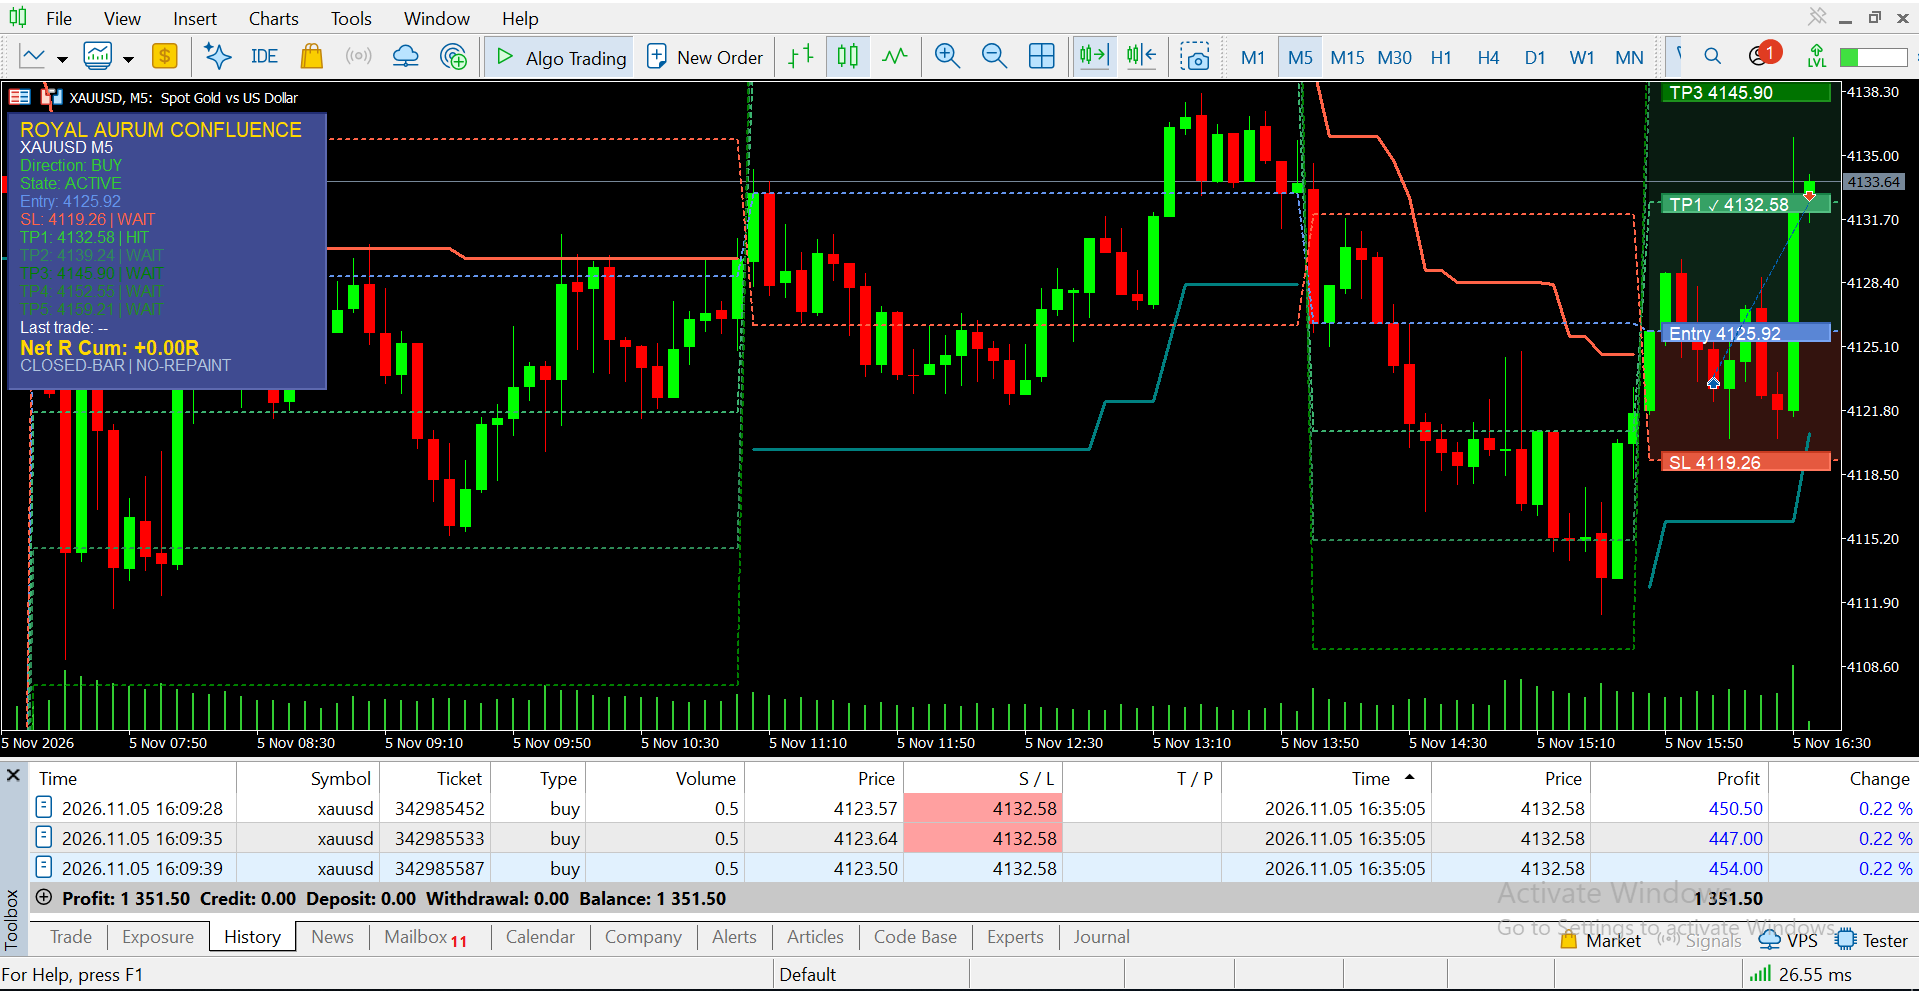
Price then pulled back to my stop and all three positions closed at 4132.58 at 16:35:05. History shows $450.50, $447.00 and $454.00, a total of $1,351.50. That is lower than the $1,815.00 that was floating a few minutes earlier. This is the honest cost of trailing: you give back part of the peak and in return you keep a result you can count. The panel still reads ACTIVE, because it follows the indicator’s setup and not my account.
That $1,351.50 is the result of this single trade on my account, not a projection, and one trade says nothing about tomorrow. Spread, execution and how you manage each position will shape your own results. What the trade shows is the value of having entry, stop and targets already on the chart, so each decision has a reference point instead of a mood.
If you trade XAUUSD and you want a clearer routine for the minutes after entry, test Royal Aurum Confluence on your own broker’s data. Start in the Strategy Tester, then use a demo account before risking real capital.
👉 Download Royal Aurum Confluence on MQL5: https://www.mql5.com/en/market/product/198358
Gold Algo Lab builds practical, risk-first MT5 tools for serious XAUUSD traders, shaped by 8 years of developing and trading real systems to help traders identify clearer setups, manage risk with greater confidence and execute with more discipline.




