
Challenge Odds PRO estimates how likely you are to pass a prop firm challenge and which risk per trade gives you the best chance. It runs a Monte Carlo simulation of thousands of challenges, built from your own trading results and the exact rules of your challenge. It does not predict prices, give signals or open trades.
This manual covers version 1.0.
1. Quick start
- Drag Challenge Odds PRO from the Navigator onto any chart. Symbol and timeframe do not matter: the indicator reads your trading results, not the prices on the chart.
- In Edge source, choose where your results come from: your account history, an HTML report, or manual parameters (section 2).
- In Rules preset, pick the rules of your challenge, or choose Custom and type them in (section 3).
- Set Risk per trade to the risk you plan to use, as a percentage of the initial balance.
- Press OK. The panel shows "Computing" for a few seconds, then the results.
To change anything later, open the indicator inputs again, or press Recalculate on the panel after new trades close.
2. Data sources
The simulation is only as good as the results you feed it. Use at least 30 closed trades; 100 or more is better. With fewer than 30 the panel shows a warning.
Account history
Reads the closed positions of the account the terminal is logged into. Each position counts once, net of commission, swap and fees. Open positions are ignored.
- Magic filter: -1 reads every position; a number reads only the positions of the Expert Advisor with that magic number. Manual trades usually have magic 0.
- Symbol filter: empty reads every symbol; type a symbol, for example EURUSD, to read only that one.
- History depth in days: 0 reads the whole history; 180 reads the last 180 days.
HTML report file
Reads the closed trades of a report saved by MetaTrader 5. Use it to check an Expert Advisor's backtest before you pay for a challenge, or to analyse an account you are not logged into.
- Save the report as HTML:
- Strategy Tester: after the test, open the Backtest tab, right-click and choose Report > HTML.
- Account: open the History tab of the Toolbox, right-click and choose Report > HTML.
- In MetaTrader 5 choose File > Open Data Folder, then open MQL5 > Files and copy the report there.
- Type the file name in Report file name, for example ReportTester.html. If you keep reports in the shared Common\Files folder, set Report is in Common\Files to true.
The indicator reads Strategy Tester reports (Deals table) and account reports (Positions table), in English and in several other terminal languages. The Symbol filter also applies to reports. If the file is missing or has no closed trades, the panel says why and switches to manual parameters.
Manual parameters
For when you have no history yet. Type your Win rate %, Average reward:risk, Trades per day and Costs per trade in R units (spread, commission and slippage as a fraction of the risk). Each simulated trade either wins reward:risk times the risk or loses the risk.
If Account history is selected but the account has fewer than 5 closed trades, the indicator also uses manual parameters and says so on the panel. This is what you see in the Strategy Tester demo, where there is no history.
3. Challenge rules
Choose a preset, or choose Custom and fill in the rule inputs. With a preset selected, the rule inputs below it are ignored; check that the preset matches your prop firm's rules exactly.
| Preset | Profit target | Max daily loss | Max total loss | Drawdown | Min trading days |
|---|---|---|---|---|---|
| 2-step, phase 1 | 10% | 5% | 10% | Static | 4 |
| 2-step, phase 2 | 5% | 5% | 10% | Static | 4 |
| 1-step trailing | 10% | 3% | 6% | Trailing | 0 |
- Max daily loss is measured from the balance at the start of each trading day.
- Max total loss, static: measured from the initial balance.
- Max total loss, trailing: measured from the highest closed balance reached so far.
- Maximum days: 0 means the challenge has no deadline. In that case Your horizon in trading days sets how long you are willing to trade it (60 by default). Without a horizon, risking less would always look better, because with no time limit a tiny risk almost never breaks the limits.
- Challenge fee and Fee currency label are used only to show the expected cost to pass.
4. Reading the panel
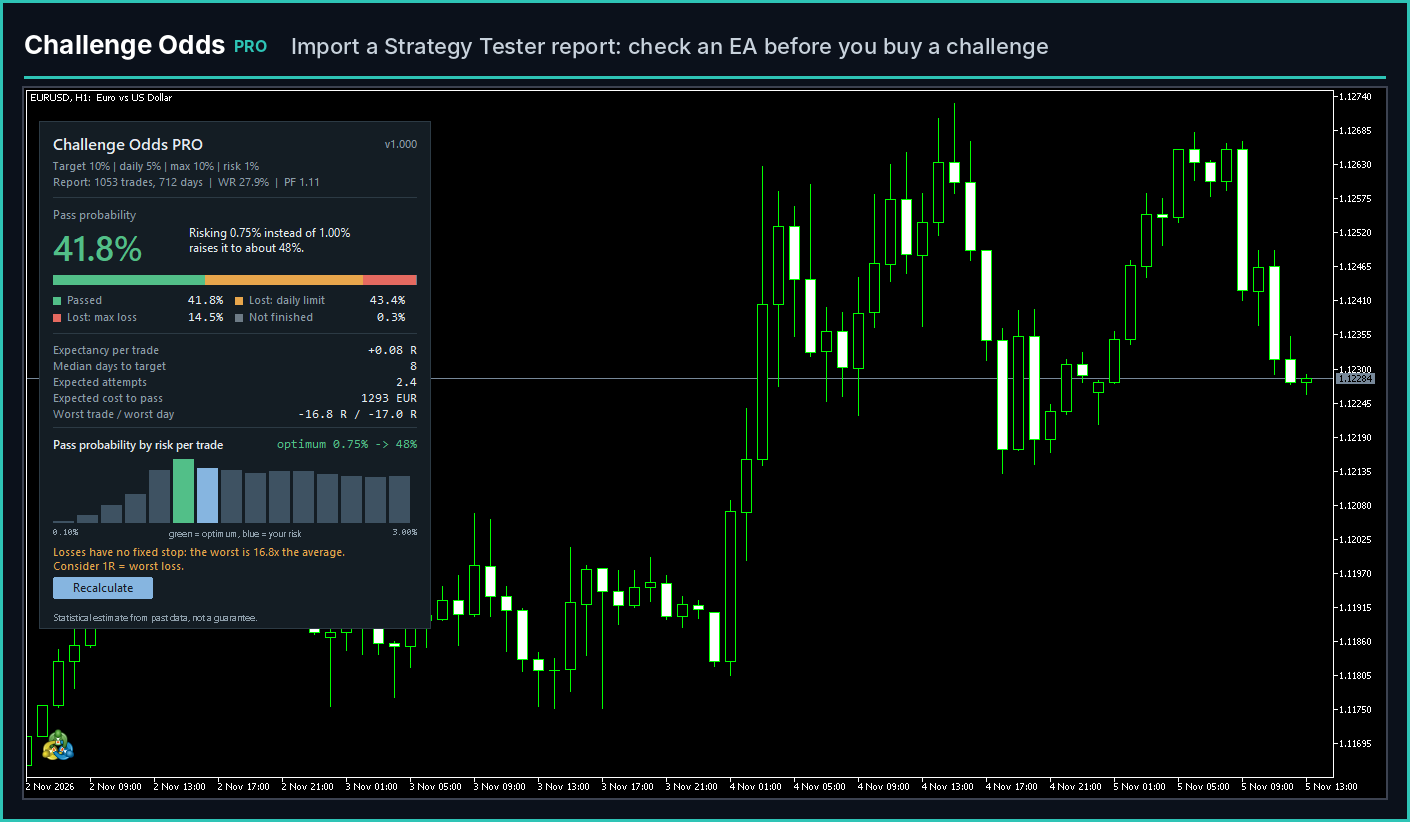
Image 1: panel with an imported Strategy Tester report
From top to bottom:
- Rules line: the target, daily and maximum loss and the risk being simulated.
- Source line: where the results come from, with the number of trades and trading days, win rate (WR) and profit factor (PF).
- Pass probability: the share of simulated challenges that reach the target within the rules and the time available.
- Verdict: whether your risk is already close to the best one, or which risk would raise the probability and by how much.
- Outcome bar: green = passed, orange = lost on the daily limit, red = lost on the maximum loss, grey = not finished in time. The four percentages below it add up to 100%.
- Expectancy per trade: the average result of one trade, in R. If it is negative, no risk level makes the challenge a good bet, and the panel says so.
- Median days to target: half of the passed challenges needed fewer trading days than this.
- Expected attempts: 1 divided by the pass probability. At 50% you need two attempts on average.
- Expected cost to pass: the challenge fee times the expected attempts.
- Worst trade / worst day (history and report only): the largest loss of a single trade and of a single day, in R.
- Pass probability by risk per trade: see section 5.
The orange outcome is often the most useful one. If most failed challenges end on the daily limit, the problem is losing streaks within the same day, and a lower risk, or fewer trades per day, usually helps more than a better entry.
5. The risk per trade curve
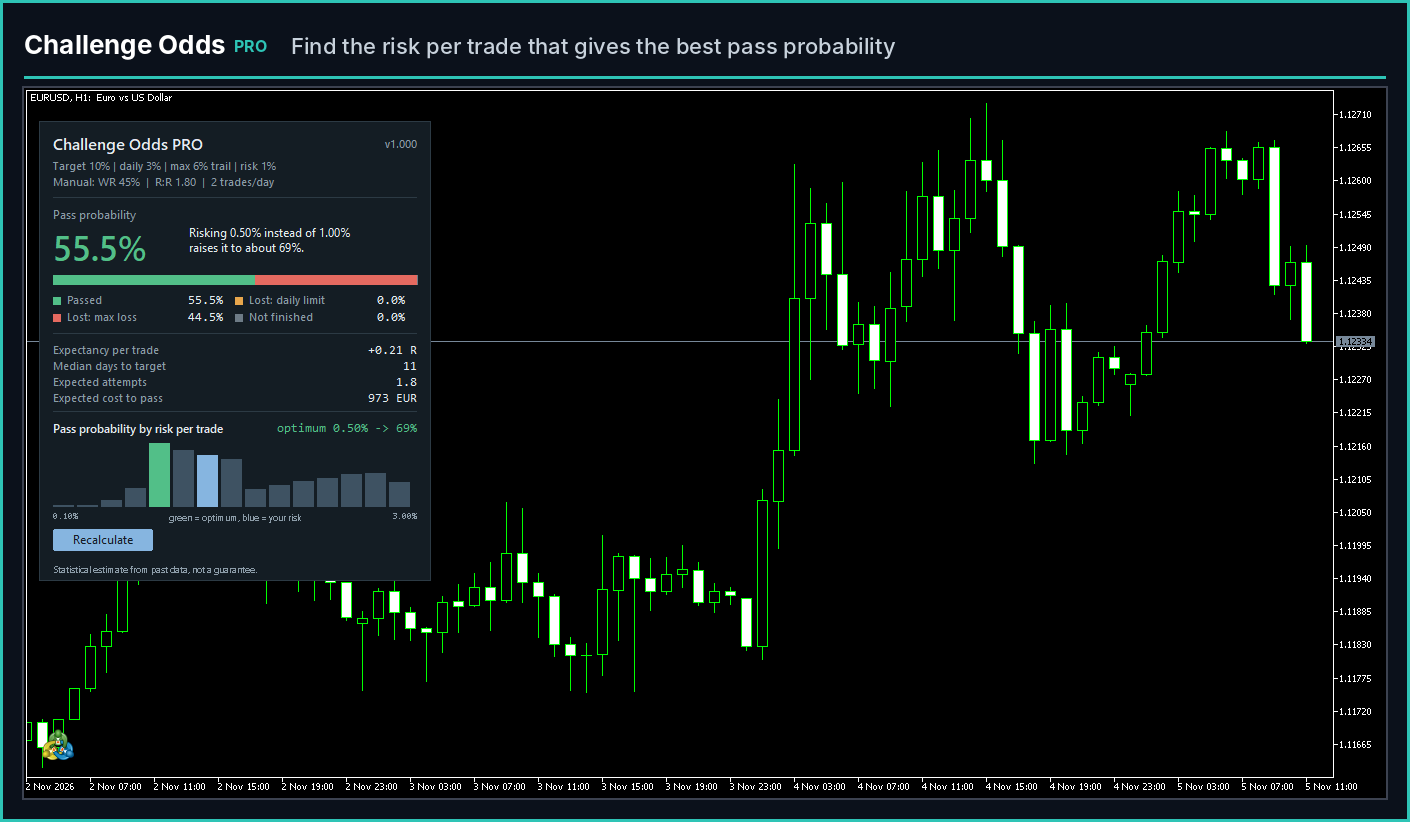
Image 2: same edge, 1-step trailing rules, the optimum at 0.50%
The bars show the pass probability at 15 risk levels from 0.10% to 3.00% of the initial balance, plus your own risk if it is not one of them. The green bar is the risk with the highest probability; the blue bar is your current risk. When they coincide, only the green bar is shown.
Every level is simulated on the same random sequence of trading days, so the differences between bars come only from the risk. Two things push in opposite directions:
- Too little risk: the target takes too long and the challenge runs out of time (grey).
- Too much risk: a losing day or a losing streak breaks the daily or maximum loss (orange or red).
The best risk depends on the rules. With the same edge, a 2-step challenge with a 5% daily limit and a 1-step trailing challenge with a 3% daily limit usually need different risks.
What 1R means
With account history or a report, the results are converted into R units:
- 1R = average loss (default): risking 1% means that an average losing trade costs 1% of the initial balance.
- 1R = worst loss: risking 1% means that the worst losing trade in the history costs 1%.
Use the average loss when your trades have a fixed stop loss. If the worst loss is more than 3 times the average, the panel warns you: losses without a fixed stop make the average misleading, and the worst loss is the safer unit. For use with Quantum Risk Manager PRO, which risks on the stop distance, the worst loss is the closer match.
6. Challenge in progress
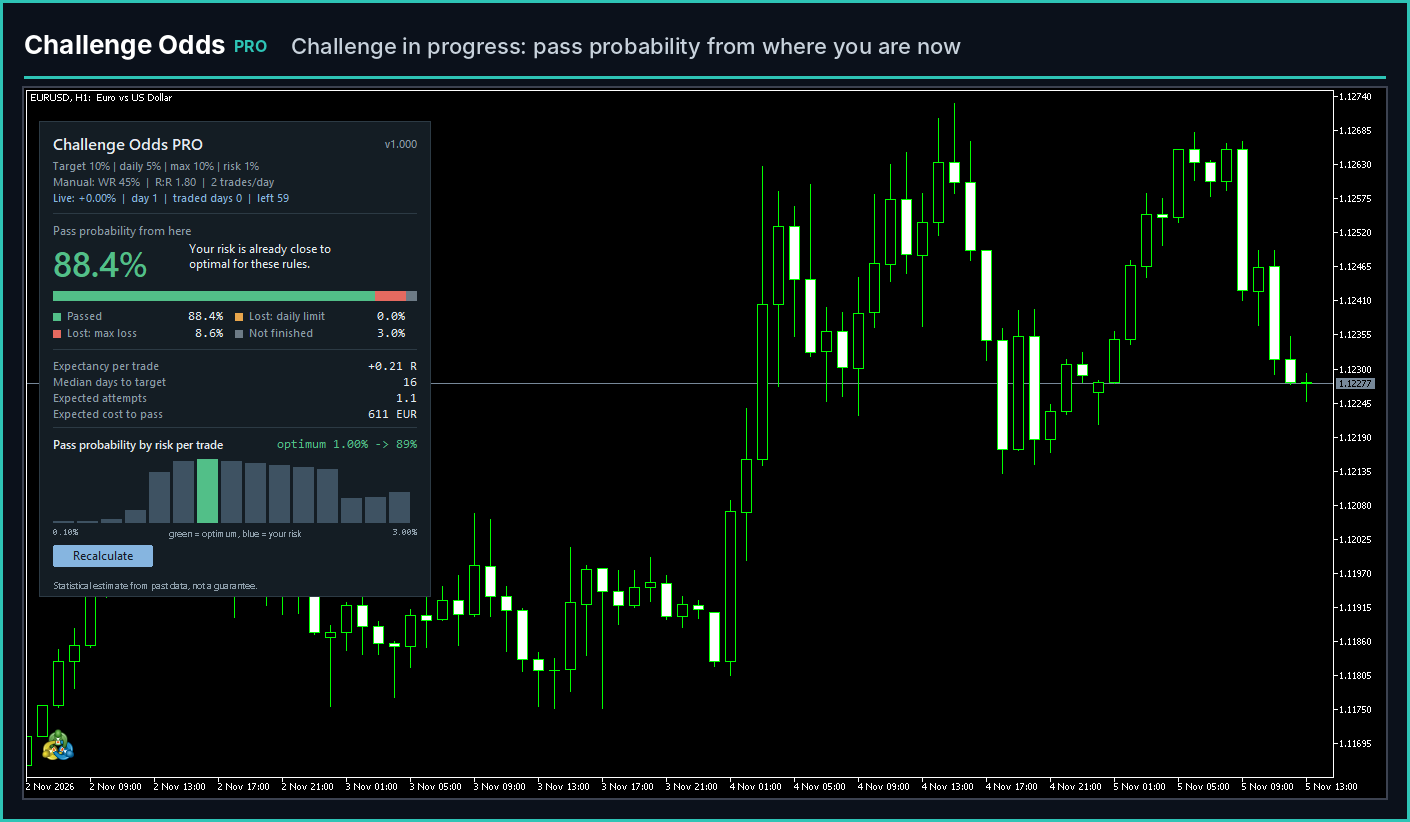
Image 3: Live line and pass probability from here
Attach the indicator to the challenge account and set:
- Track a challenge in progress: true.
- Challenge start date: the day the challenge began.
- Initial balance: 0 to let the indicator work it out (current balance minus the profit and loss of the trades closed since the start date), or the exact starting balance. Type it in if you deposited or withdrew money after the start.
The panel adds a Live line with your progress, the day of the challenge (weekdays since the start), the days you actually traded and the days left. The probability becomes Pass probability from here: the simulation starts from your current balance, your highest balance (for trailing rules) and the minimum trading days still missing. The risk curve answers the question that matters in the middle of a challenge: how much to risk from now on.
The indicator checks for new closed trades every 60 seconds (Check for new deals every N seconds) and recalculates when it finds one. Open positions are not included until they close.
When the challenge is over, the panel shows its state instead of the probability:
| Message | Meaning |
|---|---|
| Challenge passed | Target reached and minimum trading days completed |
| Target hit: N min days left | Target reached, minimum trading days not yet completed |
| Daily loss limit breached | Equity fell below today's limit |
| Max loss limit breached | Equity fell below the maximum loss limit |
| Out of time for your horizon | No trading days left in the deadline or in your horizon |
These checks are an estimate from the terminal's data. Your prop firm's dashboard is always the official record.
7. Using it with Quantum Risk Manager PRO (optional)
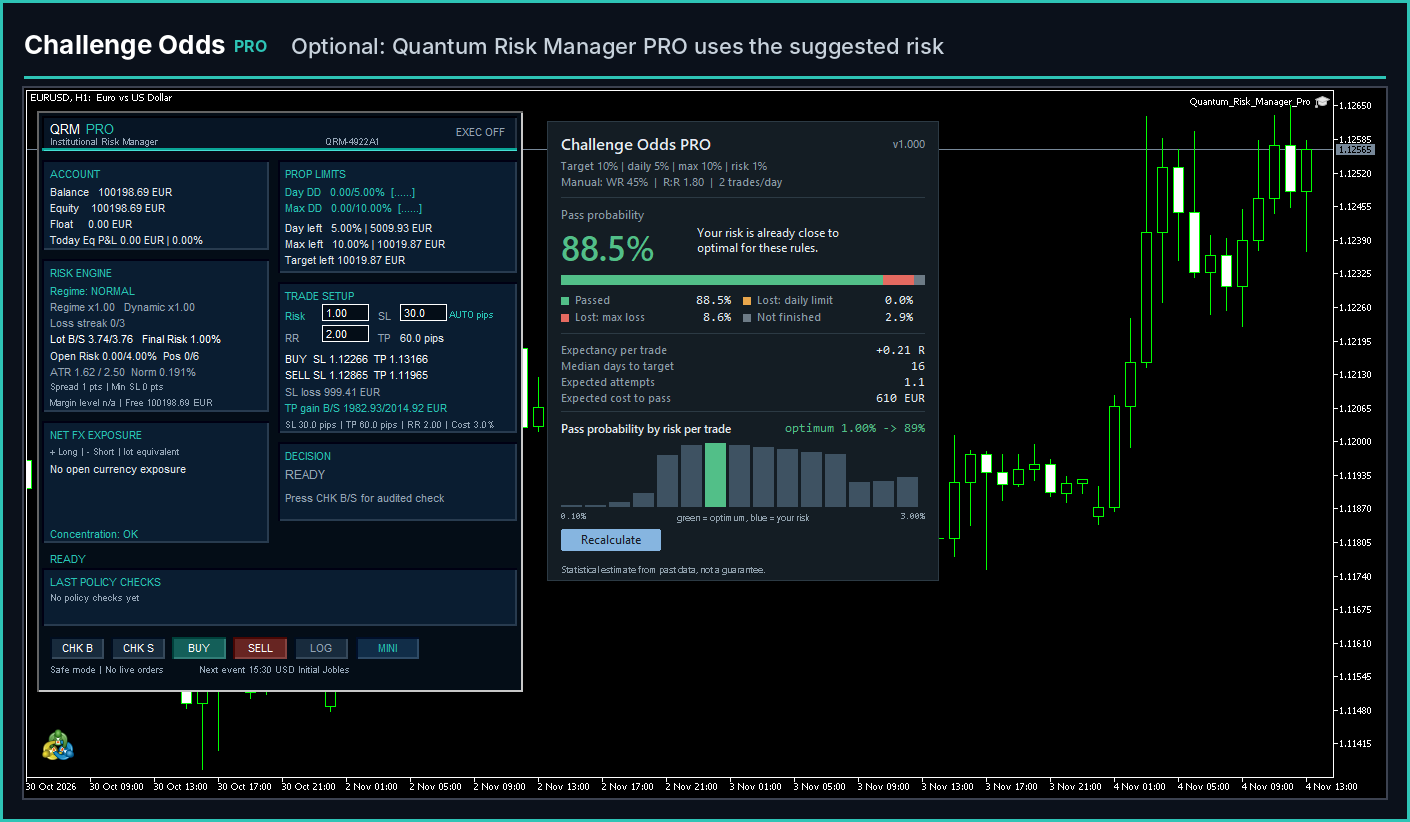
Image 4: QRM PRO with the Risk field taken from Challenge Odds PRO
Challenge Odds PRO works on its own. If you also use Quantum Risk Manager PRO v1.004 or later in the same terminal, QRM can take the suggested risk as its base risk.
- In Challenge Odds PRO, keep Publish risk to QRM PRO (one chart only) set to true.
- In QRM PRO, set Use risk per trade suggested by Challenge Odds PRO to true and choose Max risk accepted from Challenge Odds PRO (1% by default). QRM never goes above this cap.
- Use the same prop rules in both tools: profit target, daily loss and maximum loss.
When the link is active, the Risk field in QRM shows the suggested value, cannot be edited, and its label turns turquoise. QRM goes back to your manual risk, with a red label, when any of these is true:
- Challenge Odds PRO is not running, or has not sent a signal for more than 3 minutes.
- The expectancy is negative, or no risk level reaches 0.5% pass probability.
- The challenge in progress is already passed, breached or out of time.
- The rules simulated by Challenge Odds PRO differ from QRM's.
- A new calculation is running (for a few seconds after you change inputs).
Hover over the Risk field to read the reason. QRM's regime, loss streak, news and QIF multipliers and all its blocks still apply on top of the suggested risk.
One chart publishes. All instances in a terminal share the same channel to QRM. The first chart that starts publishes; on any other chart the panel shows "Another chart already publishes to QRM: these results are not sent." Those charts still calculate normally. Set Publish risk to QRM PRO to false on them to hide the message. If you remove the publishing chart, another one takes over within about 20 seconds.
8. Inputs reference
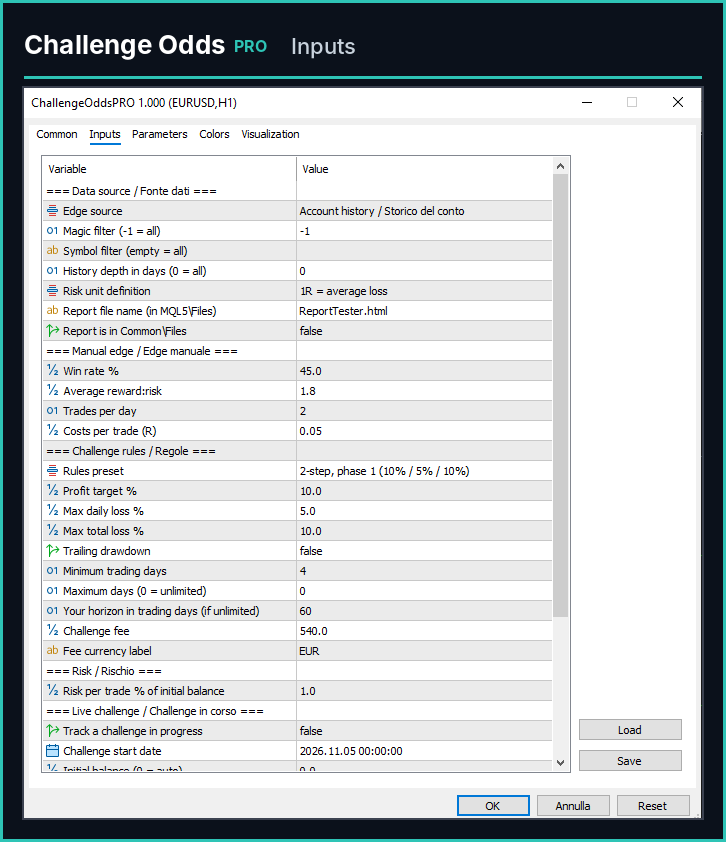
Image 5: inputs with default values
| Group | Input | Default | What it does |
|---|---|---|---|
| Data source | Edge source | Account history | Account history, Manual parameters or HTML report file |
| Data source | Magic filter | -1 | -1 = all positions; otherwise only that magic number |
| Data source | Symbol filter | empty | Empty = all symbols |
| Data source | History depth in days | 0 | 0 = whole history |
| Data source | Risk unit definition | 1R = average loss | Or 1R = worst loss (section 5) |
| Data source | Report file name | ReportTester.html | File in MQL5\Files |
| Data source | Report is in Common\Files | false | True to read from the shared Common\Files folder |
| Manual edge | Win rate % | 45 | Share of winning trades |
| Manual edge | Average reward:risk | 1.8 | Average win in R |
| Manual edge | Trades per day | 2 | Trades on each simulated day |
| Manual edge | Costs per trade (R) | 0.05 | Spread, commission and slippage per trade |
| Challenge rules | Rules preset | 2-step, phase 1 | Or Custom to use the rules below |
| Challenge rules | Profit target % | 10 | Custom only |
| Challenge rules | Max daily loss % | 5 | Custom only |
| Challenge rules | Max total loss % | 10 | Custom only |
| Challenge rules | Trailing drawdown | false | Custom only |
| Challenge rules | Minimum trading days | 4 | Custom only |
| Challenge rules | Maximum days | 0 | Custom only; 0 = no deadline |
| Challenge rules | Your horizon in trading days | 60 | Used when there is no deadline |
| Challenge rules | Challenge fee | 540 | For the expected cost to pass |
| Challenge rules | Fee currency label | EUR | Text shown next to the cost |
| Risk | Risk per trade % of initial balance | 1.0 | The risk you plan to use |
| Live challenge | Track a challenge in progress | false | Section 6 |
| Live challenge | Challenge start date | Day the challenge began | |
| Live challenge | Initial balance | 0 | 0 = worked out automatically |
| Live challenge | Check for new deals every N seconds | 60 | Minimum 10 |
| Engine & display | Simulations (main scenario) | 10000 | Simulated challenges at your risk |
| Engine & display | Simulations per risk level | 3000 | Simulated challenges for each bar of the curve |
| Engine & display | Publish risk to QRM PRO (one chart only) | true | Section 7 |
| Engine & display | Panel language | English | English or Italian |
| Engine & display | Panel X / Panel Y | 12 / 30 | Panel position in pixels |
More simulations give more stable numbers but take longer. The calculation runs in short slices in the background, so the terminal stays responsive at any setting.
9. How the simulation works, and its limits
Each simulated challenge is built day by day. With account history or a report, every simulated day is one of your real trading days, drawn at random with replacement: the trades of that day, in their original order and number. This keeps losing streaks within a day realistic, which is what usually breaks a daily limit. With manual parameters, each day has the set number of trades, each won or lost at random with your win rate.
After every trade the simulation checks, in this order, the daily limit, the maximum loss (static or trailing) and the target. A challenge that reaches the target before the minimum trading days is counted as passed on the day the minimum is reached, assuming you then trade with negligible risk until then.
Keep these limits in mind:
- The past is not the future. The estimate assumes your next trades will look like your past ones. A strategy that stops working, or a change in your trading, changes the real odds.
- Days are independent. Real markets have calm and volatile periods that last weeks. The simulation does not keep that order, so it can underestimate long losing streaks.
- Closed balance. Limits are checked on closed trades. Many prop firms also check floating equity during the day, so the real daily limit can be hit earlier than simulated.
- Server day. A trading day follows the broker's server clock. Your prop firm may reset its daily limit at a different time.
- Fixed risk. The risk is a fixed percentage of the initial balance on every trade. Changing size during the challenge changes the odds.
- Sample size. With fewer than 30 trades the numbers can move a lot when you add a few more trades.
The results are statistical estimates based on past data. They do not guarantee future results or that you will pass a challenge.
10. Links
- Product page: Challenge Odds PRO
- Optional companion: Quantum Risk Manager PRO
Questions and feedback are welcome in the comments on the product page.




