

I get asked almost every day for an EA built specifically for gold. After years in this business, I wanted to build something with a clear trading idea, a stop loss attached to every entry, and AI with a useful, clearly defined job.
That became AiX Gold.
The starting point was a straightforward idea: identify established price levels, prepare for a breakout, and manage the trade according to rules decided before the entry. I wanted to study that idea across a much longer stretch of history.
The long-term reference tests use Dukascopy tick data from January 2008 through October 9, 2026. That gives us nearly 19 years of historical gold data to study, including strong periods, difficult periods and long stretches that required patience.
These are historical simulations. AiX has not been trading live since 2008, and a long backtest cannot guarantee that an edge will continue. What it can do is give us a much wider view of how the underlying rules behaved.
AiX uses up to seven breakout strategies built around confirmed daily and hourly price levels. It prepares buy-stop and sell-stop orders, with the stop loss and profit target included in the original request. Once a trade opens, strategy-specific break-even and trailing rules manage it.
No grid. No martingale. No recovery trading. Multiple qualifying setups can exist together, but an earlier loss does not trigger a sequence of larger recovery trades. Every new setup must satisfy its own entry rules. A stop loss defines the intended exit, although gaps and slippage can still affect the actual fill.
The two reference runs use different approaches to position sizing. One keeps the lot size at 0.01 lots. The other uses the 1% risk-per-strategy-setup setting. Both backtests used Dukascopy tick data, with the original MT5 reports showing 100% history quality (real ticks). Each test started with $10,000 and included commission and swap charges.
Historical results from the original MT5 reports. Dukascopy data coverage: January 2008 through October 9, 2026. The October figures cover only this partial month.
| Reported result | Fixed 0.01 lots | 1% per strategy setup |
|---|---|---|
| Starting balance | $10,000.00 | $10,000.00 |
| Net profit | $13,142.32 | $4,890,849.61 |
| Closing balance | $23,142.32 | $4,900,849.61 |
| Total trades | 14,746 | 9,588 |
| Profit factor | 1.41 | 1.65 |
| Relative equity drawdown | 3.36% | 34.84% |
The fixed-lot run is useful because the lot size does not grow with the account. It gives us a view of the trading results without progressively larger position sizes driving the dollar curve. Fixed lots still carry varying cash risk when the distance to the stop changes.
The annual breakdown is also revealing. In the supplied QuantAnalyzer fixed-lot analysis, 17 of the 19 displayed years have positive totals, including the partial 2026 year. The two negative years were 2017 and 2021. There are losing months throughout the record, even inside profitable years.

Fixed 0.01 lots: monthly and annual results from the supplied QuantAnalyzer analysis. Dukascopy data ends on October 9, 2026, so the October and 2026 totals are incomplete.
A separate check through the end of October.
The Dukascopy figures above stop on October 9. I also ran a separate MT5 backtest using my broker's real ticks for October 1–31, 2026, covering the final trading session on October 30. With fixed 0.01 lots and a $10,000 starting balance, that full-month test finished at $10,294.14: a net profit of $294.14, or 2.94%.
October therefore finished positive in this separate broker-data test. The negative October figure in the long-term screenshot covers only the earlier part of the month. These are separate backtests using different data feeds and date ranges; the broker result has not been added to the Dukascopy totals.
That is the part of longevity I care about: how the strategy behaves over many years, including the stretches when progress slows. QuantAnalyzer reports stagnation periods of 472 days for the fixed-lot run and 634 days for the risk-sized run. A profitable long-term result can still involve a considerable wait for a new high.
Why the way a strategy is tested matters.
The significance of these tests goes beyond the final profit figure. I did not keep rewriting AiX's core trading rules to make each difficult historical period look profitable. My aim was to evaluate a consistent breakout approach across changing market conditions. The weaker years and losing months remain part of the record.
Repeatedly adjusting rules to improve the same historical results can make a strategy fit the past more closely without making it more reliable on new data. That is the overfitting risk I want to avoid. Nearly 19 years of results gives us a broader examination than one favourable period.
That history supports my confidence in AiX's underlying approach. It is evidence of resilience across the conditions tested, although backtesting alone cannot rule out overfitting or guarantee future results. Forward performance remains the next test.
The larger run shows the scale that percentage-based sizing can reach in a historical simulation. It also shows a much larger drawdown. The $4.89 million simulated net profit belongs beside the 34.84% relative equity drawdown. Both are part of the result.
The 1% setting applies separately to each strategy setup. Several setups can be active together, so total account exposure can exceed 1%. The sizing reference can also retain a previous balance high; it is not necessarily 1% of current equity after a drawdown.
These are two reference configurations, rather than a controlled experiment where only one number changed. Their trade counts differ, and the reports contain other configuration differences. The comparison shows two historical outcomes; it does not establish that compounding alone explains every difference.
I also explored the results in QuantAnalyzer using Monte Carlo analysis. This kind of analysis creates alternative simulated paths under chosen assumptions, helping examine sensitivity to changes such as trade sequence or missed trades. Its conclusions depend on those assumptions. QuantAnalyzer explains the method here.
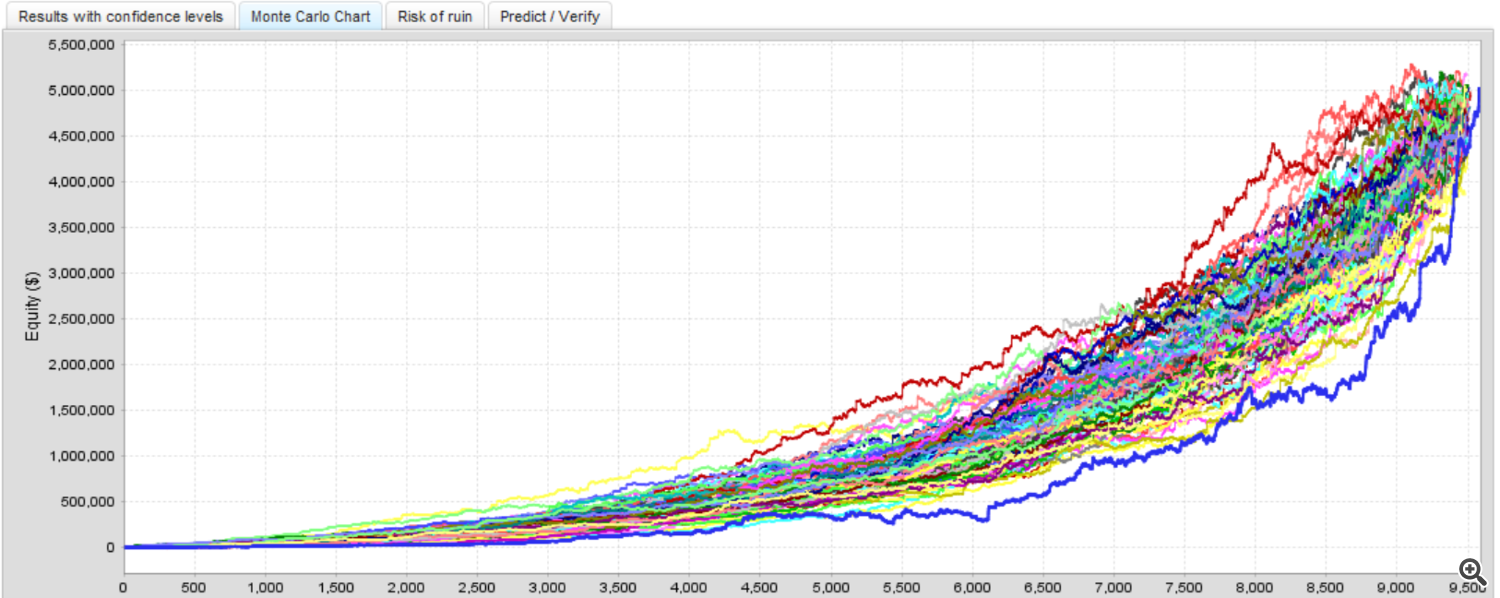
Exploratory Monte Carlo reference. Simulation settings are not shown, so no survival or future-profit probability is claimed.
Jev has a separate role: reviewing a setup as conditions change.
TypeSafe is the company behind Jev, its System One decision model. Jev is not a conversational, text-generating LLM. It evaluates supplied information and returns structured answers that software can use directly, with probability distributions and confidence information. TypeSafe describes this approach in its System One documentation.
That is a useful fit for a pending-order strategy. There can be a meaningful gap between identifying a level and price reaching the order. During that time, the approach may become choppy, the move may become extended, or the conditions around the setup may deteriorate.
AiX calculates the market measurements and supplies Jev with a focused snapshot. The review considers market conditions, the approach to the breakout level, signs of exhaustion and, for waiting setups, deterioration compared with an earlier assessment.
In Filter mode, a qualifying adverse review can prevent a new entry or cancel a waiting pending setup. AiX checks the assessment and order state before acting. Its own rules continue to control prices, position sizing, execution and exits.
The intended benefit is a second assessment while an opportunity develops. A level that qualified earlier may deserve another look before the pending order becomes a position. That benefit still needs to be measured in forward testing; the presence of an AI filter alone does not prove better returns.
Jev is optional and off by default. Observe mode records what it would do while the normal strategy continues. Filter mode allows intervention when the required checks pass. The dashboard shows its assessments, observed or actual actions, and estimated API costs for the day.
AI confidence describes certainty about a classification. It is not a trade’s probability of winning, and a structured answer can still be wrong. TypeSafe’s documentation distinguishes confidence from the underlying probabilities and explains how it is calculated. Read TypeSafe’s confidence explanation.
The backtests discussed here evaluate the core strategy, with Jev inactive. These results therefore evaluate the underlying strategy, not an AI performance improvement. Live and forward testing are where Jev’s effect needs to be assessed separately.
AiX is designed for a gold chart on H1, with broker prefixes and suffixes supported for XAUUSD and GOLD symbols. The wider operating features include price-scaled distances, NFP-only or high-impact USD news protection, broker-time and DST handling, rollover controls, and an on-chart view of realized performance.
I wanted a gold EA whose entries, risk and decisions I could explain. AiX combines those trading rules with a long historical reference and an optional, focused AI review. The work now is to keep measuring how that design behaves as new data arrives.
View my MQL5 signal and trading history. The signal is separate from the historical simulations discussed here.
Report note: The summary table uses original MT5 figures consistently. QuantAnalyzer’s imported percentages and some trade statistics differ. Its percentage calculations depend on the configured initial deposit, so the screenshots’ CAGR and drawdown percentages should not be treated as interchangeable with the $10,000 MT5 results. QuantAnalyzer documents this requirement. Historical simulations do not guarantee future results.