A calendar shows U.S. GDP growth of 2.0%, while another economy reports 0.5%. Is the U.S. growing four times faster? You cannot answer until you check how each number is expressed. One may describe a quarter at an annualized pace, while the other measures the change during that quarter.
For FX traders, this is more than a terminology problem. Comparing incompatible numbers can turn an ordinary release into an exaggerated growth story. Here is a repeatable way to read a GDP announcement before connecting it with a dollar view. All numerical examples below are hypothetical, not current economic data or trading signals.
Read the label before the headline
Gross domestic product, or GDP, measures domestic economic production. Real GDP adjusts for price changes; nominal GDP uses current prices. Start by writing the measure, period and adjustment beside the number you are reading. A real growth rate and a nominal growth rate answer different questions.
Then check the comparison. Quarter-on-quarter growth compares a quarter with the previous quarter. Year-on-year growth compares it with the same quarter a year earlier. An annualized quarterly rate takes one quarter's pace and compounds it over four quarters. It does not report what actually happened over the past year.
The Bureau of Economic Analysis explanation of annual rates gives the compounding method used for most quarterly percent changes it publishes. Read each release's notes rather than assuming every country, table or calendar provider follows that convention.
Convert one hypothetical quarter correctly
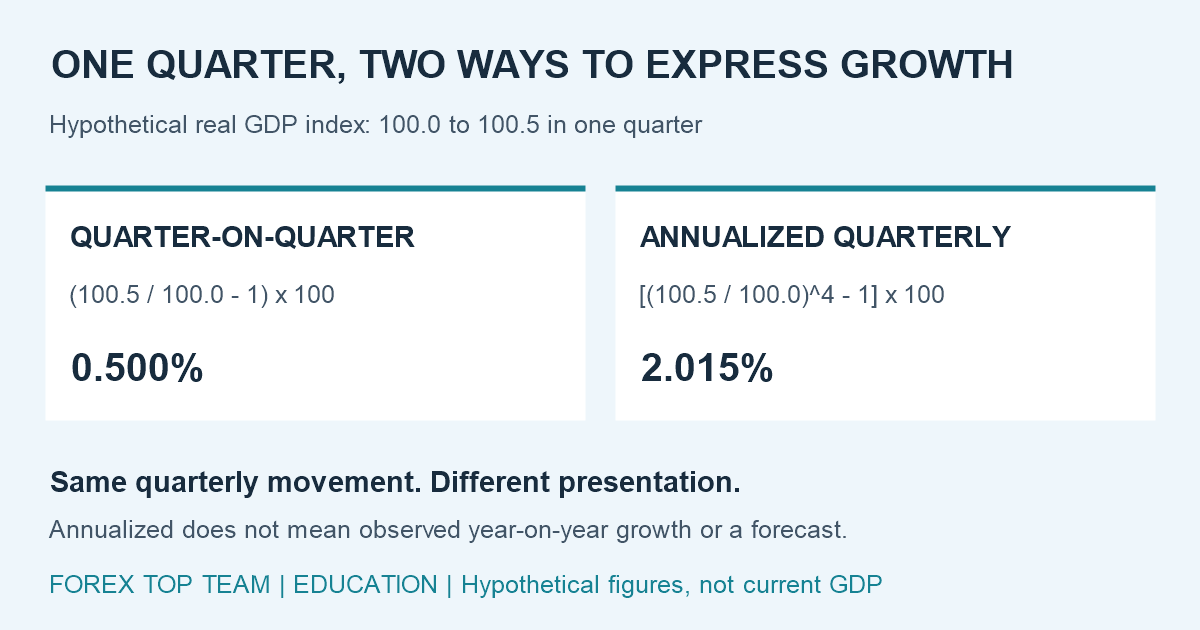 Hypothetical example only. These are not current GDP figures or an economic forecast.
Suppose a real GDP quantity index rises from 100.0 to 100.5 between consecutive quarters. Its ordinary quarter-on-quarter change is 0.5%:
Quarterly growth = (100.5 ÷ 100.0 − 1) × 100 = 0.5%.
Annualized growth = [(100.5 ÷ 100.0)4 − 1] × 100 ≈ 2.015%.
Those two figures describe the same hypothetical quarterly movement. They are different presentations, not conflicting observations. Multiplying 0.5% by four gives the rough shortcut of 2.0%, but the compounded result is slightly higher. Keep full precision in the calculation and round only the displayed answer.
To reverse the calculation, express an annualized rate A as a decimal and use [(1 + A)1/4 − 1] × 100. An annualized 2.0% implies about 0.496% quarter-on-quarter. Converting conventions does not create a forecast: the economy could grow faster, slow down or contract next quarter.
Separate a surprise from a large-looking number
Imagine a release reports 2.0% annualized growth against a hypothetical expectation of 2.4%, measured the same way. The surprise is −0.4 percentage points. It is not a 0.4% fall in the economy, and it is not a negative quarterly growth rate.
Now imagine another release prints the same 2.0%, but the expectation was 1.6%. The level of the reported growth rate is identical, while the surprise has the opposite sign. This is why a headline alone cannot establish what was new to market participants.
For a real event review, save the dated forecast source before the release, its survey time, the exact statistical definition and the official release time with timezone. If a reliable expectation is unavailable, describe the result without inventing a consensus. Keep revisions to earlier quarters separate from the latest-quarter surprise.
Ask what produced the growth
GDP's expenditure components include consumption, investment, government spending and net exports. Their growth rates are not interchangeable with their contributions to total GDP growth. A component can grow rapidly but contribute relatively little because its weight is small. Use the published percentage-point contribution table rather than adding component growth percentages yourself.
Imports need particular care. The BEA's explanation of the expenditure approach says imports are subtracted to exclude foreign production already included in spending categories. That accounting treatment is not evidence that every increase in imports damages domestic activity. Read imports alongside consumption, investment and inventories instead of isolating one signed contribution.
As a further lens, compare real final sales to private domestic purchasers. This combines consumer spending and private fixed investment, excluding inventory investment, net exports and government spending. The official GDP definitions and release notes explain this measure and why GDP estimates are updated as more information becomes available. It complements the headline; it does not replace it or predict the currency.
Build a conditional FX explanation
After checking the statistics, write a short chain of reasoning. For example: stronger private demand could affect expectations for future monetary policy, which could change relative yields and currency demand. Each link is a hypothesis to check against contemporaneous evidence. A GDP release alone does not prove why an exchange rate moved.
Consider competing explanations as well. Other data may arrive at the same time, traders may have anticipated the news, or an earlier estimate may be revised. A currency also compares two economies. An improved U.S. outlook does not automatically tell you whether USD/JPY or EUR/USD should rise.
Keep the measurement window explicit. A move in the first minute and a reversal over the next hour are different observations. If you cannot verify synchronized prices and timestamps, stop at the educational interpretation rather than supplying an invented reaction.
Your GDP-release checklist
- Label real or nominal, seasonal adjustment, reference quarter and growth convention.
- Convert annualized and ordinary quarterly rates before comparing them.
- Separate the latest surprise from revisions and use percentage points correctly.
- Read component contributions, private demand and the accompanying price measures.
- Describe a conditional policy interpretation, then check actual market evidence separately.
For your next practice session, translate one hypothetical headline into a quarterly rate and explain what it does and does not say. Then read why payroll revisions matter for FX to extend the same discipline to another data release. Better labels improve your analysis; they do not guarantee a profitable trade.