You win seven trades out of ten, yet your account goes backwards. How can that happen? The missing piece is the size of those wins and losses. A win rate tells you how often a trade made money. It says nothing, by itself, about how much money the strategy kept.
For an FX trader comparing an Expert Advisor, or EA, with a discretionary method, this distinction matters before increasing position size. Here is a practical way to connect win rate, average results and costs without treating a historical statistic as a promise.
Start with the money behind each outcome
Trading is not a test where every correct answer earns the same number of marks. A small profitable exit and a large stopped-out position both count as one trade, but their effect on your account is very different. CME Group's lesson on trading mathematics explains why the frequency and size of outcomes must be considered together. Its examples concern leveraged futures; the arithmetic also helps organize an FX trade log.
Use a consistent unit. For a fixed-size strategy, account-currency amounts are straightforward. If position sizes change, also examine returns in R, where 1R is the cash risk planned when a trade opens. Keep the original risk definition fixed: widening a stop later does not rewrite the initial 1R.
A hypothetical 70% winner that loses
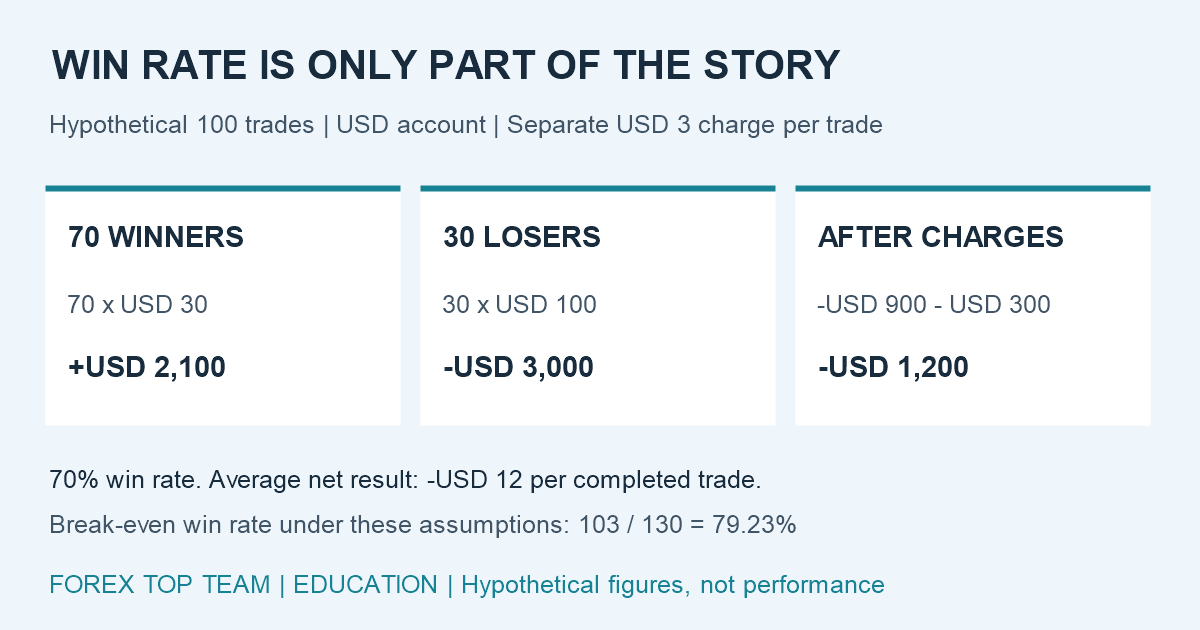 Hypothetical figures only. No live strategy or performance result is represented.
Imagine 100 completed trades in a USD account. Seventy win an average of USD 30; thirty lose an average of USD 100. These are hypothetical results before a separate USD 3 round-trip charge per trade. The figures are already translated into USD, so no exchange-rate conversion is needed.
Winning trades: 70 × USD 30 = USD 2,100.
Losing trades: 30 × USD 100 = USD 3,000.
Result before the separate charge: −USD 900.
Charges: 100 × USD 3 = USD 300.
Final result: −USD 1,200, or −USD 12 per trade.
The strategy was right more often than it was wrong. Nevertheless, each average loser erased more than three average winners. Another hypothetical strategy could win less often and still make money if its profitable outcomes were sufficiently larger. Neither pattern is automatically safer: the sequence, leverage and possible extreme losses still matter.
Calculate the average, then check the threshold
Expectancy means the average result associated with an outcome distribution. For the simplified two-outcome model used here, let p be the winning proportion, W the average win before the separate charge, L the positive magnitude of the average loss before that charge, and C the average separate charge per completed trade.
Average net result = p × W − (1 − p) × L − C.
Our example gives 0.70 × 30 − 0.30 × 100 − 3 = −12 USD. Setting that expression to zero produces the break-even winning proportion: (L + C) ÷ (W + L). Here, 103 ÷ 130 is about 79.23%. That threshold only applies while the assumed average win, average loss and charge stay unchanged.
Do not add costs twice. Executed entry and exit prices already reflect the spread paid through those fills. If your exported trade results also include commission and financing, average those net results directly. Alternatively, reconstruct a clearly defined result before those charges and subtract each missing item once. Reconcile the total with your statement before trusting the calculation.
Read the report without counting the wrong things
MetaQuotes' official testing-report reference defines profit factor using gross profit and gross loss, and describes expected payoff as an average deal return. These labels are useful starting points. Check how the particular report groups executions, completed trades and partial exits before comparing two systems.
For a strategy that scales out, several profitable closing executions can belong to one overall position. Counting each small exit as an independent success can flatter the headline win rate. Choose a consistent unit, such as a fully closed position or a complete strategy cycle, and document how you allocate costs. Keep any positions that are still open visible through account equity; a closed-trade win rate cannot describe their current risk.
Averages can hide the next difficult period
A positive historical average is evidence about the sample you measured. It is not a forecast of the next trade. A few unusually large wins might dominate the result, or a quiet market might make a strategy look dependable until volatility changes. Trades opened around the same event can also share risks, making a large trade count less informative than it first appears.
Compare separate time periods and market conditions. Inspect the largest losses, equity drawdowns and time spent recovering, alongside the averages. Test the effect of plausible execution deterioration using assumptions appropriate to your account. Avoid choosing a new target or stop simply because it improves the spreadsheet: changing exits can change both the winning proportion and the distribution of outcomes.
Your practical review checklist
- Define exactly what counts as one completed trade or strategy cycle.
- Calculate the winning proportion and average win and loss using consistent units.
- Reconcile commissions, spread effects and financing without double counting.
- Inspect open risk, extreme losses and equity drawdown separately.
- Repeat the review on a later period that was not used to select the rules.
The useful question is: does the whole distribution of results support the risk I am taking? A high win rate can be comfortable to watch, but comfort is not an edge. For the next step, read how to read an EA forward test and compare what happens after the rules have been fixed. This is an educational framework, not a claim about any live strategy or a guarantee of returns.