1,578 Strategy Variants on Synthetic Indices: Why Only One Survived (AureusAI Synthetic Drift Sentinel)

Synthetic indices trade 24/7, have no news and no gaps over the weekend, and offer dozens of symbols with very different personalities. That makes them an attractive target for an EA. It also makes them a trap. Most of these instruments are generated by a random-number process that the provider designs to be fair, and the spread is your only certain counterparty. A backtest that "works" on them is usually curve-fit noise.
This post documents how I built AureusAI Synthetic Drift Sentinel. Over four research rounds I tested 1,578 pre-registered strategy variants. Rounds 1–3 found nothing, and I'll show why. Round 4 found one mechanism that survived every test I could throw at it: a trend-follower on Deriv's Drift Switch indices. All numbers below come straight from my Python research output and the MT5 Strategy Tester. Nothing was rounded up, cherry-picked or estimated.
1. The anti-overfitting protocol
If you test enough ideas, some of them will look great by pure chance. With 1,578 variants, the "best" backtest of pure noise would show a t-statistic around 3. So every round followed the same rules, written down before any test was run:
- Pre-registration. Every hypothesis, parameter grid and variant count was written to a hypotheses.md file first. Any later change was logged as a time-stamped amendment, before the affected data was looked at.
- Walk-forward (WF) validation. For M1 data I used rolling 8-week train / 4-week test windows. In every fold, the variant that was best on the training window was applied to the next, unseen test window. Only the stitched out-of-sample (OOS) result counts.
- Locked holdout. The final ~3 weeks (13 Oct – 3 Nov 2026) were never used for design. Candidates were fixed in writing first, then evaluated on the holdout once.
- Holm multiple-testing correction across all rounds. The family-wise error is controlled over N = 1,578 variants (448 + 321 + 174 + 635). That requires a one-sided p < 3.2·10⁻⁵, i.e. t ≥ 4.0.
- Real costs, then +50% stress. Spreads and swaps come from published contract specifications. Every survivor must stay profitable with costs multiplied by 1.5.
- Execution delay and parameter perturbation. Entering 1–5 ticks late, or 1–2 bars late, must not kill the edge. Neighbouring parameter values must work too, so the result isn't a lucky peak.
- Minimum sample. At least 200 OOS trades.
2. Rounds 1–3: an honest "no edge" on IC Trading synthetics
The first three rounds used 12 synthetic symbols on an IC Trading MT5 demo (Crash/Boom 300/600/1000, Jump 50/75/100, Stochastic indices), with real tick data. 943 variants were tested: momentum, reversal, spike-catching, spike-dodging, drift harvesting, regime/spike-rate models, limit-order tricks and machine learning.
Result: 0 survivors out of 943. The key findings:
- Fair game minus spread. With the edge gate disabled, all 12 symbols lost money in the MT5 tester (PF 0.71–0.94). The best in-sample t across 448 Round-1 tests was 2.58, exactly what noise produces at that test count.
- Spike payoff cancels drift. On Crash/Boom, the slow drift between spikes and the spikes themselves cancel almost perfectly (chart below). Post-spike windows are indistinguishable from random windows. Spike rates do cluster on a few symbols, but no rate-regime strategy was tradable (best walk-forward t 1.49). The best Round-2 walk-forward result (Boom600, t 1.83) had a Holm p of 1.
- Hard SLs don't protect you from a spike gap. In a live demo fill probe, all 13 stop-losses hit by a spike filled at the post-spike quote, and 0 filled at the SL price. Mean overshoot was 5.0 bp. The MT5 tester applies the same rule, so the tester is honest here, but "tight SL plus spike" strategies are not viable.
- Machine learning: AUC 0.50. A gradient-boosting next-move classifier scored AUC 0.499–0.504 on 11 of 12 symbols. The one exception (AUC 0.75) was price-quantisation bounce that still lost about 1.9 bp per trade after spread.
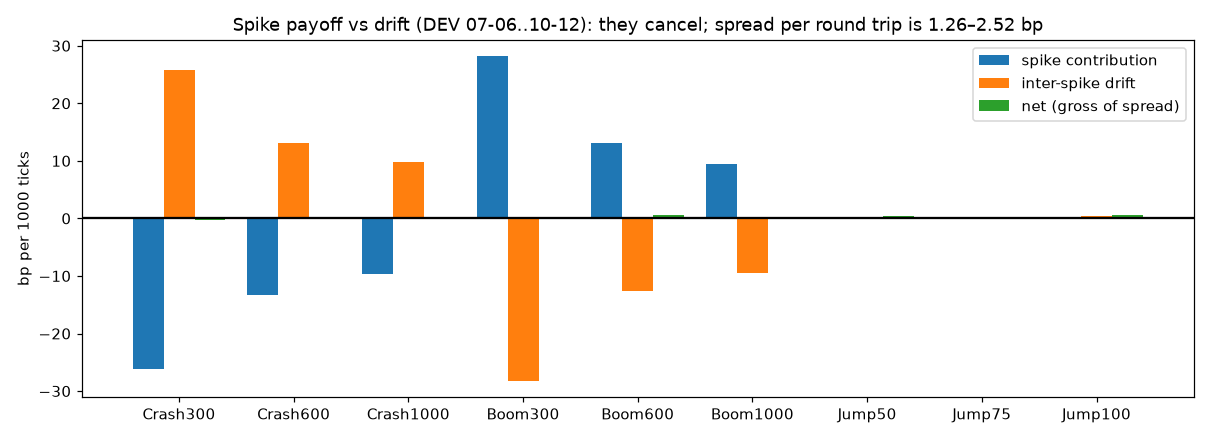
Round 2: spike contribution vs inter-spike drift on Crash/Boom: they cancel; net is ~0 before spread
I consider this negative result a feature, not a failure. If a protocol can say "no" 943 times in a row, you can trust it a bit more when it finally says "yes".
3. Round 4: Deriv synthetic indices
Round 4 moved to the Deriv synthetic universe with the same protocol, using 53 symbols:
- Volatility 10–100 and their 1s versions, plus 15/30/90/150/250;
- Crash/Boom 50–1000;
- Jump 10–100, Step 100–500, Range Break 100/200, DEX 600/900/1500 UP/DOWN;
- Drift Switch 10/20/30, Daily Reset Bull/Bear.
Data: 1-minute candles from Deriv's public API. Most symbols cover 240 days (from 8 March 2026); 14 of them cover 360 days. Tick data was also downloaded for a subset. API candles matched the ticks 99.998%.
Costs: taken from Deriv's published MT5 contract specifications: round-trip cost = max(minimum spread, target spread % × price). Swap was read conservatively as an annual percentage. For Drift Switch this means a round trip of roughly 8–9 bp.
635 new variants were pre-registered across nine families. The walk-forward results:

Walk-forward OOS t-statistic for every family/symbol; only Drift Switch 10/20/30 clear the Holm threshold t = 4.0
| Family | Walk-forward verdict |
|---|---|
| Volatility indices (18 symbols) | All negative. Realized vol equals nominal vol within 0.1%; variance ratio ≈ 1 |
| Step indices | Negative. Gross ≈ 0; the step size is exactly constant |
| Range Break, DEX, Jump | Negative (WF t −1.6 to −9) |
| Crash/Boom (12 symbols, M1 and ticks) | Not significant. Best WF t 1.08 on 106 trades |
| Tick-level product tests (digits, up/down) | Consistent with a fair generator (last-digit χ² not significant, P(up after up) ≈ 0.499) |
| Drift Switch 10/20/30 | WF t 12.4 / 15.5 / 14.6: passes Holm |
Why Drift Switch is different
Drift Switch indices are designed with hidden regimes: the price switches between an up-drift, a down-drift and a no-drift state, with average regime lengths that scale with the index number. A 3-state hidden Markov model fitted out of sample shows drift states of about ±1.9 bp per minute, lasting around 10 minutes on DS10. Unlike the other families, there is a structural reason for persistence. Inside a regime, the recent drift really does predict the near future, and that drift is large enough to pay the spread.
The mechanism (general)
- Signal: a volatility-normalised drift z-score of the recent price path, over a lookback of a few tens of minutes on M1 bars.
- Entry: when the drift is statistically strong in one direction, trade in that direction.
- Exit: when the measured drift flips sign, or at a time stop.
- Risk: every trade has a hard, volatility-scaled stop-loss and risks 0.25% of equity. No martingale, grid or hedging; at most one position per symbol.
- Edge gate: the EA keeps a "shadow" record of how the rule would have performed on the live feed, including the real spread. It only trades while the lower confidence bound of that shadow edge is above zero. If costs rise or the regime structure fades, it stops trading by itself.
I'm not publishing the exact lookback, threshold and stop multipliers: this is a commercial product. The perturbation test below shows the edge does not depend on hitting one magic value.
4. Results
Walk-forward out-of-sample (Python, Deriv spec costs)
| Symbol | OOS trades | Net per trade | t-stat | Profit factor | Win rate | t at +50% cost |
|---|---|---|---|---|---|---|
| Drift Switch 10 | 3,546 | 8.24 bp | 12.4 | 1.84 | 43.4% | 6.3 |
| Drift Switch 20 | 2,789 | 10.23 bp | 15.5 | 2.37 | 49.9% | 8.6 |
| Drift Switch 30 | 2,067 | 9.05 bp | 14.6 | 2.56 | 50.6% | 8.1 |
All three are far above the Holm bar of t ≥ 4.0, and well above it under +50% costs.
Locked holdout, single evaluation (Python, $10,000, 0.25% risk)
13 Oct – 3 Nov 2026. These are the data that were never used for design.
| Symbol | Trades | Net profit | Net per trade | PF | Max DD | Win rate |
|---|---|---|---|---|---|---|
| Drift Switch 10 | 360 | $820 | 9.49 bp | 1.91 | 0.77% | 42.8% |
| Drift Switch 20 | 330 | $1,141 | 11.58 bp | 2.36 | 0.72% | 50.9% |
| Drift Switch 30 | 289 | $514 | 5.73 bp | 1.93 | 0.52% | 43.3% |
Same holdout, +50% costs:
| Symbol | Net profit | Net per trade | PF | Max DD |
|---|---|---|---|---|
| Drift Switch 10 | $475 | 5.45 bp | 1.43 | 1.07% |
| Drift Switch 20 | $669 | 7.03 bp | 1.63 | 1.13% |
| Drift Switch 30 | $155 | 1.69 bp | 1.20 | 0.90% |
The hard stop-loss was never hit in development or holdout. Exits came from the drift flip or the time stop.
MT5 Strategy Tester (EA v3, holdout)
To check the EA code itself, not just the research script, I built custom symbols in MT5 from the Deriv M1 data with the Deriv-spec spreads and swap. I then ran AureusAI Synthetic Drift Sentinel v3.10 in the Strategy Tester on the holdout window (1-minute OHLC, $10,000 deposit).
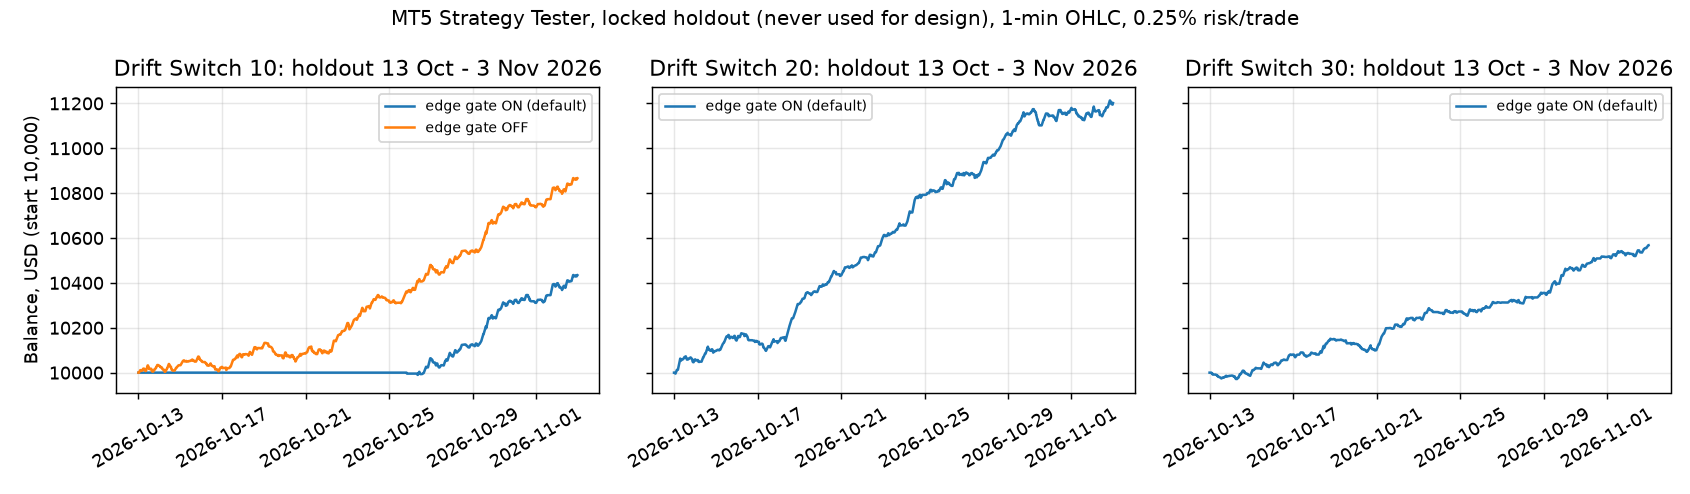
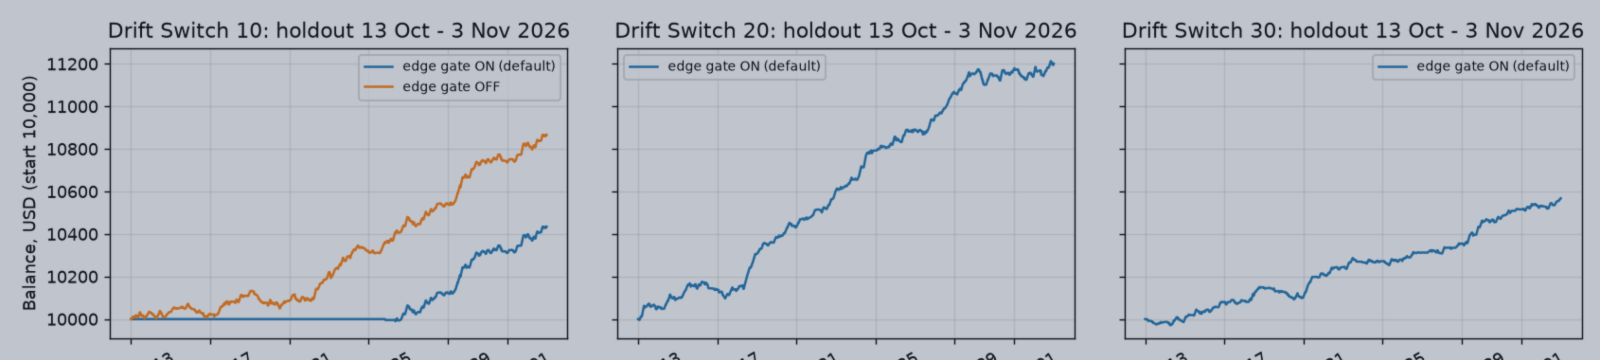
MT5 Strategy Tester balance curves on the locked holdout for Drift Switch 10/20/30
| Run (holdout 13 Oct – 3 Nov) | Net profit | PF | Max equity DD | Trades | Win rate |
|---|---|---|---|---|---|
| DS10, edge gate ON (default) | $434.27 | 2.30 | 0.50% | 130 | 43.9% |
| DS10, edge gate OFF | $866.29 | 1.90 | 0.88% | 358 | 42.7% |
| DS20, default | $1,201.71 | 2.36 | 0.86% | 330 | 50.9% |
| DS30, default | $567.98 | 1.92 | 0.63% | 289 | 43.9% |
The tester matches the Python research closely (DS20: 330 trades in both, PF 2.36 in both). On DS10 the edge gate opened later in the window, so it traded fewer times than the gate-off run.

Screenshot of the real MT5 Strategy Tester report (DS20 holdout, custom symbol built from Deriv M1 data). Inputs and the terminal's server and company lines were removed.
MT5 tester with +50% spread (default edge gate):
| Run | Net profit | PF | Max DD | Trades |
|---|---|---|---|---|
| DS10 development (16 Mar – 13 Oct) | $1,729.56 | 1.41 | 1.70% | 1,291 |
| DS20 development | $3,148.50 | 1.54 | 1.37% | 1,608 |
| DS30 development | $3,105.26 | 1.58 | 1.20% | 1,738 |
| DS10 holdout | $0 (gate stayed closed) | – | – | 0 |
| DS20 holdout | $433.55 | 1.62 | 1.22% | 208 |
| DS30 holdout | −$63.03 | 0.11 | 0.64% | 18 |
Stress, delay and perturbation
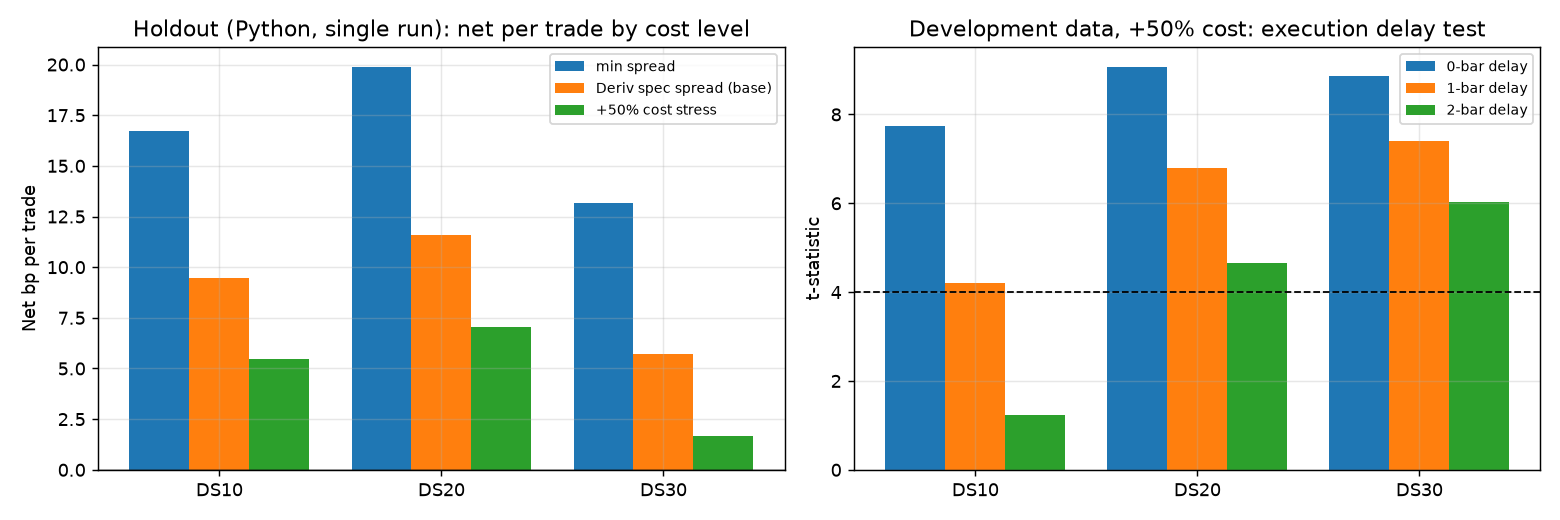
Holdout net per trade at min / base / +50% cost, and the execution-delay test
- Execution delay: on a DS10 tick-data sample (719 trades), entering 1, 2, 3 or 5 ticks after the signal bar moved net per trade from 7.60 bp to 7.55 / 7.53 / 7.49 / 7.40 bp, which is negligible. A full 1-bar (60-second) delay at +50% cost still gave t = 4.2 / 6.8 / 7.4. A 2-bar delay at +50% cost is where DS10 breaks down (t 1.2).
- Parameter perturbation: I tested 33 neighbouring settings per symbol, moving the lookback and threshold ±25% and changing the stop and time-stop multipliers. Every one was profitable, also under +50% costs (lowest t 5.7).
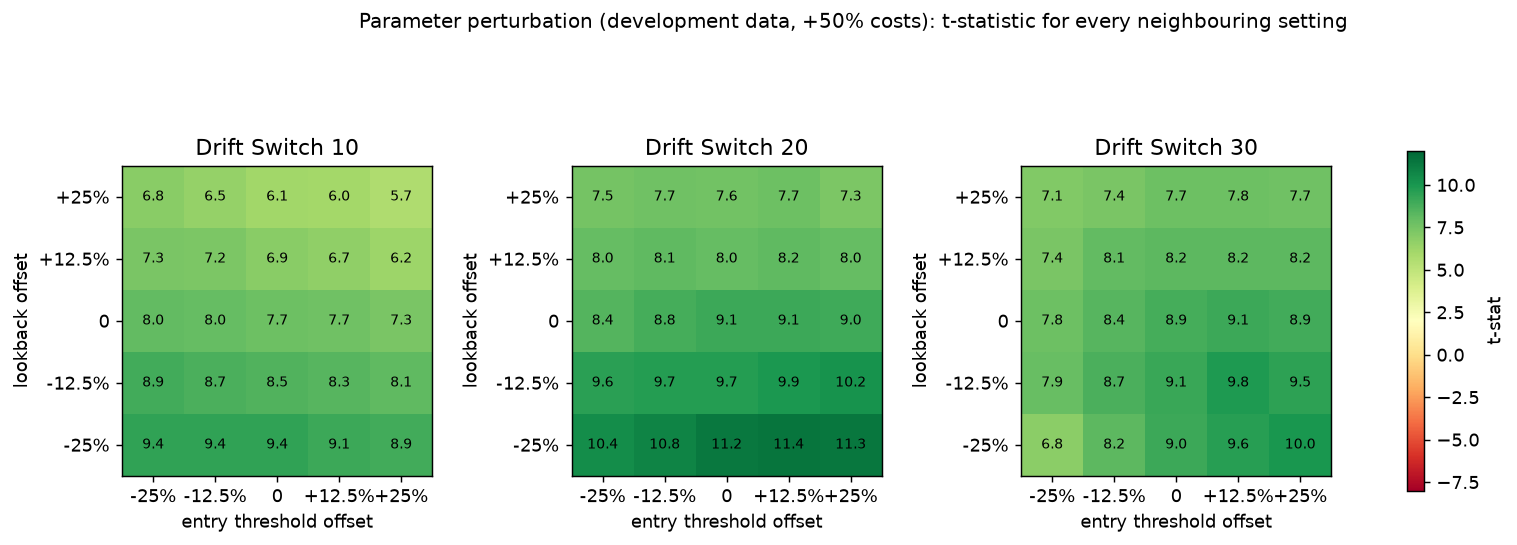
Parameter perturbation heatmaps: t-statistic under +50% costs for ±25% changes in lookback and threshold
5. Limitations: read these before you get excited
- No live forward test yet. Everything here is research data plus the MT5 Strategy Tester on custom symbols. It has not run on a live or demo Deriv account.
- Costs come from Deriv's published MT5 specs, not from measured live spreads, swaps or slippage. The gross edge is only about twice the round-trip cost, so real costs matter a lot.
- Under +50% spread the edge is thinner. In the MT5 tester, the edge gate kept DS10 closed for the whole holdout, and DS30 was slightly negative (−$63 on 18 trades). DS20 is the most robust of the three.
- Warm-up. The edge gate needs about one week of M1 history in its shadow record before it can open. Expect no trades at first, by design.
- Short holdout. About 3 weeks and 289–360 trades per symbol. That is statistically meaningful, but short in calendar time.
- Product risk. If the provider changes the index design, the regime structure the EA exploits may disappear. The edge gate is designed to stop trading in that case, but it reacts after the fact.
- Past results are not future results. Synthetic indices are leveraged CFDs; you can lose money.
6. What's next
AureusAI Synthetic Drift Sentinel v3.10 ships with:
- a Deriv symbol map (Drift Switch preset);
- the shadow edge gate;
- hard SL on every trade, fixed-fractional 0.25% risk;
- prop-firm daily-loss and max-drawdown guards;
- feed, spread and slippage pauses;
- an on-chart Edge Report panel showing the live shadow statistics.
Untested Deriv families are report-only and won't trade. On any non-synthetic chart, the default inputs run a generic trend module (EURUSD H1 trades normally in the tester).
Set files: the attached AureusAI_Synthetic_Drift_Sentinel_sets.zip contains ready presets for Drift Switch Index 10, 20, 30 (0.25% risk), a conservative 0.15% preset and a multi-symbol DSI10+20+30 preset. These are the exact research-protocol parameters, not further optimised. If your broker uses a symbol prefix/suffix, set InpSymbolPrefix / InpSymbolSuffix.
The EA is available on the MQL5 Market: AureusAI Synthetic Drift Sentinel
If you run it, please start on a demo account and compare the spreads you see with the ones in this post. Feedback and questions are welcome in the comments.
Mistermember, AureusAI Trading Suite