WallStreet Crypto Indicator MT4 product page: https://www.mql5.com/en/market/product/194173
WallStreet Crypto Indicator MT5 product page: https://www.mql5.com/en/market/product/194174
How the Indicator Works & How to Use It
The indicator acts as an all-in-one execution station directly on your chart, designed for manual traders who need clear setups without guessing stop-loss or take-profit placement.
Top Features
- Complete Execution Station: Combines entry signals, dynamic stop-loss levels, and dual take-profit targets on a single screen.
- On-Chart Interactive Dashboard: Drag-and-drop info panel displaying real-time Spread, ATR, R:R calculation, and Bar Close Timer.
- Visual Trend Shading: Customizable background shading between price and trend levels gives immediate visual context to market bias.
- Confirmed Bar Alerts: Configurable pop-up and mobile push notifications that only fire after a candle closes, eliminating signal repainting.
- Multi-Asset & Multi-Timeframe: Built to handle the heavy market noise of BTC, ETH, and volatile Forex/Gold pairs across M1 up to Daily timeframes.
Recommendations
Recommended time frames: from M15 till H4. On M15 most of the signals will be scalping signals. On H1 and H4 trending signals!
Avoid choppy markets! You need to be able to recognize a choppy market and try to ignore it. A choppy market is a market that is highly volatile, but results in no overall price movement, in either direction. These price spikes and sharp rebounds from the range borders can generate a series of poor signals.
WallStreet CRYPTO Indicator signals are at their most reliable, when following the market in trend, or a wide swing mode. Avoid trading in periods of low liquidity. In these periods, the market is generally in a narrow choppy range.
Chart Elements
Below you can find all the elements the WallStreet Crypto Indicator shows on the chart:
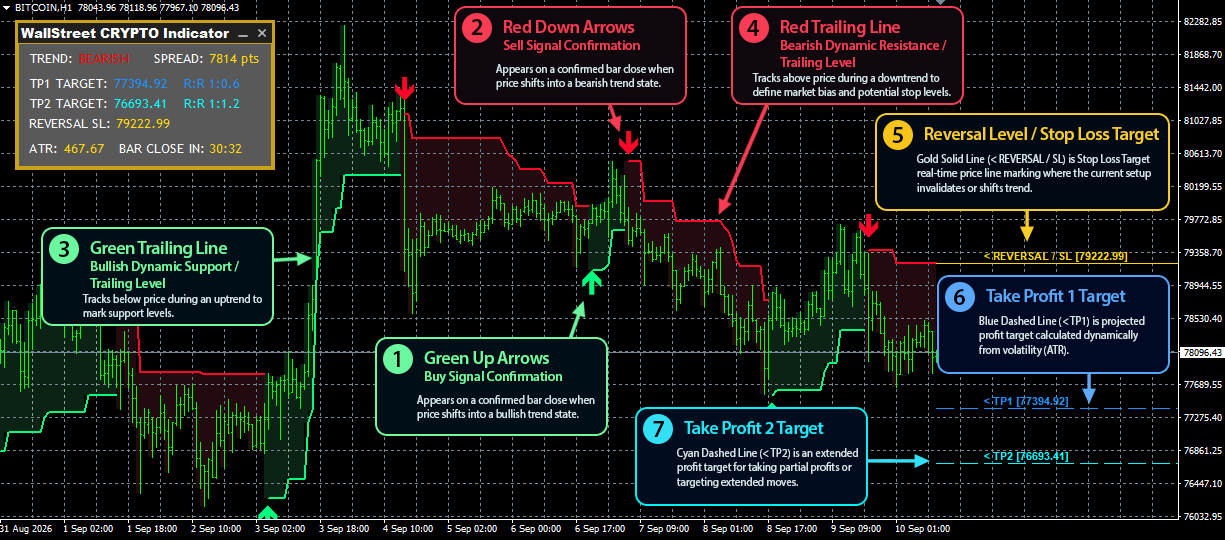
- Red Down Arrows: Sell Signal Confirmation — Appears on a confirmed bar close when price shifts into a bearish trend state.
- Green Up Arrows: Buy Signal Confirmation — Appears on a confirmed bar close when price shifts into a bullish trend state.
- Red Trailing Line: Bearish Dynamic Resistance / Trailing Level — Tracks above price during a downtrend to define market bias and potential stop levels.
- Green Trailing Line: Bullish Dynamic Support / Trailing Level — Tracks below price during an uptrend to mark support levels.
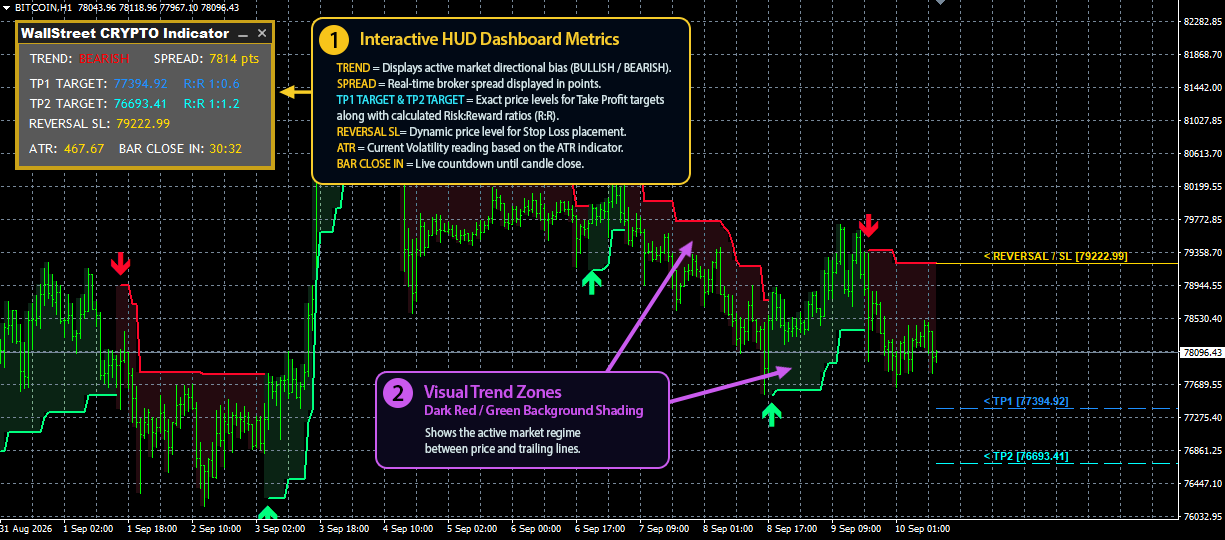
- Dark Red / Green Background Shading: Visual Trend Zones — Gives immediate visual context of the active market regime between price and trailing lines.
- Gold Solid Line (< REVERSAL / SL): Reversal Level / Stop Loss Target — Real-time price line marking where the current setup invalidates or shifts trend.
- Blue Dashed Line (< TP1): Take Profit 1 Target — Projected profit target calculated dynamically from volatility (ATR).
- Cyan Dashed Line (< TP2): Take Profit 2 Target — Extended profit target for taking partial profits or targeting extended moves.
Below, among the images, you will find a photo with a detailed description of all the elements the indicator displays on the chart. Be sure to look at this image to get a clear idea of exactly what is shown and what it looks like. All the elements are easy to recognize and understand. We are confident that you will grasp everything at a glance.
Interactive HUD Dashboard Metrics
- TREND: Displays active market directional bias (BULLISH / BEARISH).
- SPREAD: Real-time broker spread displayed in points.
- TP1 TARGET & TP2 TARGET: Exact price levels for Take Profit targets along with calculated Risk:Reward ratios (R:R).
- REVERSAL SL: Dynamic price level for Stop Loss placement.
- ATR: Current Volatility reading based on the indicator's ATR calculation period.
- BAR CLOSE IN: Live countdown timer showing remaining time before the current candle closes.
WallStreet Crypto Indicator in action
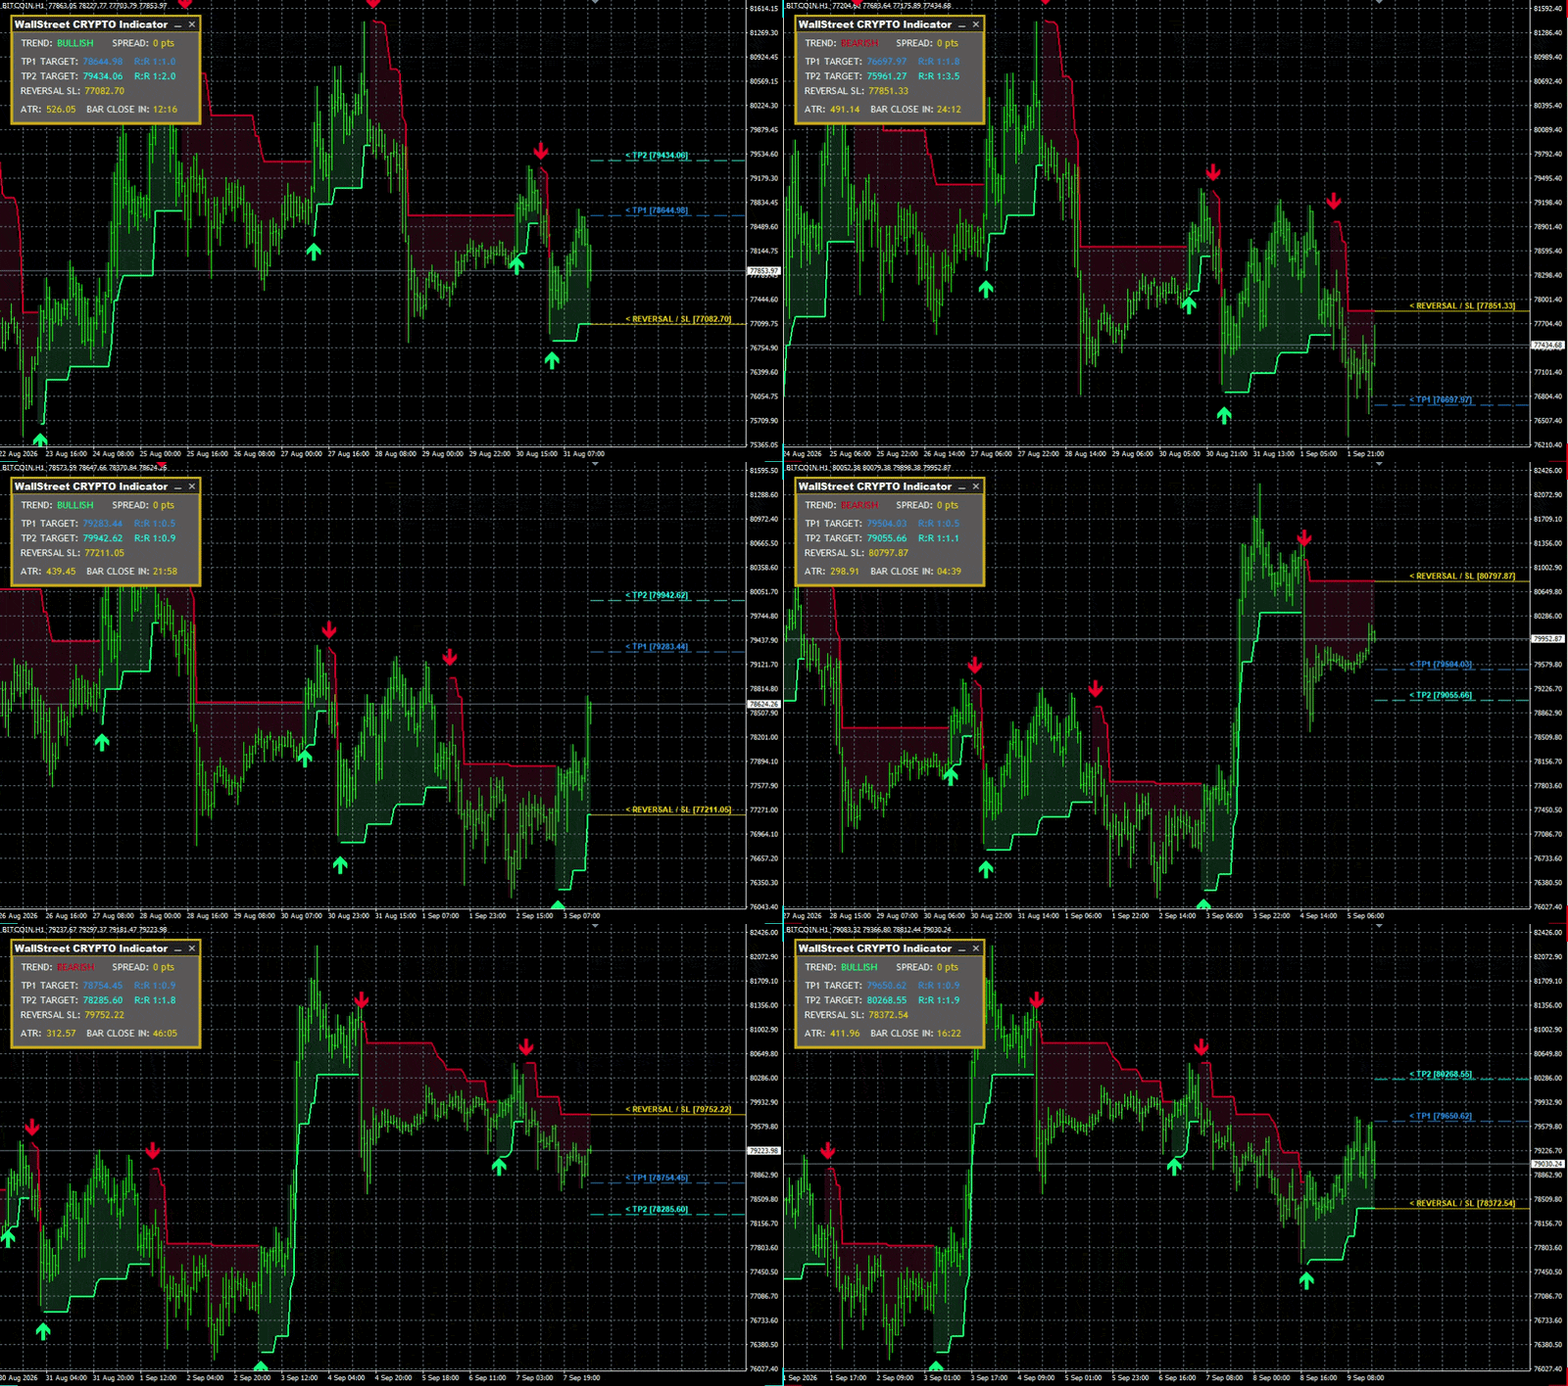
Check below to see how WallStreet Crypto Indicator works when attached on the BITCOIN chart.
Input Parameters Guide
- Show_TargetLevels: Toggles the display of live TP1, TP2, and Reversal/SL target lines on the chart.
- TP1_ATR_Multiplier: Sets Take Profit 1 distance relative to current market volatility (ATR).
- TP2_ATR_Multiplier: Sets Take Profit 2 distance relative to current market volatility (ATR).
- Show_BackgroundShading: Enables colored background fill between price and the dynamic trend line.
- Bullish_ShadingColor: Custom background shade color during active bullish trends.
- Bearish_ShadingColor: Custom background shade color during active bearish trends.
- Show_Dashboard: Shows or hides the interactive on-chart info panel.
- Dashboard_X_Initial: Sets the initial horizontal (X) pixel coordinate of the dashboard.
- Dashboard_Y_Initial: Sets the initial vertical (Y) pixel coordinate of the dashboard.
- Show_Arrows: Displays Buy/Sell signal arrows on confirmed trend flips.
- Alerts: Enables native terminal pop-up alerts on bar completion.
- Send_Push_Notifications: Sends instant mobile push notifications to your MetaTrader phone app.
- Prefix: Text prefix used for naming chart objects to prevent conflicts with other tools.
- Volatility_Period: Calculation period for volatility measurements used by target projections.
- Smooth_Factor: Applies moving average smoothing to entry filters (`0` = deactivated/raw price).
- Max_Width_Pips: Limits the maximum allowable distance for the dynamic trend line.
- Min_Follow_Pips: Minimum pip distance the trend line must maintain relative to price action.
- TrendLine_Level: Controls overall sensitivity of the trend detection.
- Max_Bars: Limits historical calculation depth to optimize terminal execution speed.