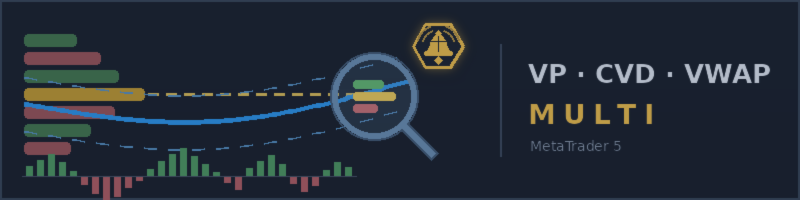
Volume Profile, CVD and VWAP: Three Questions on Every Chart - and How to Watch Your Whole Watchlist at Once

When I look at a chart, I am asking three questions.
WHERE is price accepted? Volume Profile answers this. The POC is the price with the most activity in the session. The Value Area (VAH and VAL) is the zone where most of the session traded. These are the levels the market has agreed on. Price comes back to them.
WHEN does pressure stop agreeing with price? CVD answers this. It is a volume-pressure histogram. When price makes a lower low but pressure makes a higher low, that is a divergence. The move is still going down, but the force behind it is getting weaker.
HOW FAR is price stretched? VWAP answers this. It is the volume-weighted average price of the session. The sigma bands show how far price has moved away from it. A tag of the 2-sigma band means price is far from its fair value.
One question alone is not much. A divergence in an empty area is just a statistic. A 2-sigma tag with no context is just distance. But a divergence that prints at the POC, while price is tagging the 2-sigma band, is three different tools agreeing at the same moment. That is worth a look.
I put all three on one chart in a free indicator called Volume Trio.
The problem: this only works on one chart
I built it for myself, and then I hit the obvious wall.
The setup happens when it happens. It does not wait for you to open that chart. So I was clicking through symbols one by one - EURUSD, GBPUSD, gold, back to EURUSD - checking if anything had lined up. By the time I got to the tenth chart, the first one had already moved.
You cannot watch thirty charts at the same time. Nobody can.
The answer: let the terminal watch them for you
So I built Volume Trio Multi. It runs the same three layers across every symbol in your Market Watch, on a timeframe you choose, and tells you when something lines up.
You do not type a symbol list. It reads the symbols you already have in Market Watch, exactly as your broker spells them. You choose the timeframe (M5 by default) and how many symbols to cover. That is the whole setup.
It alerts you on two conditions:
- A CVD divergence together with a VWAP sigma-band tag
- A CVD divergence together with a key zone: a POC, VAH, VAL, or an untouched previous POC
The alert tells you what happened before you open anything:
Scanner Confluence | BULL | EURUSD | M5 | -2.0s tag + RD | close=1.13842
There is also a dashboard on your chart. It shows every symbol you are scanning, with its band state, divergence state and zone state in one table. Click a row and that chart opens.
Multi also adds composite profiles (merge the last N sessions into one profile), developing POC and Value Area (watch value form during the session), naked POC tracking (old POCs that price has not returned to yet), and a hover tooltip on every line, so nothing on the chart is unexplained.
One honest note
All of this comes from your broker's volume and price data. It is a pressure proxy, not real order flow. It gives you context: where value is, where pressure disagrees with price, how far price has stretched. It does not tell you to buy or sell, and it makes no promise about results.
What it does promise is time. It watches the charts so that you only look at the ones that deserve it.
Try it
Volume Trio Multi - the watchlist scanner, the confluence alerts, the dashboard, and everything described above: https://www.mql5.com/en/market/product/188176
If one chart at a time is enough for the way you trade and you do not need confluence alerts - the free version gives you the same three layers with nothing removed. https://www.mql5.com/en/market/product/187983
If you try either one, tell me what does not work. That feedback is what changes the next build.