Five ways a backtest flatters an Expert Advisor, and how to test around them

Five ways a backtest flatters an Expert Advisor
Over the last few weeks I have been testing a gold breakout Expert Advisor. During the optimisation I found a set of parameters that turned 10,000 USD into more than 108,000 USD in the strategy tester.
I did not ship it. This article explains why, and gives you the five checks I now run before trusting any backtest, including my own.
1. The modeling mode
Open any tester report and find the modeling line. If it reads 1 minute OHLC, the test did not simulate price movement inside each bar. It used four points per minute: open, high, low and close.
For a system with wide stops this hardly matters. For one with tight stops it matters a great deal. A stop sitting close to entry can be clipped by a wick lasting nine seconds, and the faster model often steps straight over that wick. The trade that would have been stopped out in reality is recorded as a winner. The same applies to pending orders: a breakout entry just beyond a level can trigger and reverse inside a single minute, and the model may never see it.
The check: run the same test in Every tick mode, or Every tick based on real ticks if your broker supplies tick history. A robust result shifts a little. A fragile one falls apart.
2. The test period
Every strategy has a market regime it was built for. Trend systems look excellent during trends; mean reversion systems look excellent in ranges. Test either inside its favourite regime and the curve will be beautiful.
Gold from 2024 into 2026 is the clearest recent example, moving from roughly 2,000 up through 3,000. Any breakout system measured only across that stretch is sitting the easiest exam of the decade.
The check: read the equity curve, not the final figure. Flat for the first half and steep in the second means the system waits for a trend and then harvests it. That is a legitimate way to trade, but flat months are part of the design. Test 2021 to 2023 as well, and ask sellers for a ranging period. Their willingness to provide one is informative.
3. The spread
The tester uses your broker's current spread, or a fixed value you choose. Live trading uses whatever the spread happens to be at the moment of execution.
On gold that gap is wide. A quiet session might show 20 to 30 points; around a rate decision the same symbol can print several hundred for a few seconds. Systems that trade level breaks tend to trade precisely when volatility spikes, which is precisely when spreads widen.
The check: re-run with a deliberately pessimistic fixed spread, well above your broker's average. If a strategy only works at the tightest spread you have ever seen, it does not work.
4. The sample size
A report showing 40 trades tells you almost nothing, and neither does 200. Randomness at that scale produces attractive curves regularly, and a seller only has to publish the attractive ones.
There is no magic threshold, but the direction is clear. Read profit factor together with trade count: 1.5 across 60 trades is far weaker evidence than 1.15 across 5,000.
The check: look at total deals before anything else. If it is small, treat every other number as provisional.
5. The parameter cliff
This is the check almost nobody runs, and it is what made me discard the 108,000 USD result.
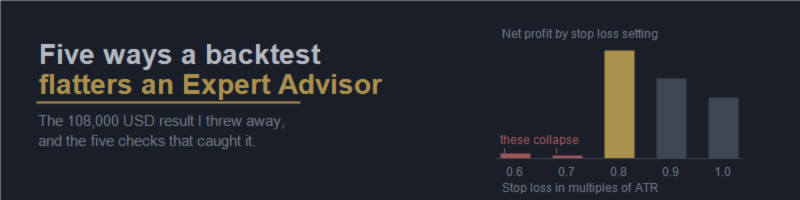
Optimisation gives you a grid. The temptation is to take the best cell and ship it. The right move is to examine the cells beside it. Here is the actual stop loss grid from my test, in multiples of ATR, showing net profit from a 10,000 USD deposit under identical conditions:
| Stop loss | Net profit | Outcome |
|---|---|---|
| 0.6 ATR | 4,848 | drawdown limit reached |
| 0.7 ATR | 2,822 | drawdown limit reached |
| 0.8 ATR | 108,488 | the tempting result |
| 0.9 ATR | 80,842 | stable |
| 1.0 ATR | 60,847 | stable |
Look at 0.7. One tenth of an ATR to the left of the best result, the strategy does not simply earn less. It collapses, trips the drawdown limit and stops trading.
That is not a plateau, it is a ledge with a cliff beside it. In live trading, spread and slippage effectively widen the stop distance you actually receive, which pushes you toward that cliff rather than away from it. A parameter is only trustworthy when its neighbours are profitable too. If moving a setting one step destroys the result, you have not found an edge. You have found a coincidence that fits one particular price history.
The check: ask what happens either side of the defaults, or load the set file and optimise a narrow range around each one yourself. Smooth surface, proceed. Sharp spike, be careful.
The checklist
- Modeling mode is Every tick, not 1 minute OHLC
- The test spans more than one market regime
- Spread is realistic or deliberately pessimistic
- Total trades run into the hundreds at minimum
- Results survive a small change to the defaults
- Every position in the trade list has its stop loss column filled
- The seller hands over the set file so you can repeat the test
That last point outweighs any screenshot. A backtest you cannot reproduce is a picture, not evidence.
The Expert Advisor these checks were built on
The robot in question is Gold Maximizer, and everything above came out of building it.
It runs nine independent support and resistance breakout strategies on a single XAUUSD chart: three on the daily timeframe, one on H4 and five on H1. Each reads levels of a different age, from six hours to several months, so entries spread out across time instead of arriving together. Each strategy holds one position at most.
- A stop loss and take profit attached from the moment a position opens
- An ATR trailing stop that follows the trade as it develops
- Position size from a fixed percentage of balance, so risk scales with the account
- An equity drawdown circuit breaker that halts trading automatically
- Every distance derived from ATR, so the logic adapts as volatility changes
- No grid, no martingale, no averaging down, and no virtual stops held inside the EA
Tested on XAUUSD H1 from 2024.01.02 to 2026.07.22, with a 10,000 USD deposit, leverage 1:500, 1 minute OHLC modeling and risk of 0.5 percent per trade:
| Net profit | 37,198 USD |
| Total trades | 6,689 |
| Winning trades | 62 percent |
| Profit factor | 1.19 |
| Maximum equity drawdown | 15.78 percent |
| Sharpe ratio | 1.95 |
These are strategy tester results, not real trading results.
Now hold them against my own checklist. The sample is genuine at 6,689 trades and the drawdown stayed inside 16 percent. The profit factor of 1.19 is honest rather than spectacular: this system earns because it wins more often than it loses, not because individual winners are large. The period favours breakout logic, and the curve shows it. And the defaults sit in the middle of a smooth region rather than on that ledge, which is exactly the decision that cost the difference between 37,000 and 108,000 in the tester.
I would rather sell the number I believe than the number that photographs well.
If you want to test any of this for yourself, ask for the set file in the comments or by private message and I will send it whether or not you have bought anything. Load it, run both modeling modes, change the period, and see what you get.
View Gold Maximizer on the MQL5 Market →
Trading leveraged instruments involves substantial risk of loss and is not suitable for every investor. Past testing performance does not guarantee future results.