
Equivalent MA User Manual
Standard Edition | Version 1.08
THE NUMBER CHANGES.
THE MEANING DOESN’T.
Change timeframes. Keep your reference.
Equivalent MA helps you maintain the same moving-average reference across different MetaTrader 5 timeframes.
Instead of using the same MA period on every chart, Equivalent MA automatically calculates the matching period for the current timeframe.
PDF Manual
The complete English user manual is also available as an attachment at the end of this post.
Before You Start
Before using Equivalent MA, install the indicator in MetaTrader 5.
Basic Steps
- Open MetaTrader 5.
- Install Equivalent MA in the Indicators folder.
- Attach the indicator to the chart you want to analyze.
- Review the settings and click OK.
Quick Tip
You can also attach Equivalent MA by dragging it from the Navigator window directly onto your chart.
Can’t Find the Indicator?
Check whether the file was installed in the MetaTrader 5 Indicators folder.
Quick Start
Start using Equivalent MA in four simple steps.
Step 1 — Choose Your Base Timeframe
Select the timeframe that contains the moving averages you normally use as your main market reference.
H4 is the default, but another supported timeframe can also be selected.
Step 2 — Choose EMA or SMA
Select the moving-average method you normally trust.
Equivalent MA supports both EMA and SMA.
Step 3 — Set Your MA Periods
Enter the three moving-average periods you want to use.
The default settings are:
- MA1: 20
- MA2: 50
- MA3: 100
Each moving average can also be shown or hidden separately.
Step 4 — Change Timeframes
Move to another chart timeframe.
Equivalent MA automatically recalculates and displays the matching periods while preserving the same market-time reference.
Why Equivalent MA?
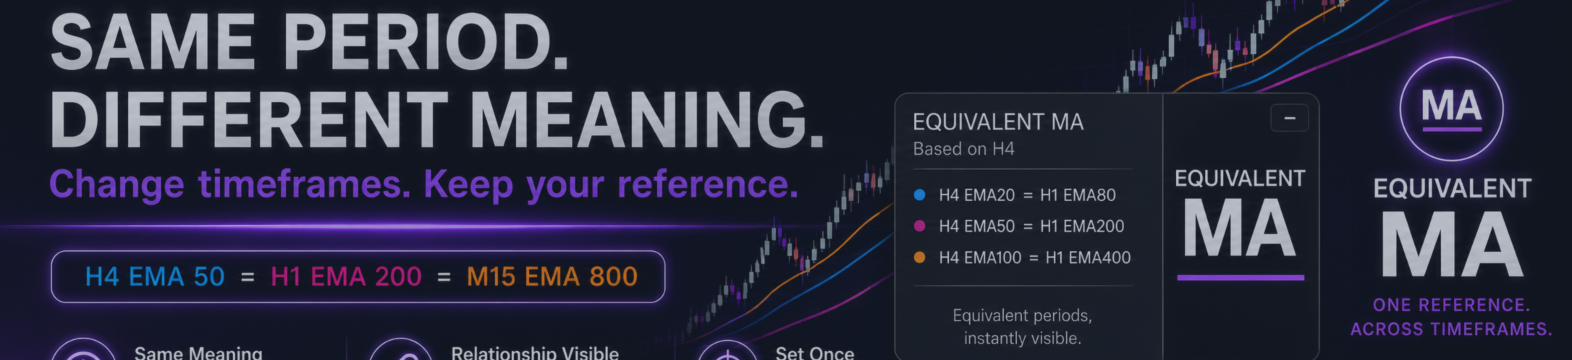
SAME PERIOD. DIFFERENT MEANING.
Change the timeframe, and the MA you trusted is no longer measuring the same market horizon.
The Problem
The same MA period measures a different amount of market time when the chart timeframe changes.
For example, EMA 50 on H4 does not represent the same amount of market time as EMA 50 on H1.
The Solution
Equivalent MA changes the number so your reference keeps the same meaning.
H4 EMA 50
=
H1 EMA 200
=
M15 EMA 800
The period changes.
The market-time reference remains consistent.
Feature 1 — Same Meaning
SAME MEANING. DIFFERENT TIMEFRAMES.
Change timeframes. Keep your reference.
One Reference
H4 EMA 50 = H1 EMA 200 = M15 EMA 800
What Changes
The displayed MA period changes automatically as you move across timeframes.
Your reference stays consistent.
No Manual Recalculation
You do not need to calculate a new MA period every time you change the chart timeframe.
Feature 2 — Relationship Visible
THE RELATIONSHIP. MADE VISIBLE.
See each MA’s matching period across timeframes.
What You See
Each Base Timeframe MA is paired with its matching period on the current chart timeframe.
For example:
- H4 EMA 20 = H1 EMA 80
- H4 EMA 50 = H1 EMA 200
- H4 EMA 100 = H1 EMA 400
No Extra Action
The relationship shown in the panel updates automatically when the chart timeframe changes.
The colors in the panel correspond to the moving-average lines on the chart, making each relationship easier to identify.
Feature 3 — Your MA, Your Way
YOUR MA. YOUR WAY.
Equivalent MA does not ask you to change your method.
It works with the moving averages you already use.
Choose the Method
Use EMA or SMA — whichever method you normally trust.
Choose the Reference
Set the Base Timeframe and the three MA periods you already use.
The default values are only a starting point. You can change them to match your own trading method.
Clear settings. No guesswork.
Feature 4 — Set It Once
SET IT ONCE. KEEP YOUR REFERENCE.
Set your moving averages once.
No repeated calculations. No repeated setup.
Set It Once
Choose 20 / 50 / 100 — or your own MA set — on the Base Timeframe.
Keep the Reference
Equivalent MA recalculates all three matching periods when you change timeframes.
For example, when the Base Timeframe is H4:
- H4: 20 / 50 / 100
- H1: 80 / 200 / 400
- M15: 320 / 800 / 1600
The numbers change automatically while the intended market-time reference remains the same.
Feature 5 — Minimize the Panel
THERE WHEN YOU NEED IT.
GONE WHEN YOU DON’T.
Keep the relationship visible when it helps.
Minimize the panel when you want more chart space.
Minimize
Click the – button to move the panel out of the main chart area.
The minimized panel appears in the MinBar area at the lower-left side of the chart.
Restore
Click the + button or double-click the MinBar to restore the panel.
The panel returns to its previous chart position.
Move the Panel
Drag the panel to place it wherever it is most useful on your chart.
Settings & Important Notes
Standard Edition Specifications
Equivalent MA Standard displays up to three equivalent moving averages.
Supported Timeframes
Equivalent MA supports the following standard MetaTrader 5 timeframes:
M1 / M5 / M15 / M30 / H1 / H4 / D1 / W1 / MN1
Non-standard MetaTrader 5 timeframes are not supported in the Standard Edition.
Same Market Time
Equivalent periods represent the same amount of market time.
However, MA values may not match exactly across timeframes because each timeframe uses different candle data.
This is normal.
Overlapping Lines on W1 or MN1
When the current chart timeframe is much higher than the Base Timeframe, multiple calculated periods may round to the same value or to the minimum value of 1.
When this happens, two or more MA lines may overlap.
This is normal and does not indicate a calculation error.
Choose Your Base Timeframe
H4 is the default Base Timeframe.
It is not fixed.
Select the Base Timeframe that best matches your own trading horizon and analysis structure.
Use It on Multiple Charts
Equivalent MA can be attached manually to multiple charts.
Each indicator instance is configured separately.
Changing the settings on one chart does not automatically change the settings on another chart.
How the Equivalent Period Is Calculated
The equivalent period is calculated using the duration of the Base Timeframe and the current chart timeframe.
Equivalent Period
= Base MA Period × PeriodSeconds(Base TF) ÷ PeriodSeconds(Current TF)
The result is rounded to the nearest whole number.
The minimum period is 1.
Example
Base Timeframe: H4
Base MA Period: 50
- H1: 50 × 240 ÷ 60 = 200
- M15: 50 × 240 ÷ 15 = 800
- M5: 50 × 240 ÷ 5 = 2400
Large periods on lower timeframes are expected.
They are not an error.
Lower timeframes require more candles to represent the same amount of market time.
Frequently Asked Questions
Q1. Why Don’t the MA Values Match Exactly?
Equivalent periods represent the same amount of market time.
Because each timeframe uses different candle data, the calculated MA values may not match exactly.
This is normal.
Q2. Why Do MA Lines Overlap on W1 or MN1?
Some equivalent periods may round to the same number or to the minimum value of 1.
When two periods become identical, their lines are drawn in the same position.
A higher Base Timeframe, such as D1 or W1, may separate the lines more clearly when analyzing higher chart timeframes.
Q3. Is H4 Fixed as the Base Timeframe?
No.
H4 is the default, but another supported timeframe can be selected.
Q4. Can I Use SMA?
Yes.
Equivalent MA supports both EMA and SMA.
Q5. Why Do the Periods Get So Large?
Lower timeframes need more candles to represent the same amount of market time.
For example, H4 EMA 50 becomes M5 EMA 2400.
The larger number is the correct equivalent period.
Q6. Do I Have to Display All Three Moving Averages?
No.
Each moving average can be shown or hidden separately in the indicator settings.
Support
Product
Product: Equivalent MA
Platform: MetaTrader 5
Edition: Standard Edition
Version: 1.08
Contact
If you have any questions or need assistance, please contact us through the MQL5 product page.
Updates
Future updates may include improvements based on user feedback and product development.
Thank You
Thank you for choosing Equivalent MA.
We hope it helps you maintain a clearer and more consistent market reference across timeframes.
Built by a trader, for traders.
Disclaimer
Please read before use.
Trading Risk
Equivalent MA is a technical analysis tool for MetaTrader 5.
It does not provide trading signals, investment advice, or guarantees of profit.
User Responsibility
All trading decisions, risk management, and trading results remain the responsibility of the user.
Data and Platform
Moving-average values, candle data, and chart behavior may vary depending on MetaTrader 5, your broker, the selected symbol, and your account environment.
Thank you for reading the Equivalent MA User Manual.