
Most trading systems ask a familiar question:
what is the price doing?
That question matters, but it may be incomplete. An intraday trader should also ask:
when is it doing it?
Explore the product:
Markets Have a Clock, Not Just a Price
An index chart appears continuous, but the process creating each candle is not.
At some times, domestic institutions are establishing positions. At others, traders are reacting to economic releases, adjusting currency exposure, hedging futures or responding to moves that began in another region. Around session transitions, liquidity can expand, contract or migrate between instruments.
This creates recurring "market states". Depending on the time, the same price movement may represent:
- genuine continuation supported by new participation;
- an opening adjustment to information accumulated overnight;
- short covering in a thin period;
- a temporary reaction to a scheduled release; or
- noise with little follow-through.
Time is therefore more than a filter added after a signal. In a specialized intraday strategy, it can be part of the signal's definition.
Why the Nikkei 225 Is Not Forex, Gold or a US Index
The Nikkei 225 is a "price-weighted index of 225 stocks listed on the Prime Market of the Tokyo Stock Exchange". That construction is different from many capitalization-weighted benchmarks and gives the index its own concentration and sensitivity profile. The official index is calculated during the Japanese cash-equity session, while futures and broker-provided derivatives can continue trading outside it.
This matters because different markets organize their trading day differently:
- Forex is decentralized and trades continuously through a chain of regional liquidity centers. Its session effects often appear as shifts in participation rather than the opening of one underlying cash market.
- Gold is a global commodity influenced by currencies, real yields, risk sentiment and several major futures and physical-market venues.
- US equity indices are strongly organized around the US cash open, US economic releases and the closing auction.
- The Nikkei 225 has a domestic cash-market structure centered on Japan, but it can also respond to the yen, overseas equity sentiment and Nikkei futures trading outside Tokyo cash hours.
The consequence is simple: a rule transferred unchanged from EURUSD, XAUUSD or the S&P 500 should not be assumed to retain the same meaning on the Nikkei 225.

Tokyo: Opening Discovery, the Midday Break and the Cash Close
The Tokyo Stock Exchange currently runs its domestic stock auction market from "09:00 to 11:30 and from 12:30 to 15:30 Japan Standard Time". The break divides the cash day into two distinct phases.
Those boundaries can change the interpretation of an M5 setup:
- Before and around the open, the market must absorb information accumulated since the previous cash close. Overnight futures, currencies and moves in foreign markets may all influence price discovery.
- During the morning session, domestic participation is active and the initial imbalance can either develop into a directional move or be rejected.
- Around the midday break and afternoon restart, liquidity and order flow may reorganize.
- Approaching the cash close, hedging, benchmark tracking and position adjustment can become more relevant.
This does not mean that price must rise or fall at any of these moments. It means that the *distribution* of returns, volatility and continuation may differ from one segment to another. That is the hypothesis a quantitative strategy should test.
Europe and the United States Still Matter
The influence of Tokyo does not end when the Japanese cash market closes. Nikkei 225 futures have an extended session, and Japan Exchange Group explicitly notes that its night session lets participants react to European and US markets as well as news released after the stock-market close.
As Europe becomes active, global risk appetite, index futures and currency flows can create a new environment. Later, US economic data and the US equity session can trigger another repricing cycle. For a broker's NI225 CFD, the exact tradable hours, spread and price source will depend on the broker, but the underlying global sequence remains relevant.
This creates an important distinction:
A signal observed outside Tokyo cash hours is not necessarily a weaker version of a Tokyo signal. It may be a different signal produced by a different group of participants.
It also explains why testing must use broker-server time consistently. If research is performed in one timezone and execution rules are deployed in another without correct conversion, a genuine time pattern can be shifted into the wrong market regime.
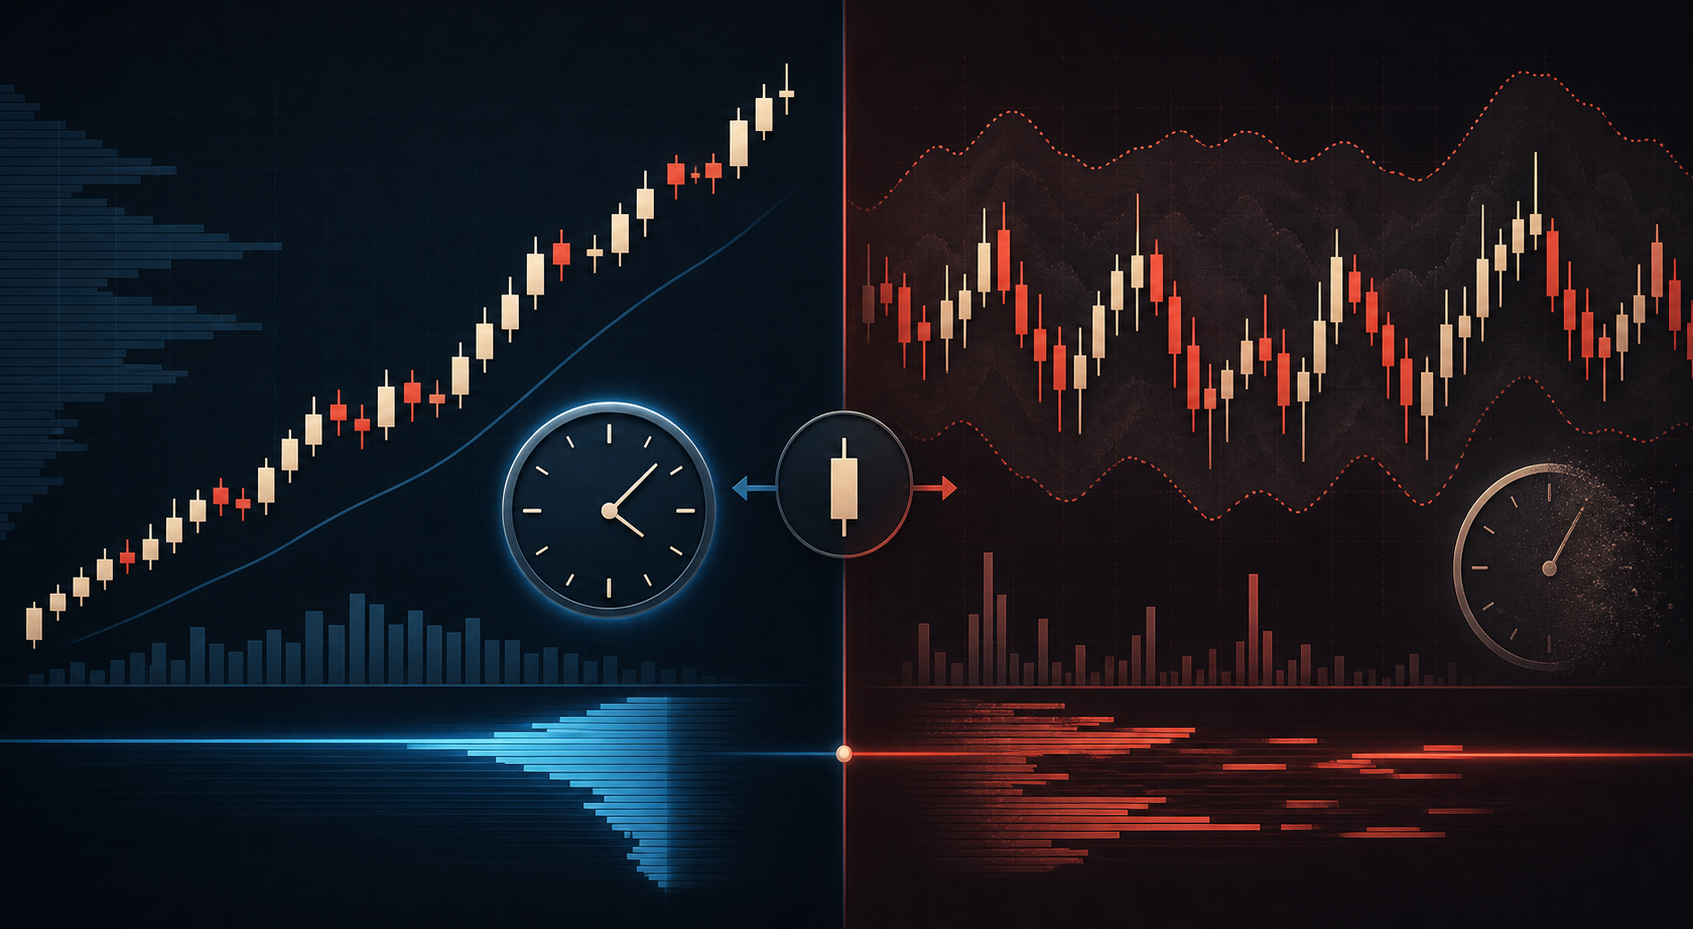
A time-specialized approach:
Why a Tuesday-Morning Signal Can Disappear on Friday
Suppose a backtest finds that a sharp decline at a particular Tuesday time is frequently followed by a rebound. It is tempting to convert that observation into a universal rule: “buy every sharp decline.” That generalization may destroy the original edge.
The Tuesday observation may depend on a specific combination of conditions:
- the amount of information accumulated since the start of the week;
- recurring economic or corporate schedules;
- institutional rebalancing routines;
- the typical state of overnight positioning;
- whether traders are opening new risk or reducing it before the weekend; and
- the interaction between Japan and other active regions at that hour.
By Friday, the balance may have changed. Traders may close exposure rather than initiate it. A move that attracts mean-reversion orders earlier in the week may continue when positions are being reduced before the weekend. The pattern can also vanish temporarily during a new volatility regime.
The correct conclusion is not that “Tuesday always works” or “Friday is dangerous.” It is that “day and time create testable context”. Every claimed pattern still needs enough observations, realistic costs and validation outside the sample in which it was discovered.
A Real Hourly Anomaly or a Statistical Coincidence?
When hundreds of combinations are tested, some will look excellent by chance. If we examine five weekdays, dozens of M5 entry times, multiple holding periods and many indicators, we create thousands of opportunities to discover a false winner.
A credible intraday anomaly should survive several challenges:
- Adequate sample size. A high profit factor based on a handful of trades is fragile.
- Out-of-sample testing. The rule must be evaluated on data that did not select its parameters.
- Nearby-parameter stability. A pattern at 10:05 that collapses completely at 10:00 and 10:10 may be overfitted.
- Cost stress. Spread, commission and slippage must be worse than the optimistic case, not silently ignored.
- Regime stability. Results should be examined across different volatility and trend environments.
- Multiple-testing awareness. The more alternatives we inspect, the stronger the evidence required for the selected rule.
- Economic plausibility. A reasonable connection to session structure or participant behavior is preferable to an unexplained numerical accident.
An anomaly is not “true” because its backtest is profitable. It becomes more credible when its behavior is repeatable, robust and explainable and when its failure conditions are understood.
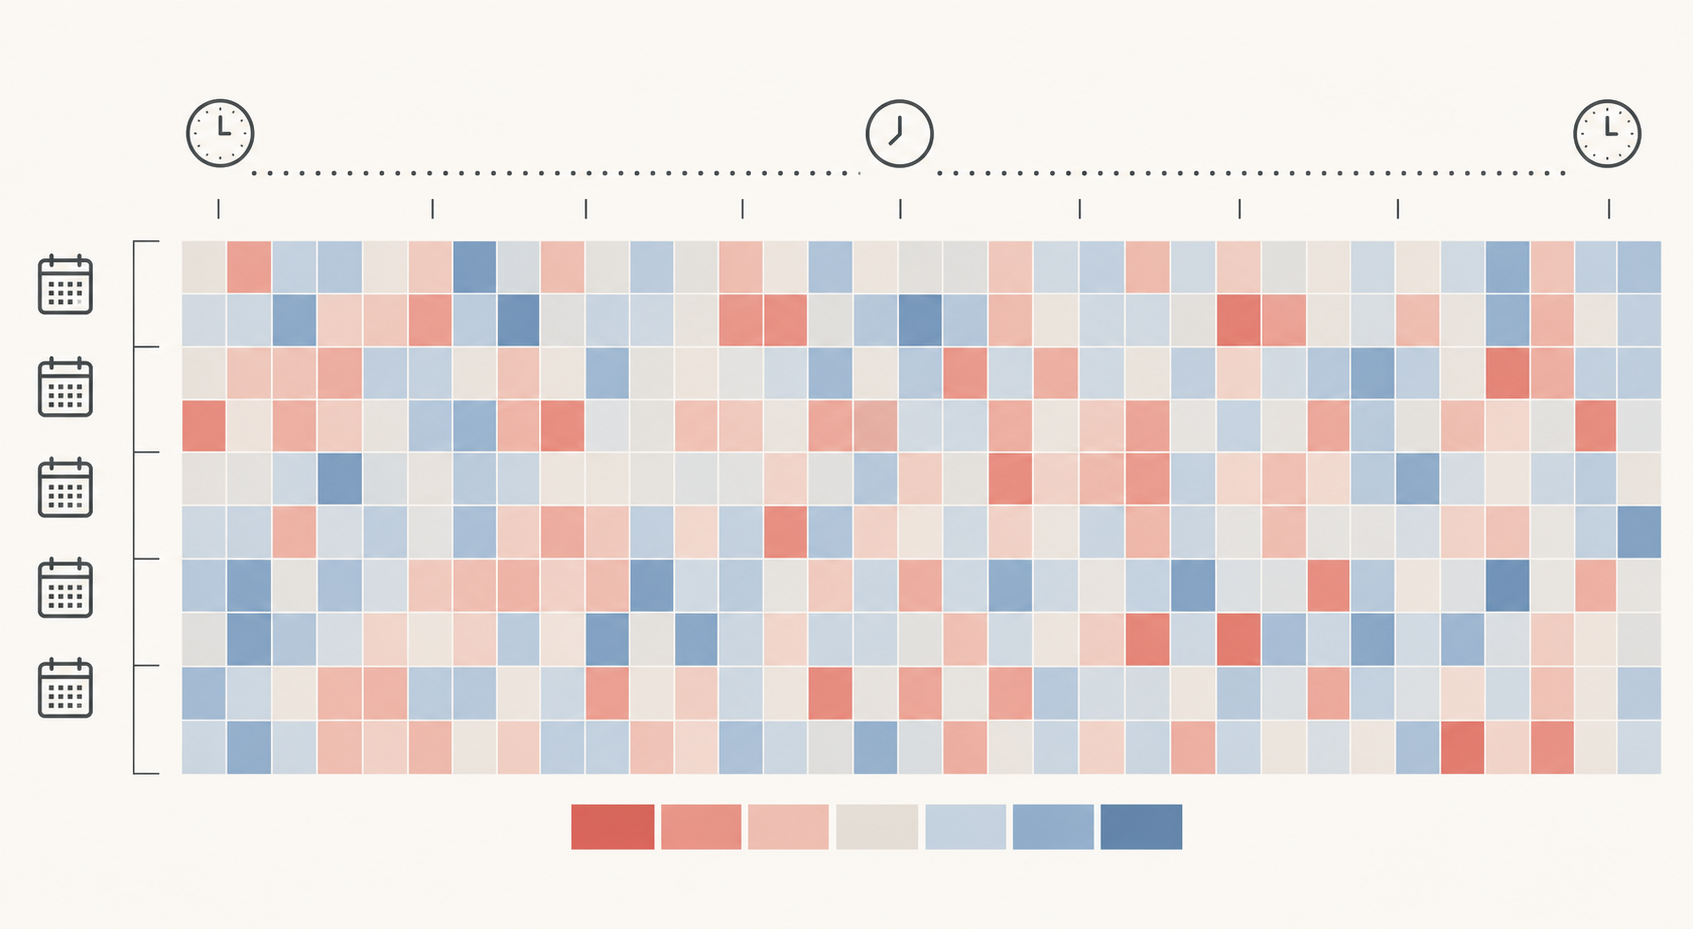
How to Build a Weekday-by-Time Heatmap
A heatmap is one of the clearest ways to explore intraday seasonality. Put weekdays on one axis, time buckets on the other, and calculate one statistic for each cell.
For every M5 bar, record at least:
- broker timestamp and correctly converted Japan time;
- day of the week;
- entry time bucket;
- return over a fixed future horizon;
- current volatility;
- spread and estimated execution cost; and
- whether the Japanese cash market, European markets or the US session is active.
For each weekday-and-time cell, calculate more than the mean return. Include the median, trade count, standard deviation, positive-return frequency and a cost-adjusted result. A useful cell with 300 observations is fundamentally different from a spectacular cell with only six.
Then divide the history into development and validation periods. Build the heatmap on the first period and ask whether the same regions (not necessarily the exact same individual cells) remain visible in the second. Clusters across adjacent times are usually more convincing than isolated bright squares.
Most importantly, do not interpret every red or blue cell as a tradable rule. The heatmap is a research map. Entry conditions, risk, holding time and execution constraints still determine whether a visible tendency can become a viable strategy.
From a Time Pattern to an Automated Rule
Once a pattern passes the initial checks, it can be expressed as a precise automated rule. A robust specification should answer six questions:
- When is the rule allowed to evaluate? Define weekday, hour and timezone.
- What market state is required? For example, a volatility-normalized return, candle range, distance from an average or position relative to a recent high or low.
- Which data are permitted? Use completed candles for the decision if the research assumes completed candles.
- What direction can it trade? Buy, sell or both should be explicit.
- How long does the hypothesis remain valid? Define the exit logic rather than leaving it ambiguous.
- How will real execution differ from research? Account for delayed ticks, spread, slippage, broker symbols and account type.
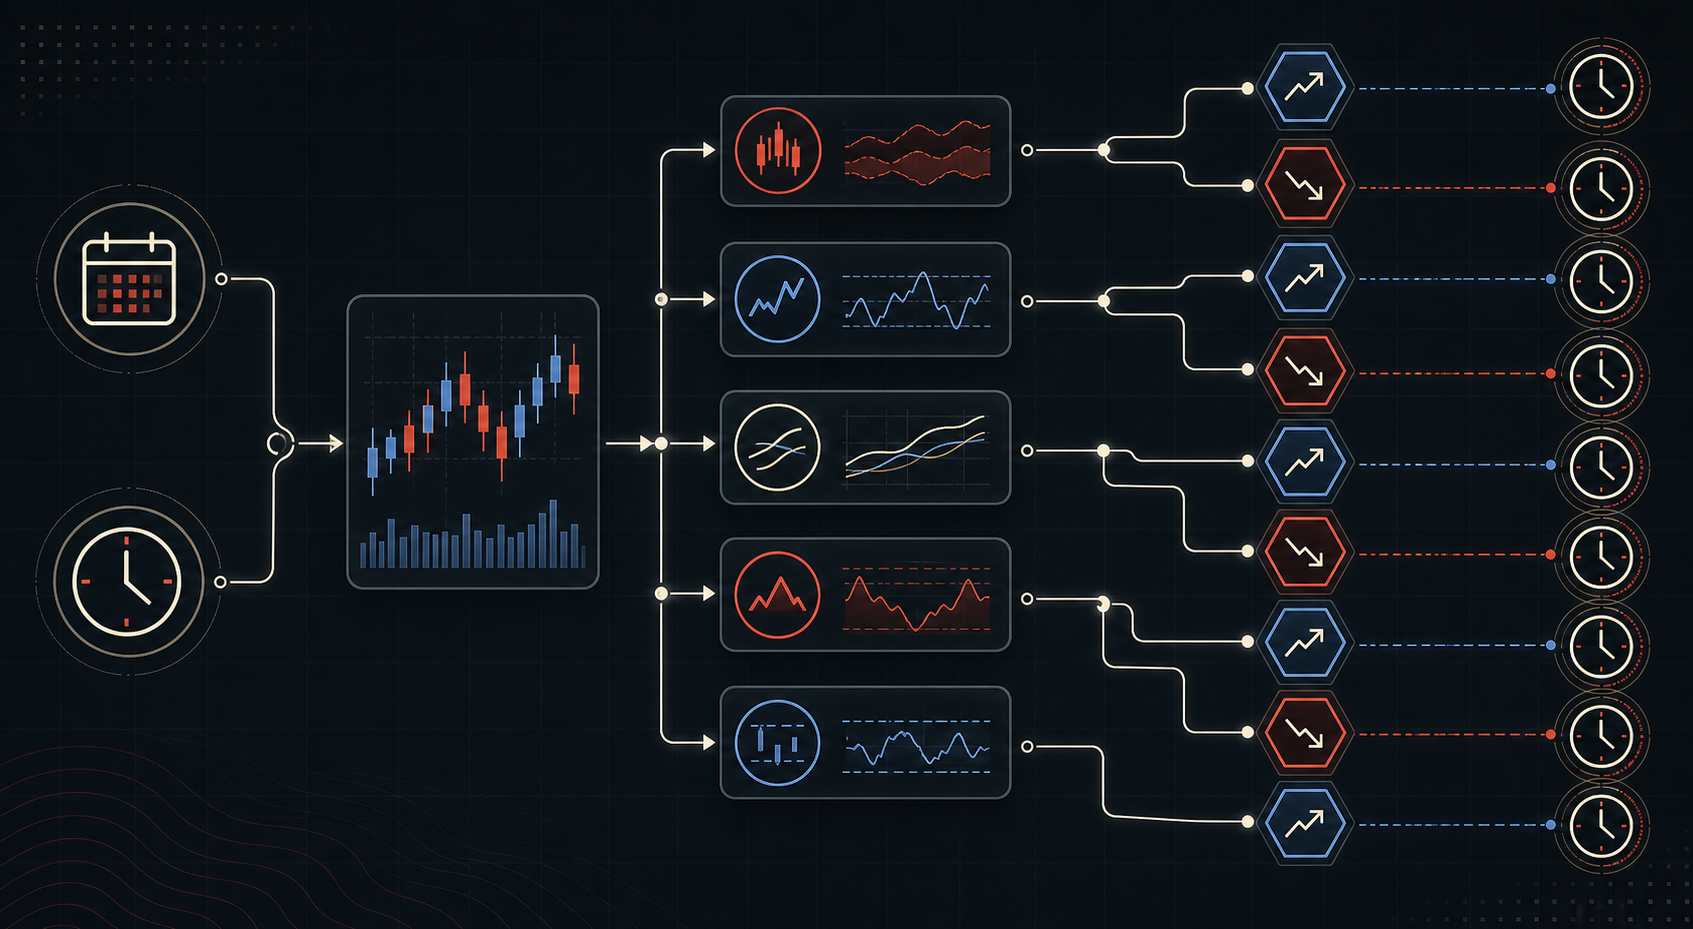
This is where Kuro225 differs from a generic all-day signal. It does "not" apply one universal entry condition to every M5 candle. Instead, it evaluates a portfolio of independent rules assigned to specific weekdays and times. Those rules use completed M5 candles and market-state features normalized by recent volatility. BUY and SELL logic can be selected separately, and each rule has a predefined time-based exit.
Specialization does not guarantee profit, and no historical pattern is permanent. Its purpose is more disciplined: only ask a rule to operate in the context for which it was designed and tested.
The Practical Takeaway
The Nikkei 225 does not have one personality throughout the week. Tokyo price discovery, the midday transition, the cash close, European participation and US-driven repricing can produce different intraday environments. Weekday effects may add another layer, but only when supported by enough data and robust validation.
For systematic traders, the lesson is straightforward:
Do not test only what the market did. Test when it did it, who was likely active and how long the effect persisted.
Kuro225 was built around that principle. It is a specialized M5 Expert Advisor for traders who prefer a portfolio of time-specific Nikkei 225 rules over a generic multi-market signal.
Discover Kuro225
Review the product description, account requirements and current settings before testing. Use the MQL5 Strategy Tester and a demo environment, verify your broker's NI225 symbol and trading schedule, and never assume that historical performance guarantees future results.
Risk disclosure: Trading leveraged products involves a substantial risk of loss. This article is educational and does not constitute investment advice, a recommendation or a promise of performance. Broker specifications and trading hours may differ.