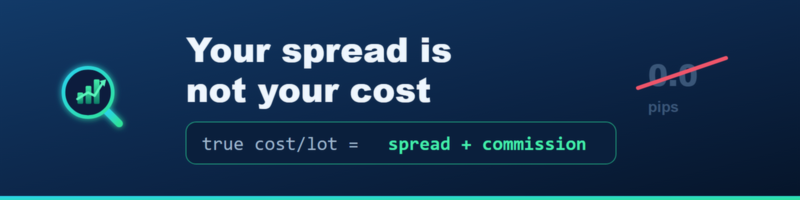
Your spread is not your cost: the number that actually compares two brokers

Most traders compare brokers by the spread. It is the number on the platform and in every ad, and it is the one that tells you the least.
What you really pay
Open a buy and you pay the ask. Close it and you get the bid. If price never moves you finish down by the difference, the spread, and you cross it once per round turn. Add the commission and that is your cost:
true cost per lot = spread in money + commission (round turn)
The spread has to be in money, not pips. In MT5 you can get there straight from the symbol specification: (Ask - Bid) / Tick Size * Tick Value gives you the cost of one lot.
Why 0.0 pips is not free
- Raw account: 0.1 pip (about 1 USD) + 7 USD commission = 8 USD
- Standard account: 1.2 pips (about 12 USD) + no commission = 12 USD
Raw wins here, but not by the 12x the headline suggests. And on a broker with a genuinely tight standard account at 0.7 pips (7 USD), standard wins. The label on the account does not decide it, the arithmetic does.
What comparison tables never show
- Spread stability. An average of 0.9 pips hides the 6 pip blowout at the open or on news.
- Swaps. Converted to money per night they can dwarf the spread if you hold positions.
- Slippage. It only exists on real fills, so no comparison table can show it to you.
A free panel that does it for you
I built a small free MT5 utility that reads whatever account you are on and shows the spread, the true cost per lot with your commission included, swaps converted to money, stop level, execution type, ping, and the real slippage measured from your own fills. It never trades, it only reads and draws a panel.
Broker X-Ray, free on the MQL5 Market
If you try it, post your true cost per lot on EURUSD with your account type (raw or standard). It would be interesting to see how far apart brokers really are.


