Gold Catalyst Drawdown Explained — Legacy 39.4% vs V6.11 Risk Context

Hello traders,
UPDATE NOTE — 8 October 2026
This article has been revised to separate the historical pre-V6 drawdown from Gold Catalyst Evolution V6.11. The old record is preserved for transparency, but it must not be presented as V6.11 performance.
👉 Gold Catalyst Evolution V6.11
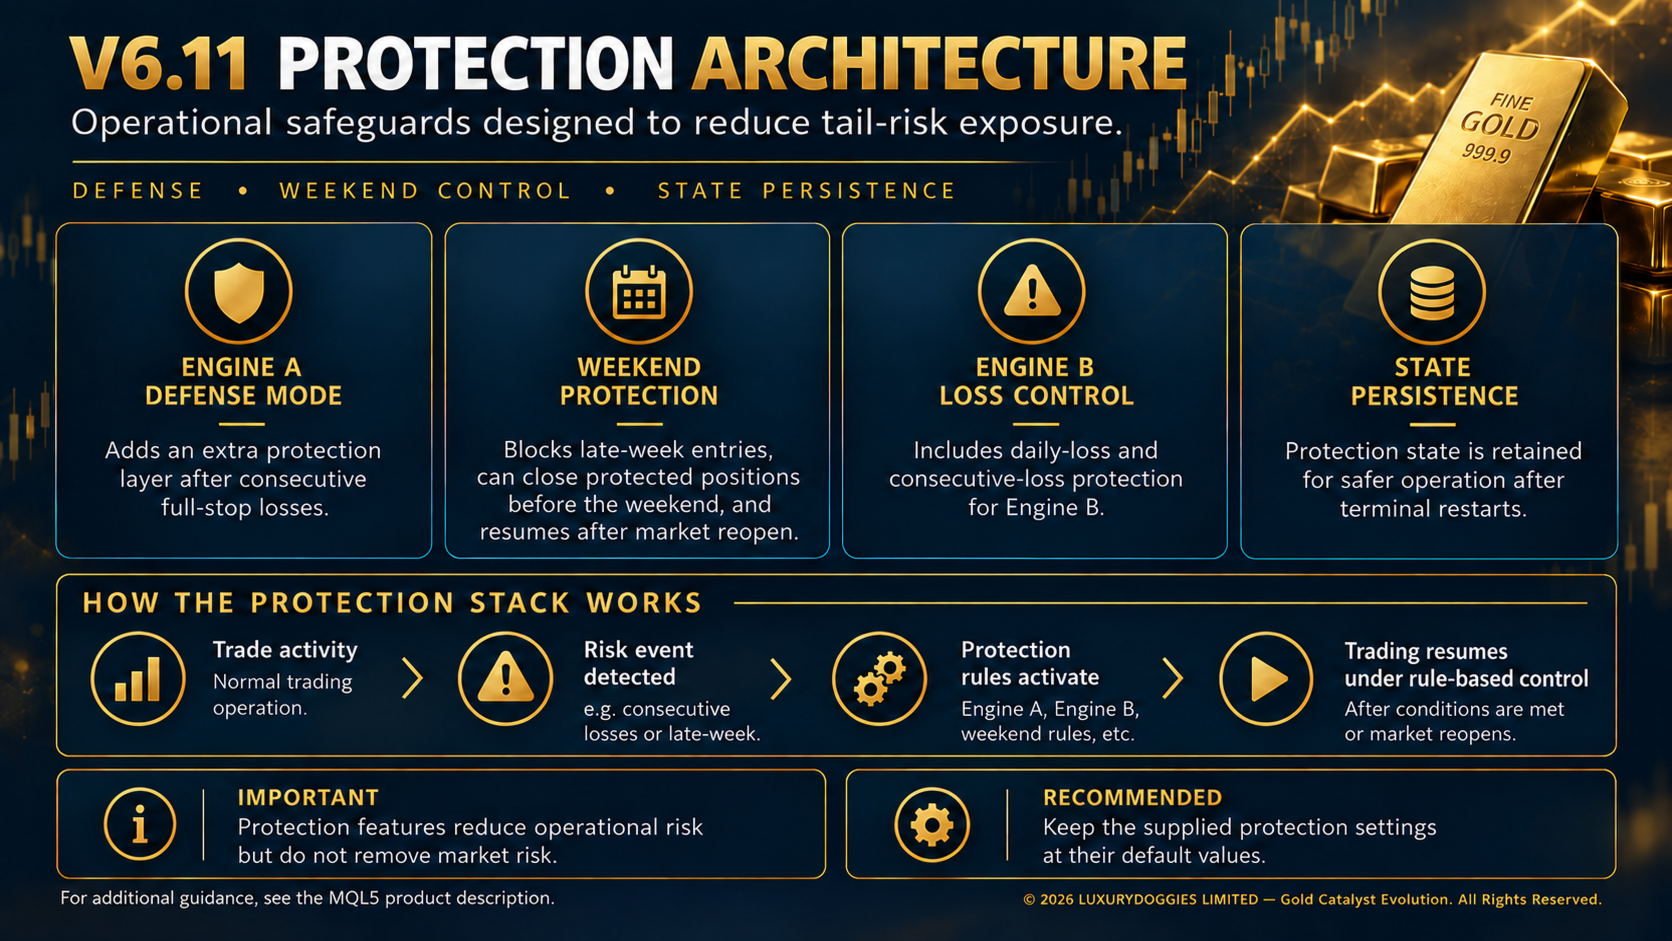 V6.11 protection architecture — current product operating illustration; not a performance result.
 The historical numbers
The earlier Gold Catalyst generation was monitored on a broker demo account from March 2024. The record reports:
- Initial balance: $400
- Reported peak: $7,830 on 2 February 2026
- Reported low: $4,745 on 5 June 2026
- Peak-to-low decline: $3,085
- Peak-to-low percentage: approximately 39.4%
The arithmetic is ($7,830 − $4,745) ÷ $7,830 ≈ 39.4%. This was a demo record, not a live account or independently audited result. Deposits, withdrawals, balance drawdown, and floating-equity drawdown must always be checked separately when evaluating any account.
What drawdown means
Drawdown measures a decline from a prior peak. It can be reported using balance or equity and as absolute, maximal, or relative drawdown. These definitions can produce different headline numbers, so the calculation method must be disclosed.
A 39.4% decline requires approximately a 65% gain from the trough to return to the prior peak. A full 40% decline requires 66.7%. Recovery becomes mathematically harder as drawdown deepens.
Legacy statistics are not V6.11 statistics
The historical record also reported more than 2,400 trades, roughly 12% winners, an approximately 8:1 average winner/loss relationship, and a 46-loss streak. All of these belong to the pre-V6 demo generation. They do not describe or predict V6.11.
A winner following an old losing streak does not mean recovery is guaranteed or that a future winner becomes “due.”
Current V6.11 risk context
V6.11 now uses two independent engines. Engine A has a dual-engine reference fixed lot of 0.02; Engine B uses 0.04 and includes daily and streak-loss participation controls. Separate engines and guards may change behavior, but they do not guarantee a lower future drawdown.
The current V6.11 specification promises no fixed drawdown level. Evaluate balance drawdown and equity drawdown separately for the exact tested version, engine selection, fixed lots, broker and period. A development screenshot or an earlier version’s observation cannot establish a V6.11 drawdown ceiling or future outcome.
Why account-level drawdown matters
Engine A and Engine B have separate magic numbers, positions, protection, and exits, but share the same balance and equity. Risk must therefore be reviewed per engine and for the combined account. Engine B’s guards do not remove Engine A’s independent risk or guarantee total-account protection.
Fixed lots do not scale automatically with balance. Reducing custom lots generally reduces nominal exposure under similar conditions, but spread, slippage, minimum-lot constraints, and engine interaction mean results need fresh testing rather than simple projection.
How to evaluate a drawdown claim
- Ask whether it is balance or equity drawdown.
- Confirm the exact peak, trough, duration, and recovery.
- Check whether the record is backtest, demo, or live.
- Identify version, settings, deposits, withdrawals, and intervention.
- Review floating exposure and margin, not closed trades alone.
- Reject any guaranteed maximum drawdown claim.
Drawdown is not merely a psychological inconvenience; it is a reduction in capital and future capacity. Use only risk you can afford to lose.
👉 V6.11 risk across both engines
👉 Account size and fixed lots
👉 Historical pre-V6 stress periods
Capital and manual fixed lots in V6.11
- USD 400 minimum suggested entry configuration: Engine A enabled at 0.01 lot; Engine B disabled.
- USD 1,000 dual-engine reference: Engine A at 0.02 and Engine B at 0.04; both engines enabled for this reference.
- At USD 1,000 and above, Engine A only, Engine B only or both engines may be selected according to the reviewed capital and risk profile. Engine B may be reduced or disabled for a more conservative profile.
- Lots are set manually and remain static. There is no automatic balance/equity scaling or profit-based compounding.
- For non-USD accounts, convert account equity to its USD-equivalent value before applying USD-based guidance.
These are operating references, not safety guarantees. Increased lots increase potential gains and losses; each selected engine/lot combination needs evaluation under the operating broker’s conditions.
V6.11 protection and operating defaults
- Engine A Defense Mode: an additional protective state after a configured sequence of full-stop losses; internal recovery handling is automatic.
- Protection state persistence: retains protection state across terminal restarts where applicable.
- Weekend Protection: uses the broker’s session timing to block new entries near the weekly close, close protected EA positions before the weekend and resume after the market reopens.
- Engine B loss controls: daily-loss and consecutive-loss monitoring with cooldown behavior.
- Margin and execution checks: available margin and broker volume requirements are checked before orders are sent.
For normal customer operation, adjust engine selection and manual lots according to the evaluated capital and risk profile. Keep strategy, protection, sealed-profile, filter and diagnostic parameters at the supplied defaults. These controls do not guarantee recovery, exact Stop Loss fills, a maximum drawdown or any trading result.
⚠️ Risk disclaimer: Trading leveraged products such as Forex and CFDs involves substantial risk. Historical, backtest, demo, and live results do not guarantee future performance.