Over-Optimization in Strategy Tester: When 10,000 Passes Make Your EA Worse

The curve-fitting trap in Strategy Tester optimization
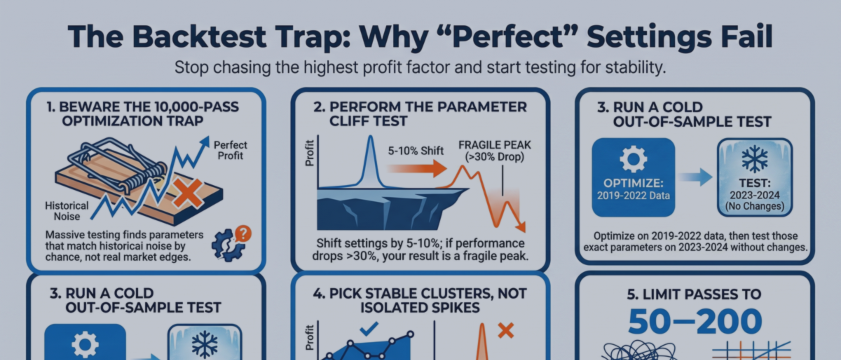
If you have optimized an EA in MetaTrader's Strategy Tester, you have probably done this: defined parameter ranges, hit Start, waited for thousands of combinations to finish, then sorted the results by profit factor and picked the top row. That top row — the one with the highest profit factor and the smoothest equity curve — is almost certainly the most fragile parameter set in the entire list.
A typical sequence: a trader runs 10,000 passes on EURUSD, finds a parameter set showing 83% win rate and 2.4 profit factor, goes live, and within three weeks the EA underperforms parameters they could have picked at random.
Why large parameter sweeps guarantee curve fitting
An EA with 4 input parameters, each tested across 10 values, produces 10,000 combinations. Most are garbage — random sets that lose money. But with 10,000 attempts tested against 500 trading days, some will match historical price action purely by coincidence. The optimizer ranks those coincidences at the top.
This is the same problem as polynomial curve fitting. A straight line through 10 data points captures the real trend but misses individual points. A 9th-degree polynomial passes through every point perfectly — and predicts nothing new because it memorized noise.
In MQL terms, consider what this looks like in practice. You define an optimization with these inputs:
That is 11 x 11 x 5 x 7 = 4,235 combinations. The optimizer tests every single one against the same historical data. The combination of RSI period 13, MACD signal 7, SL multiplier 2.0, TP multiplier 3.5 might show a 2.4 profit factor — not because those values capture market dynamics, but because that specific combination happened to align with price movements on three key trading days in your test window.
Two diagnostic tests before going live
The parameter cliff test
After optimization finishes, do not just take the top result. Open the optimization graph tab in Strategy Tester and look at the parameter landscape. Better yet, take your winning parameter set and manually test neighbors:
Run these neighboring combinations. If performance drops more than 30% from a single step change, the result is fragile — you are on a cliff, not a plateau. Robust parameters have neighbors that also perform reasonably. Fragile parameters are isolated peaks surrounded by losses.
The out-of-sample test
Split your data. Optimize on 2019-2022. Then change only the date range in Strategy Tester settings — do NOT re-optimize — and run a single backtest on 2023-2024 using the exact parameters the optimizer found.
Consider an EA optimized on three years of GBPUSD. In-sample profit factor: 2.1. Out-of-sample (12 months of subsequent data): 0.4. The parameters do not survive contact with unseen price action.
The walk-forward approach
The fix is not to abandon optimization. It is to reduce the search space and validate repeatedly.
Test 50 to 200 combinations, not 10,000. If your EA needs 6 parameters with 20 values each to show a profit, the trading logic is the problem.
Use walk-forward validation: optimize on period 1, test on period 2. Optimize on periods 1+2, test on period 3. Roll forward. MetaTrader does not automate this natively, but the manual workflow is straightforward — note the winning parameters after each optimization, change the date range, run a single backtest, repeat across 3-5 segments.
Stable regions over peak results
The single best result from an optimization is almost always the most over-fit. Instead of selecting the top row, look for regions where most nearby combinations are profitable — clusters of 1.2 to 1.4 profit factor, not an isolated 2.5 spike.
A parameter set at 1.3 profit factor surrounded by profitable neighbors is worth more in live trading than a 2.5 surrounded by losses. The 1.3 captures a broad edge. The 2.5 captured a narrow coincidence with historical data that will not repeat.
The goal is not the best backtest. It is the most resilient parameter region — the set of values where your EA performs consistently across different periods, not spectacularly on one specific window.




![[iVISTscalp5]: EURUSD. Forecast First. Market Reaction Afterwards//October 12-16, 2026](https://c.mql5.com/6/1038/splash-preview-777972.png "[iVISTscalp5]: EURUSD. Forecast First. Market Reaction Afterwards//October 12-16, 2026")