
Divergence Trading Across Multiple Symbols and Timeframes: A Practical Guide with the Divergence Dashboard Indicator

Introduction
You sit down at your desk on Monday morning, open MetaTrader, and begin the ritual: load EURUSD, switch to H4, pull up RSI, scan for divergences. Nothing. Switch to D1. Nothing. Move to GBPUSD H4. Check M15. Then H1. Forty minutes later you have covered four currency pairs across two timeframes and your coffee is cold. Meanwhile, that clean bullish RSI divergence on NZDUSD Weekly -- the one that would have signaled a 200-pip reversal -- went completely unnoticed because you never got to it.
This is the core problem of divergence trading. The technique is one of the most reliable methods for identifying trend reversals and continuations. But scanning for divergences manually across multiple symbols and multiple timeframes is painfully slow, error-prone, and impractical. If you monitor just 20 pairs across 7 timeframes, that is 140 individual chart views to check -- every time you want to look for setups.
I built the Divergence Dashboard indicator to eliminate this bottleneck entirely. It scans all your pairs across all your timeframes automatically, displays every active divergence signal in a single interactive dashboard, and alerts you the moment a new divergence forms -- on your screen, via sound, by email, or as a push notification to your phone. It supports 10 different oscillators, uses a slope validation engine to filter out false signals, and does not repaint.
In this article, I will walk you through the fundamentals of divergence trading, explain the five problems that make manual scanning impractical, and then show you exactly how the Divergence Dashboard works in practice. Whether you are new to divergences or an experienced trader looking for a better workflow, this guide covers everything from theory to execution.
The indicator is available on the MQL5 Market for both platforms:
- MetaTrader 5: Divergence Dashboard MT5
- MetaTrader 4: Divergence Dashboard MT4
What Is Divergence?
Divergence occurs when price and a technical oscillator disagree about direction. While price makes a new high or low, the oscillator fails to confirm it. This disagreement reveals weakening momentum beneath the surface -- a shift that is often invisible on the price chart alone but clearly visible in the oscillator.
The concept rests on a simple principle: momentum precedes price. Before a trend reverses, momentum slows down first. The oscillator measures this momentum, so it starts turning before price does. Divergence is the visual representation of that momentum shift.
There are four types of divergence, divided into two categories:
Regular Divergence (Reversal Signals)
Regular Bullish Divergence forms when price makes a lower low but the oscillator makes a higher low. Price is still falling, but the oscillator shows that downward momentum is weakening. This often precedes an upward reversal.
Regular Bearish Divergence forms when price makes a higher high but the oscillator makes a lower high. Price is still rising, but the oscillator shows that upward momentum is fading. This often precedes a downward reversal.
Hidden Divergence (Continuation Signals)
Hidden Bullish Divergence forms when price makes a higher low but the oscillator makes a lower low. The uptrend is intact at the price level, but the oscillator has dipped deeper. This signals that the uptrend is likely to continue.
Hidden Bearish Divergence forms when price makes a lower high but the oscillator makes a higher high. The downtrend is intact at the price level, but the oscillator has pushed higher. This signals that the downtrend is likely to continue.
Regular divergences are the ones most traders learn first -- they signal reversals at turning points. Hidden divergences are less well known but equally valuable -- they signal that a pullback within a trend is ending and the trend is about to resume.
Figure 1. Regular divergences signal reversals; hidden divergences signal trend continuation.
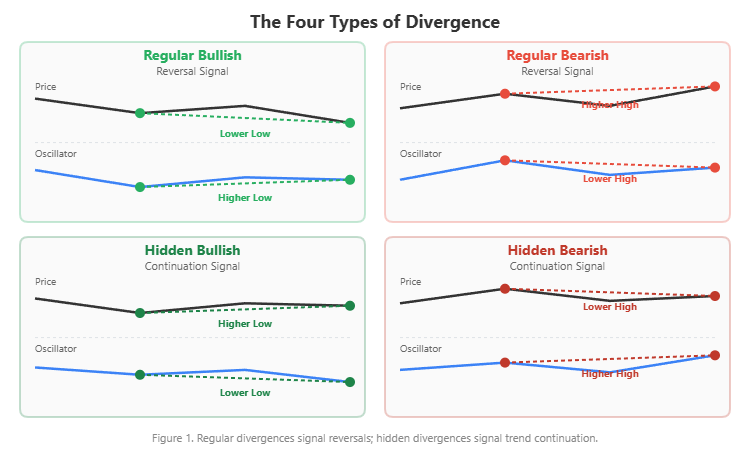
Understanding these four types is essential. The Divergence Dashboard detects all four and clearly labels each signal as "Regular", "Hidden", or "Reg+Hid" (when both types appear simultaneously on the same pivot points).
Why Most Traders Fail at Divergence Trading
Despite its reliability, divergence trading has a high failure rate among retail traders. The problem is not the technique -- it is the execution. Here are the five obstacles:
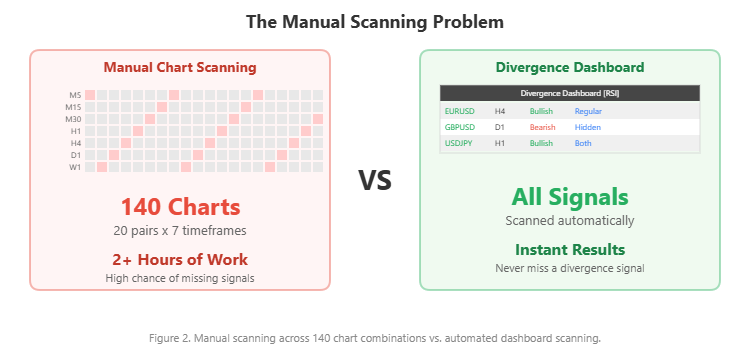
Problem 1: Manual Scanning Is Impractical
If you trade 20 currency pairs and monitor 7 timeframes (M5, M15, M30, H1, H4, D1, W1), that is 140 individual chart views. Even spending just one minute per chart means over two hours of scanning. By the time you finish, signals on the first charts you checked may have already expired. And you will likely miss signals on charts you skimmed too quickly.
Figure 2. Manual scanning across 140 chart combinations vs. automated dashboard scanning.
Problem 2: Which Oscillator Should I Use?
RSI shows divergence, but MACD does not. Stochastic shows divergence on a different pair. CCI shows nothing. Different oscillators detect different divergences at different times because they measure momentum differently. There is no single "best" oscillator -- the optimal choice depends on market conditions, the instrument, and the timeframe.
Problem 3: False Divergences
Not every pattern that looks like a divergence is valid. A common false signal occurs when the oscillator line between the two pivot points crosses the imaginary trendline connecting them. This invalidates the divergence pattern because the momentum reading was disrupted between the two reference points.
Problem 4: Repainting Indicators
Many divergence indicators on the market use the current forming bar in their calculations. When the bar changes (which happens on every tick), the signal can appear, disappear, and reappear. The historical chart looks perfect because only the final version is saved, but in real-time trading, these repainting signals lead to false entries and frustration.
Problem 5: Timing
Even when you spot a legitimate divergence manually, the time it takes to identify it, switch charts, analyze the context, and prepare an order may cost you the optimal entry. Divergence signals are time-sensitive -- the reversal or continuation move often begins within a few bars of confirmation.
These five problems are why I built the Divergence Dashboard. It addresses every one of them: automated scanning across all pairs and timeframes, 10 oscillator choices, slope validation to filter false signals, non-repainting confirmed signals, and instant alerts the moment a divergence forms.
Introducing the Divergence Dashboard
The Divergence Dashboard is a professional-grade multi-symbol, multi-timeframe divergence scanner for MetaTrader 4 and MetaTrader 5. It runs in a separate indicator window and presents all active divergence signals across your entire watchlist in a single interactive table.
What makes it different:
- 10 oscillators to choose from -- switch between them with one setting change
- Non-repainting signals -- only confirmed divergences are displayed; signals never disappear after appearing
- Slope validation engine -- filters out false divergences by verifying that the oscillator does not breach the connecting line between pivot points
- Interactive dashboard -- scrollable table with one-click chart navigation
- 4-channel alerts -- popup, sound, email, and push notifications with smart deduplication
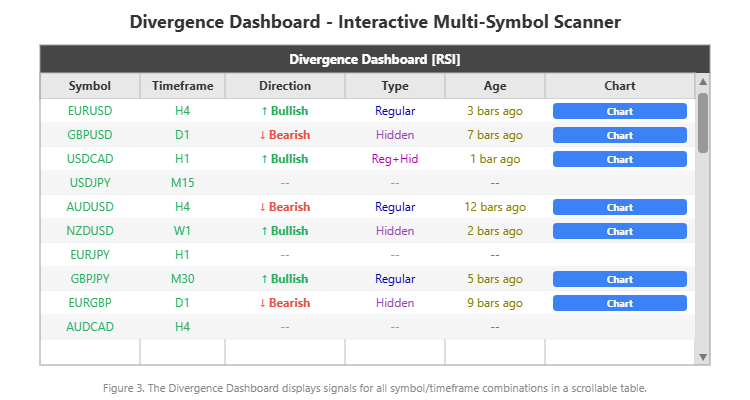
The indicator supports up to 20 symbols and 9 timeframes simultaneously, scanning a maximum of 180 symbol/timeframe combinations in real-time.
Figure 3. The Divergence Dashboard displays signals for all symbol/timeframe combinations in a scrollable table.
The Divergence Dashboard is available on the MQL5 Market for both platforms:
- MetaTrader 5: Divergence Dashboard MT5
- MetaTrader 4: Divergence Dashboard MT4
A free demo version is available for download so you can test the indicator on your own charts before purchasing.
10 Oscillators: Choosing the Right Tool for the Job
The Divergence Dashboard supports 10 different oscillators for divergence detection. Each one measures momentum differently, so each one catches divergences that the others may miss. Here is a practical guide to choosing:
1. RSI (Relative Strength Index, Period 14) The most widely used oscillator for divergence trading. RSI works best in ranging markets and at overbought/oversold extremes. It produces clean, reliable divergences and is an excellent default choice. If you are unsure which oscillator to start with, start with RSI.
2. MACD Main Line (12, 26, 9) MACD is a trend-following oscillator, so it excels at catching larger reversals on higher timeframes. MACD divergences tend to be less frequent but more significant when they appear.
3. MACD Histogram The MACD histogram (the difference between the MACD line and its signal line) is more sensitive than the MACD main line. It often detects divergences earlier, though with a slightly higher false signal rate.
4. Stochastic (14, 3, 3) Stochastic is excellent for overbought/oversold divergences in ranging markets. Its sensitivity makes it better suited for shorter timeframes and scalping setups.
5. CCI (Commodity Channel Index, Period 10) CCI measures the deviation of price from its statistical mean. It is particularly useful for detecting divergences on cyclical instruments or when looking for extreme momentum exhaustion.
6. Momentum (Period 10) Momentum is the simplest oscillator -- it measures the raw rate of price change with no smoothing. It is fast and responsive but can produce noisy signals in choppy markets.
7. OBV (On Balance Volume) OBV is a volume-based oscillator that tracks cumulative buying and selling pressure. OBV divergences can reveal institutional accumulation or distribution that is invisible in pure price-based oscillators. This is a powerful choice for forex pairs during active sessions.
8. Volume-Weighted MACD A custom oscillator that applies volume weighting to the MACD calculation. It combines the trend-following nature of MACD with volume confirmation, producing divergences that reflect both price and participation.
9. Chaikin Money Flow (Period 21) CMF measures the accumulation/distribution pressure over a 21-bar period. CMF divergences are slower to form but often indicate strong underlying shifts in buying or selling pressure.
10. Money Flow Index (Period 14) MFI is sometimes called the "volume-weighted RSI." It combines price and volume data to produce an oscillator that ranges from 0 to 100, similar to RSI but with volume weighting. It is particularly useful for forex trading.
Figure 4. The Divergence Dashboard supports 10 different oscillators, selectable with a single parameter change.

The dashboard title bar always displays which oscillator is currently active, so you always know what you are looking at.
How the Detection Engine Works
Understanding how the Divergence Dashboard detects signals helps you trust its output and trade with confidence. Here are the key technical components:
Pivot Point Detection
The engine identifies swing highs and swing lows using a configurable pivot period (default: 5 bars on each side). A pivot low is confirmed only when the bar has lower lows than all bars within the specified period on both sides. This ensures that only significant turning points are used as divergence reference points.
Divergence Matching
Once pivot points are identified on both the price chart and the oscillator, the engine compares them systematically. It checks up to 10 previous pivot points (configurable) and allows divergences to span up to 100 bars (configurable). For each pair of price pivots, it checks whether the oscillator pivots at the corresponding bars create a divergence pattern.
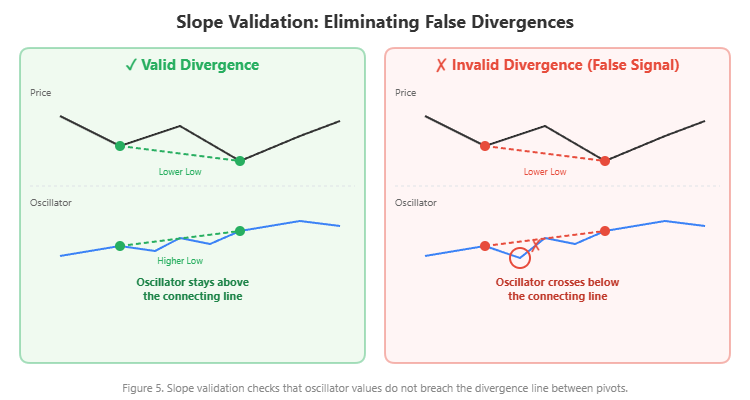
Slope Validation Engine
This is the key differentiator. After a potential divergence is identified between two pivot points, the engine draws a virtual line connecting the oscillator values at those two points. It then checks every intermediate bar to verify that the oscillator value does not cross this line. If the oscillator dips below the line (for bullish) or rises above it (for bearish), the divergence is rejected as invalid.
This eliminates a large class of false divergences that other indicators would report as valid signals.
Figure 5. Slope validation checks that oscillator values do not breach the divergence line between pivots.
Non-Repainting Mechanism
The engine only calculates signals starting from bar index 1 (the most recently closed bar). It never uses the current forming bar (bar 0) in its calculations. This means that once a signal appears, it will never disappear. The signal is confirmed by the closing of the bar, making it reliable for trading decisions.
Efficient Scanning
To maintain performance while scanning up to 180 symbol/timeframe combinations, the dashboard only recalculates each combination when a new bar forms on that timeframe. It does not recalculate on every tick. The oscillator is computed once per symbol/timeframe combination and reused for all divergence checks, minimizing CPU usage.
The Interactive Dashboard: Your Command Center
The dashboard displays all divergence signals in a 6-column table:
| Column | Content | Description |
|---|---|---|
| Symbol | Currency pair | The instrument where the divergence was detected (e.g., EURUSD) |
| Timeframe | M5 to MN | The timeframe of the divergence signal |
| Direction | Bullish / Bearish | Green up-arrow for bullish, red down-arrow for bearish |
| Type | Regular / Hidden / Reg+Hid | The classification of the divergence pattern |
| Age | Bars ago | How many bars ago the signal first appeared |
| Chart | Jump button | Click to instantly switch the chart to that symbol and timeframe |
Interactive Controls
- Mouse wheel scrolling: Scroll through rows with your mouse wheel
- Draggable scrollbar: Click and drag the scrollbar thumb for direct navigation
- Up/Down buttons: Arrow buttons at the top and bottom of the scrollbar
- One-click chart navigation: Every signal row has a "Chart" button that switches your current chart to that symbol and timeframe, so you can immediately analyze the setup
Filter Mode
When the "Filter & Sort by Most Recent Signals" option is enabled, the dashboard hides all empty rows (symbol/timeframe combinations with no active divergence) and sorts the remaining signals by age, with the most recent signal at the top. This is ideal when monitoring many pairs and you want to focus only on actionable signals.
Chart Visualization
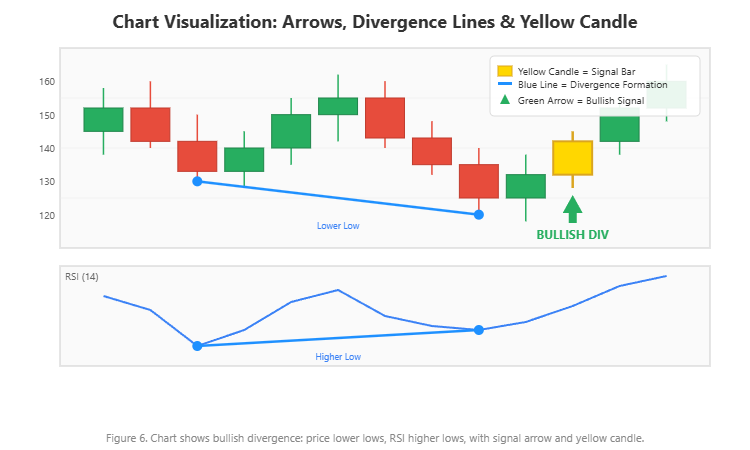
When a divergence is detected on the current chart, the indicator draws:
- Colored arrow: Green below the bar for bullish, red above the bar for bearish (customizable Wingdings code, color, and size)
- Text label: "BULLISH DIV" or "BEARISH DIV" positioned near the arrow
- Divergence line: A blue line connecting the two pivot points on the price chart, clearly showing the divergence formation
- Yellow candle: The confirmation bar is highlighted with a yellow body and wicks, making it instantly visible
The arrow and label positions are calculated using ATR-based offsets, so they automatically adjust to the current volatility and never overlap with the price bars.
Figure 6. Chart shows bullish divergence: price lower lows, RSI higher lows, with signal arrow and yellow candle.
4-Channel Alert System
The Divergence Dashboard triggers alerts through four independent channels:
Popup Alert: A MetaTrader alert dialog appears on screen with the full signal details.
Sound Alert: Plays a customizable .wav sound file. Use any sound from your MetaTrader Sounds folder.
Email Alert: Sends an email through MetaTrader's configured email settings. Useful for receiving signals when you are away from your terminal.
Push Notification: Sends a notification to your phone via the MetaTrader mobile app. This is the most practical channel for traders who cannot monitor charts all day.
Each channel can be enabled or disabled independently. You can, for example, enable only push notifications and sound alerts while disabling popup and email.
Smart Alert Deduplication
The dashboard includes built-in deduplication logic that prevents the same divergence signal from triggering multiple alerts. Once an alert fires for a specific symbol/timeframe/direction combination, no repeat alert is sent until either a new bar forms or the signal direction changes. This eliminates alert spam while ensuring you never miss a genuine new signal.
Alert message format:
Divergence Dashboard: EURUSD BULLISH Regular Divergence on H4 [RSI]
A practical setup: run the Divergence Dashboard on a VPS with push notifications enabled. You receive alerts on your phone throughout the day. When a signal arrives, open the MetaTrader mobile app or your desktop terminal, click the chart button in the dashboard, and evaluate the setup.
Practical Trading Workflow
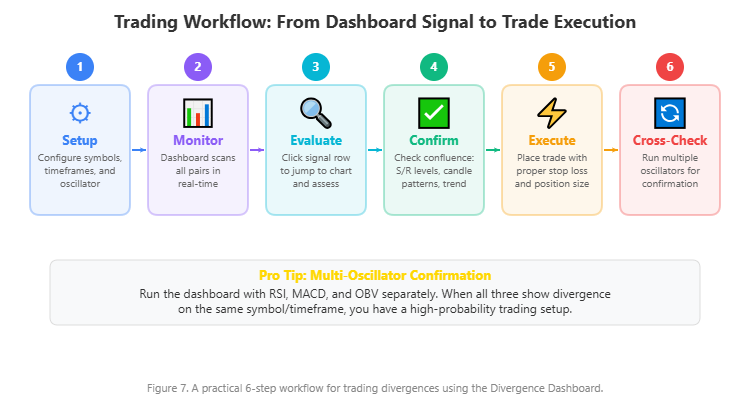
Here is a step-by-step workflow for using the Divergence Dashboard in daily trading:
Step 1: Setup
Add your symbols as a comma-separated list (up to 20 pairs). Enable the timeframes you trade. Choose your oscillator -- RSI is a solid default. If your broker uses symbol prefixes or suffixes (like "m." or ".pro"), enter them in the corresponding fields.
Step 2: Monitor
Let the dashboard scan continuously. Active divergences appear in real-time as new bars form. The dashboard updates automatically -- you do not need to click or refresh anything.
Step 3: Evaluate
When a signal appears, click the "Chart" button in that row. The indicator switches your current chart to the signal's symbol and timeframe. Now assess:
- Timeframe: Higher timeframes (H4, D1, W1) produce fewer but more reliable signals
- Type: Regular divergence at a support/resistance level is a reversal play; hidden divergence in a trending market is a continuation play
- Age: Fresher signals (1-3 bars) have more remaining potential than stale ones (10+ bars)
Step 4: Confirm
Never trade divergence in isolation. Look for confluence:
- Does the signal align with a key support or resistance level?
- Is there a confirming candlestick pattern (pin bar, engulfing, doji)?
- Does the signal align with a trendline or moving average?
- Is the market in a state where this type of divergence is likely to work (ranging for regular, trending for hidden)?
Step 5: Execute
Place your trade with proper risk management. Use the divergence pivot points as reference levels for stop loss placement. The signal gives you directional bias; your risk management determines your survival.
Step 6: Multi-Oscillator Confirmation
For the highest-confidence setups, run the Divergence Dashboard multiple times with different oscillators. If RSI, MACD, and OBV all show divergence on the same symbol/timeframe, the probability of a valid signal increases substantially. The dashboard makes this cross-validation practical -- just change the oscillator setting and check.
Figure 7. A practical 6-step workflow for trading divergences using the Divergence Dashboard.
Real Trade Examples from the Chart
Theory is valuable, but nothing builds confidence like seeing real signals on real charts. The screenshots below show the Divergence Dashboard in action across different instruments, timeframes, and oscillators -- all captured from live MetaTrader 4 charts.
EURUSD M15 -- MACD Histogram Bearish Divergence
This chart shows a Regular Bearish divergence detected by the MACD Histogram oscillator on the EURUSD 15-minute chart. Price made a higher high while the MACD Histogram made a lower high. The red divergence line connects the two pivot points on the price chart, and the yellow-highlighted confirmation candle marks where the signal was confirmed. Notice the dashboard below the chart: the indicator is simultaneously tracking divergences across all EURUSD timeframes from M5 to W1, with both regular and hidden signals of varying ages.
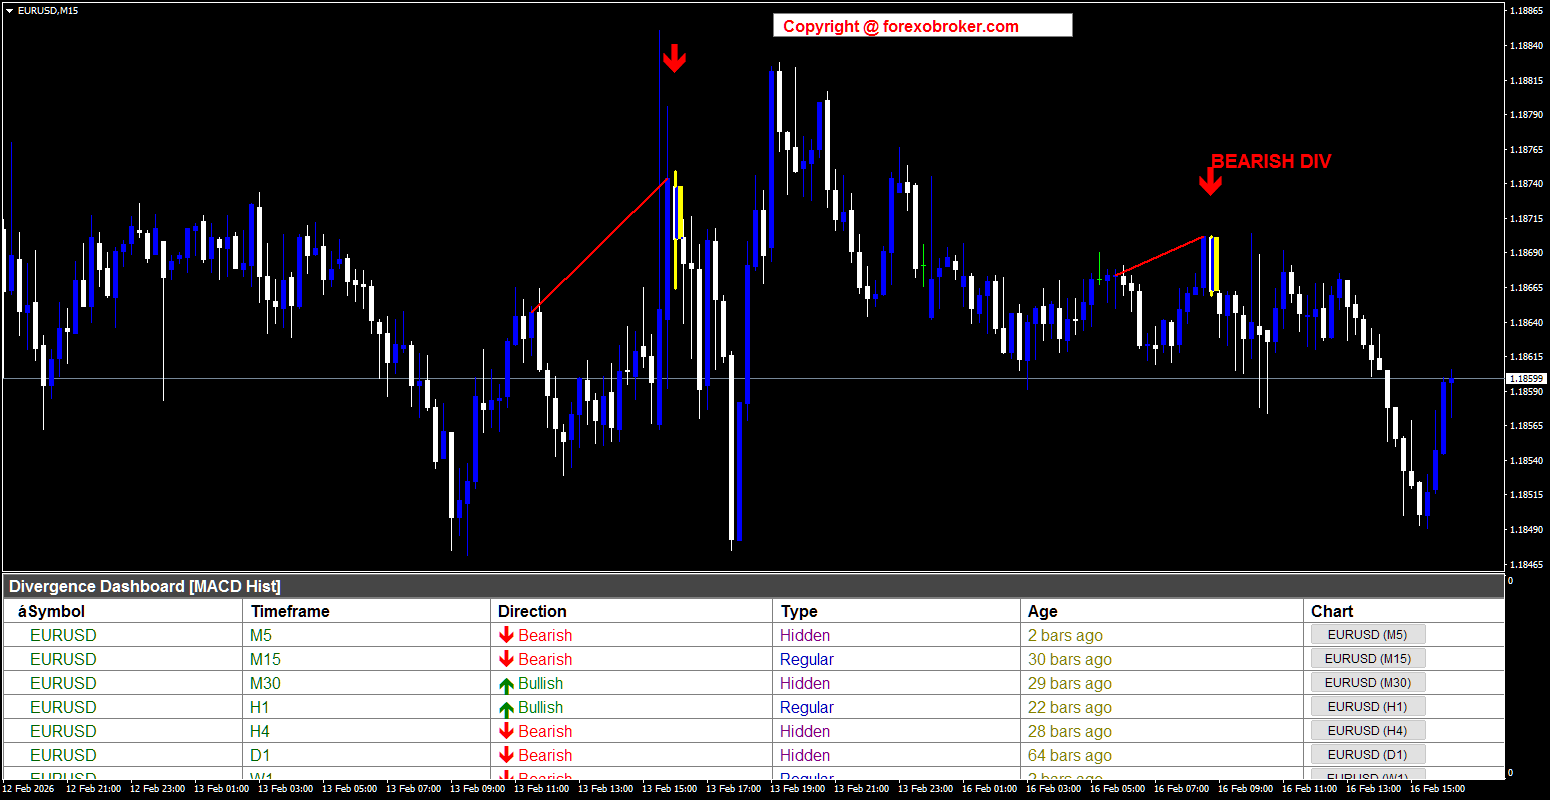
Figure 8. EURUSD M15: Regular bearish divergence detected by MACD Histogram. The dashboard shows active signals across all monitored timeframes.
EURUSD M5 -- RSI Dual Signals (Bearish and Bullish)
Here is the same pair on a faster M5 timeframe, now using the RSI oscillator. Two divergences are visible simultaneously: a Bearish divergence (red line and down arrow) where price formed higher highs while RSI formed lower highs, followed by a Bullish divergence (blue line and green up arrow) where price made lower lows while RSI made higher lows. This is a textbook example of how the market transitions from one divergence signal to another. The yellow candles mark each confirmation point.
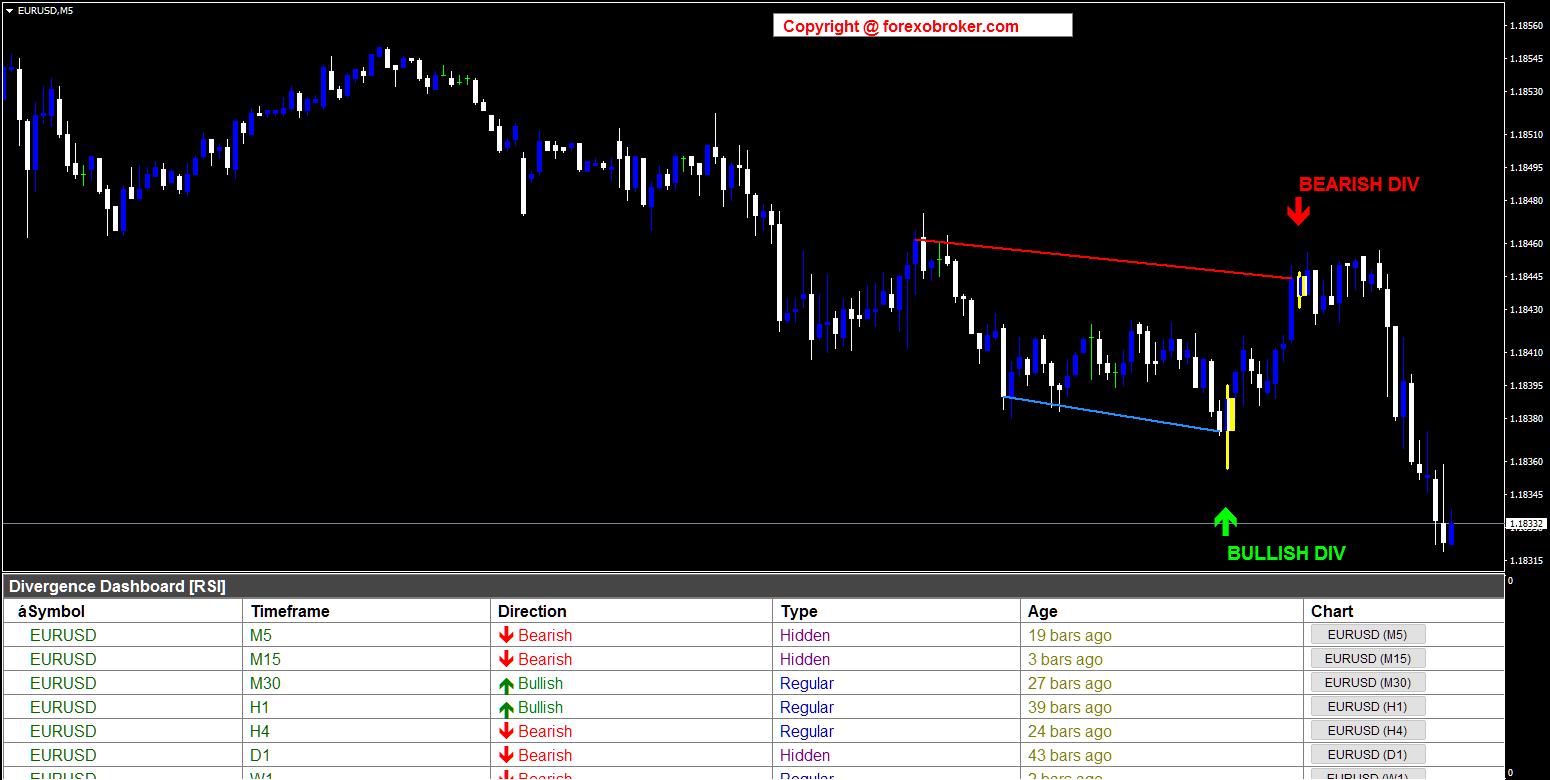
Figure 9. EURUSD M5: Both bearish and bullish divergences on the same chart using RSI. This demonstrates how quickly opportunities can appear on lower timeframes.
USDCAD M5 -- MACD Multi-Symbol Filtered View
This screenshot demonstrates the multi-symbol scanning and filter mode in action. The MACD oscillator detected a Bearish divergence on USDCAD M5, shown by the red divergence line and yellow confirmation candle. But look at the dashboard: it is running in FILTERED mode, displaying signals from multiple symbols -- USDCAD, USDJPY, EURUSD, and GBPUSD -- all sorted by age with the freshest signals at the top. This is what a real scanning workflow looks like: one glance at the dashboard tells you where divergences are forming across your entire watchlist.
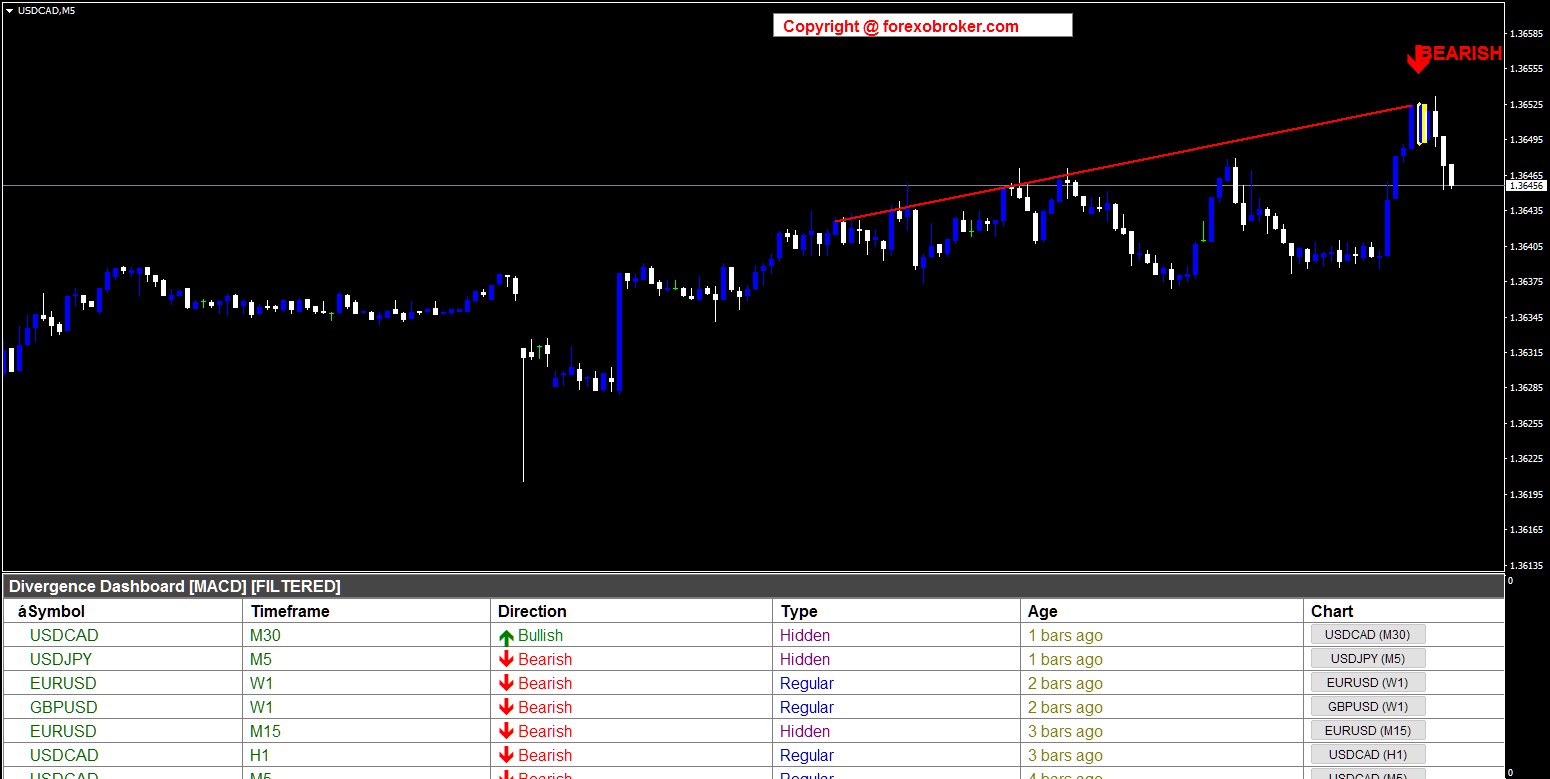
Figure 10. USDCAD M5: Bearish MACD divergence with the dashboard in filtered mode, showing signals across multiple symbols simultaneously.
XAUUSD M15 -- Stochastic Divergence on Gold
The Divergence Dashboard works beyond forex. This chart shows Gold (XAUUSD) on the M15 timeframe with the Stochastic oscillator. Two signals are visible: a Bearish divergence near the top as the price rally exhausted (red line and down arrow), and a Bullish divergence at the bottom after a sharp sell-off (blue line and green up arrow). The filtered dashboard below shows the indicator scanning across multiple symbols including USDCAD, USDJPY, and XAGUSD (Silver). Gold's high volatility makes it an excellent candidate for divergence trading, and the slope validation engine helps filter out the noise.
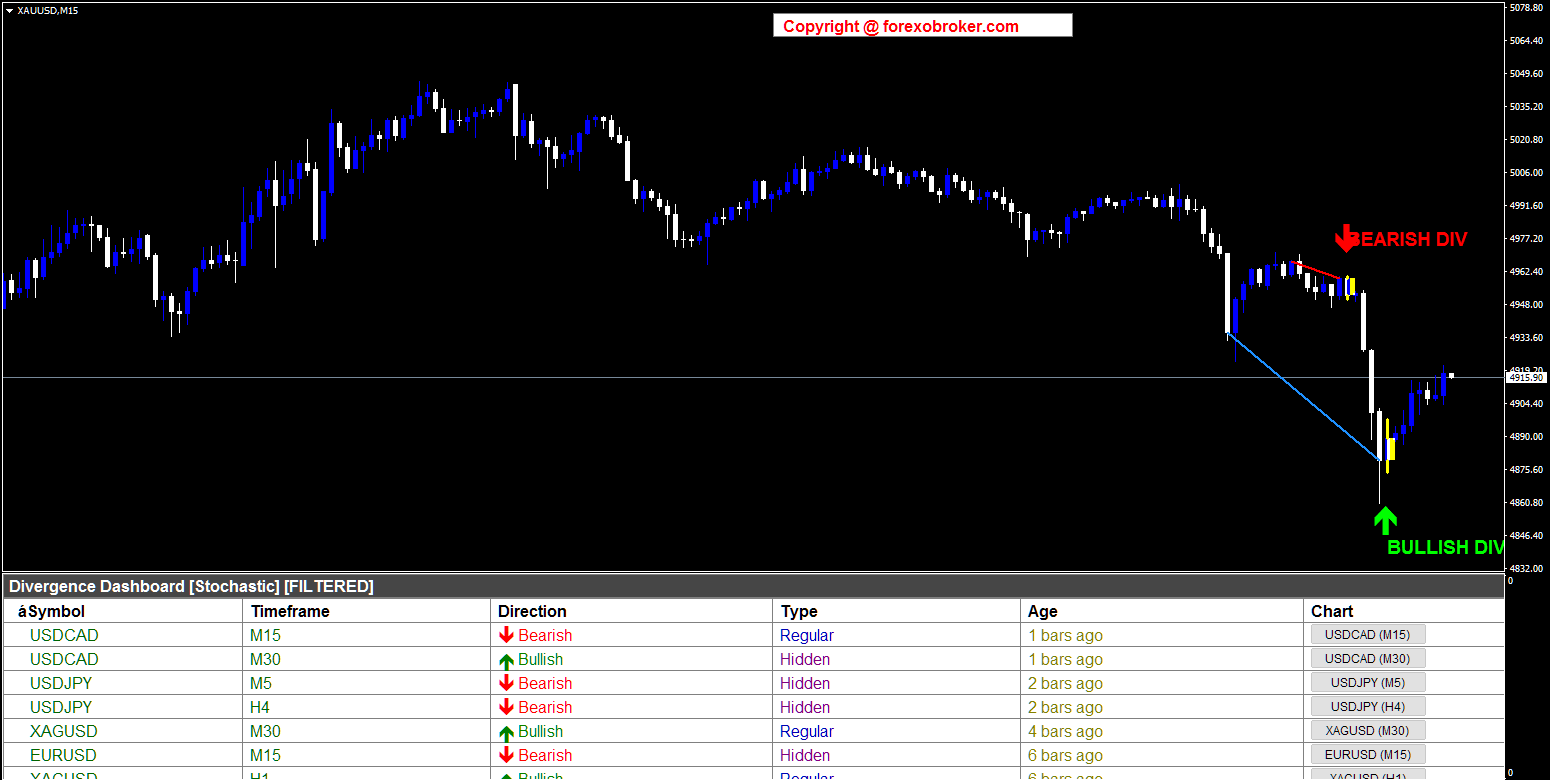
Figure 11. XAUUSD M15: Stochastic divergence on Gold, demonstrating the indicator's effectiveness on commodities and metals.
SOLUSD Daily -- Stochastic Divergence on Crypto
Here is proof that the indicator works on cryptocurrency pairs as well. This is Solana (SOLUSD) on the Daily timeframe. During a major downtrend from approximately 270 to 80, the Stochastic oscillator detected a Bearish divergence during a relief rally (red line and down arrow), correctly signaling that the downtrend would continue. Later, a Bullish divergence appeared near the bottom (green up arrow), signaling potential reversal. The dashboard shows the indicator is monitoring crypto alongside traditional forex pairs and metals.
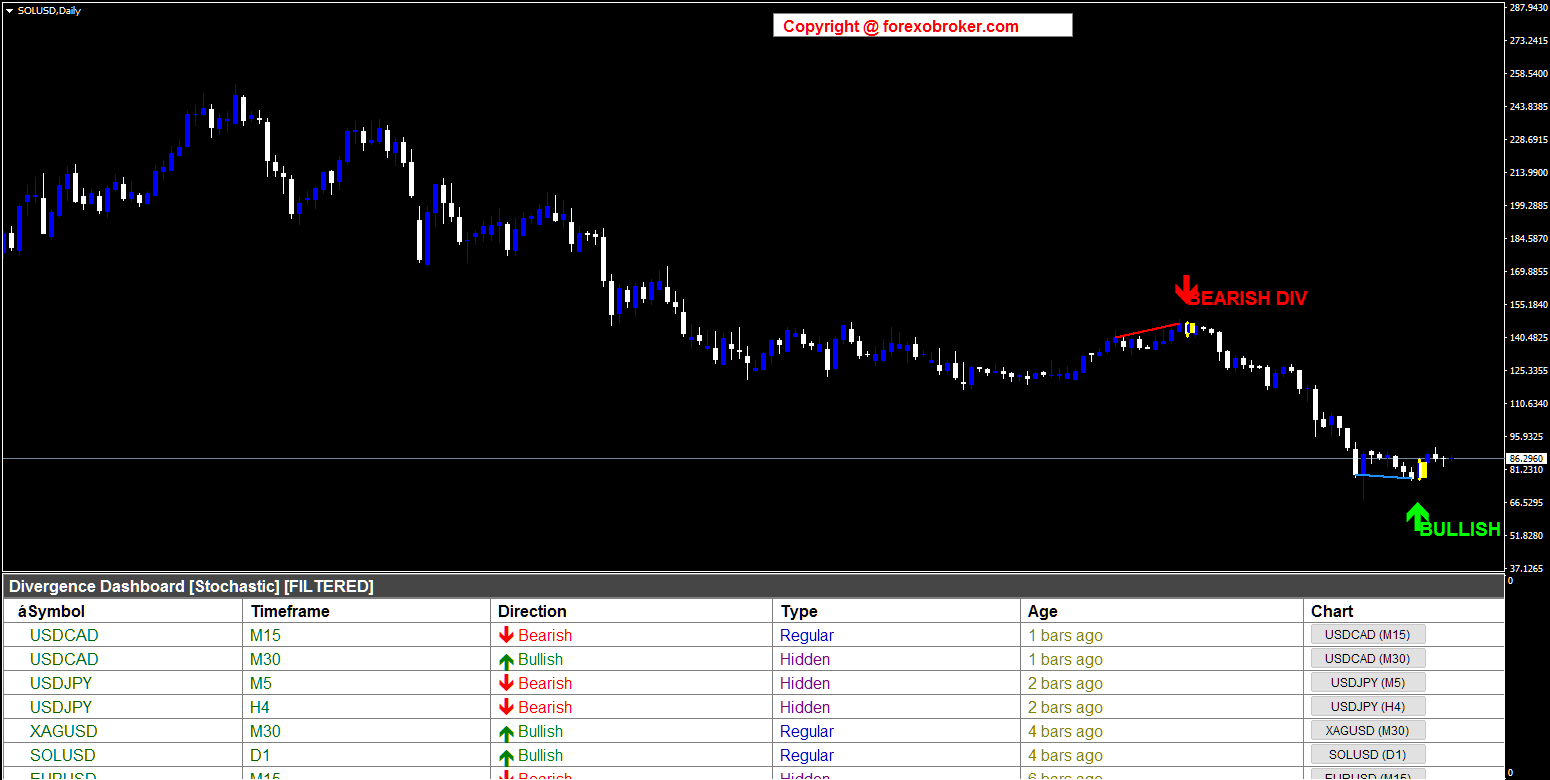
Figure 12. SOLUSD Daily: Divergence detection on cryptocurrency. The Divergence Dashboard works on any instrument available in your MetaTrader terminal.
US30 H1 -- OBV Divergence on Indices
Finally, here is the Dow Jones (US30) on the H1 timeframe using the OBV (On Balance Volume) oscillator. A Bearish divergence was detected as price pushed to new highs while OBV failed to confirm -- a classic sign of weakening buying pressure. The filtered dashboard below shows signals from multiple asset classes: USDCAD, US500, USDJPY, EURUSD, and more. This example highlights two important points: the indicator works on stock indices, and OBV divergences can reveal institutional selling pressure that is invisible in price-only oscillators.
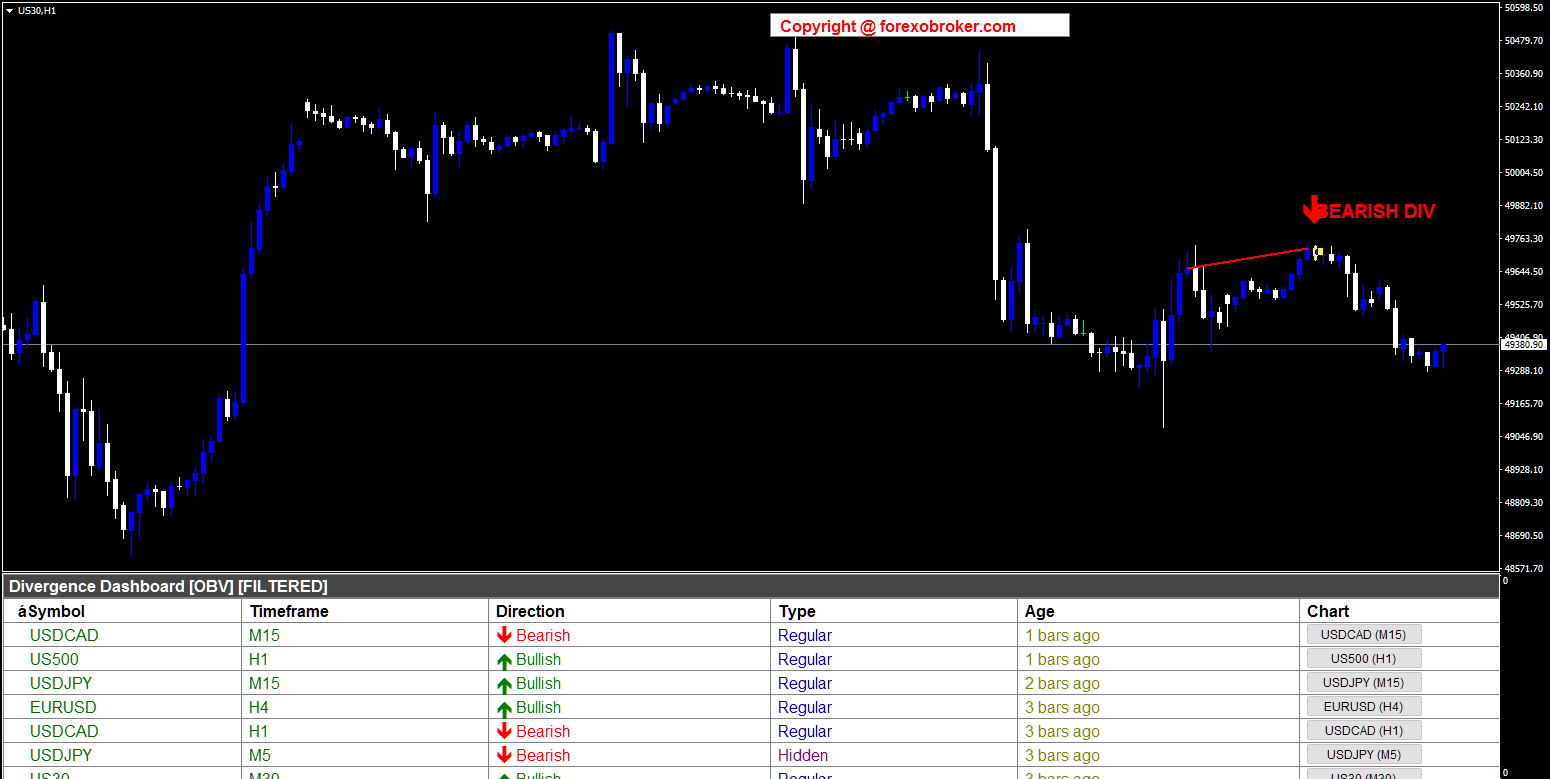
Figure 13. US30 H1: OBV divergence on the Dow Jones index. Volume-based oscillators reveal institutional activity that pure price oscillators cannot detect.
These six examples demonstrate the Divergence Dashboard's versatility across four asset classes (forex, metals, crypto, indices), five oscillators (RSI, MACD, MACD Histogram, Stochastic, OBV), and four timeframes (M5, M15, H1, Daily). Every screenshot is from a live chart with real market data -- no hypothetical examples, no cherry-picked backtests.
Parameter Reference Guide
The Divergence Dashboard offers comprehensive customization through its input parameters:
Dashboard Settings
| Parameter | Default | Description |
|---|---|---|
| Symbols | EURUSD,GBPUSD,USDCAD,USDJPY | Comma-separated list of symbols to monitor (up to 20) |
| Symbol Prefix | (empty) | Broker prefix for symbol names |
| Symbol Suffix | (empty) | Broker suffix for symbol names |
| M1 through MN | M5-W1 enabled | Individual toggles for each of the 9 timeframes |
| Visible Rows | 12 | Number of visible rows in the dashboard before scrolling |
| Filter & Sort | false | Show only active signals, sorted by most recent first |
Divergence Settings
| Parameter | Default | Description |
|---|---|---|
| Pivot Period | 5 | Bars on each side for pivot detection (5 = 11-bar pattern) |
| Price Source | Close | Use Close price (0) or High/Low (1) for pivot identification |
| Divergence Type | Both | Detect Regular only (0), Hidden only (1), or Both (2) |
| Max Pivot Points | 10 | How many previous pivots to check for divergence matching |
| Max Bars Between Pivots | 100 | Maximum bar distance between two divergence pivots |
| Max History Bars | 500 | How far back in history to scan for divergences |
Oscillator Selection
| Parameter | Default | Description |
|---|---|---|
| Oscillator | RSI | Choose from 10 oscillators (RSI, MACD, MACD Histogram, Stochastic, CCI, Momentum, OBV, VWMACD, CMF, MFI) |
| Divergence Line Color | DodgerBlue | Color of the divergence formation line on the chart |
| Divergence Line Width | 2 | Pixel width of the divergence formation line |
Chart Arrow Settings
| Parameter | Default | Description |
|---|---|---|
| Show Arrows | true | Display signal arrows on the chart |
| Show Labels | true | Display "BULLISH DIV" / "BEARISH DIV" text labels |
| Buy Arrow Color | Lime | Color for bullish divergence arrows |
| Sell Arrow Color | Red | Color for bearish divergence arrows |
| Arrow Size | 4 | Arrow size (1 to 5 scale) |
| Arrow Gap | 0.8 | ATR multiplier for arrow distance from price |
| Label Gap | 1.8 | ATR multiplier for label distance from price |
| Arrow Codes | 233 / 234 | Wingdings character codes for bullish/bearish arrows |
Alert Settings
| Parameter | Default | Description |
|---|---|---|
| Alert Title | Divergence Dashboard | Custom title in alert messages |
| Popup Alerts | true | Enable on-screen popup alerts |
| Sound Alerts | true | Enable audio alerts |
| Sound File | alert2.wav | Custom sound file for audio alerts |
| Email Alerts | false | Enable email notifications |
| Push Alerts | true | Enable mobile push notifications |
Tips and Best Practices
Higher timeframes produce better signals. H4, D1, and W1 divergences are more reliable than M5 or M15 divergences. The noise-to-signal ratio decreases dramatically as you move to higher timeframes. Use lower timeframes for scalping setups where you expect quick moves.
Match divergence type to market condition. Regular divergences work best at support/resistance levels in ranging or exhausting markets. Hidden divergences work best during pullbacks within established trends. Using the wrong type in the wrong condition leads to losses.
OBV and VWMACD reveal what price alone cannot. Volume-based oscillators can detect institutional accumulation or distribution. A divergence between price and OBV often precedes a significant move because it reveals that large players are positioning against the visible price direction.
Use the Age column to prioritize. Signals that are 1-3 bars old have the most remaining potential. Signals that are 10+ bars old may have already played out. When multiple signals appear, focus on the freshest ones first.
Avoid trading divergences during major news events. Economic releases create sudden volatility that can invalidate technical signals. The dashboard will continue scanning during news events, but it is good practice to wait for the dust to settle before acting on a signal.
Multi-oscillator cross-validation is your edge. If RSI, MACD, and Stochastic all show divergence on the same symbol/timeframe, the convergence of multiple independent momentum measures significantly increases the probability that the signal is genuine.
Conclusion
Divergence trading is one of the most reliable methods for identifying trend reversals and continuations. The problem has never been the technique itself -- it has been the practical difficulty of scanning dozens of charts across multiple timeframes, choosing the right oscillator, and filtering out false signals.
The Divergence Dashboard solves these problems by automating the entire scanning process. It monitors up to 20 symbols across 9 timeframes, supports 10 different oscillators, validates every signal with its slope validation engine, and delivers confirmed non-repainting signals through an interactive dashboard with one-click chart navigation and 4-channel alerts.
Whether you are a day trader scanning intraday timeframes or a swing trader focused on H4 and D1 setups, the Divergence Dashboard gives you a systematic, efficient, and reliable workflow for finding high-probability divergence trades.
Download the free demo and try it on your own charts:
- MetaTrader 5: Divergence Dashboard MT5
- MetaTrader 4: Divergence Dashboard MT4
If you have questions or need help with setup, feel free to leave a comment below or reach out directly. I respond to every message.


