The Tangram is a very versatile indicator.
In this guide we will go through how the indicator does its calculations, and the types of signals it detects. Then we'll go on to see how you could use it to tailor your own strategy and use it to trade.
What is the Tangram Indicator?
Well first and foremost, the Tangram is an amalgam of 7 different oscillators. The calculations are done by normalizing all 7 oscillator values, then calculating an average of those values, to get a single compounded score that contains within it all the information provided by these 7 oscillators.
The Tangram then draws 3 types of data onto the chart:
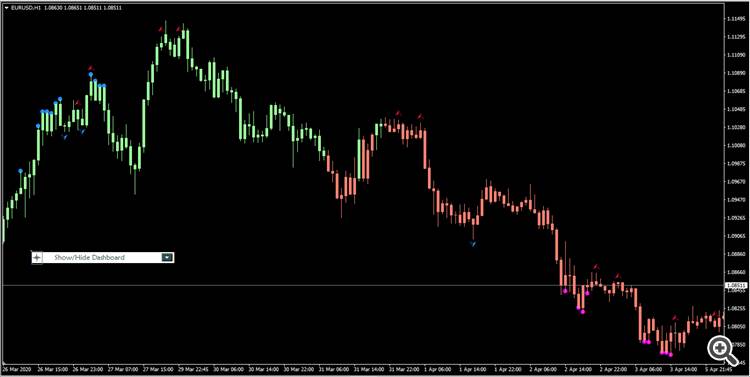
- Colored bars, which indicate the overall direction of the trend. It looks at when the compound score is above or below the average score. Green bars indicate a bullish trend, while the red bars indicate a bearish trend.
- Overbought/Oversold circles, which indicate that the compounded score is above or below the overbought/oversold level you specify in the settings. Pink circles beneath the candles indicate the price being oversold, while the blue circles above the candles indicate that price is overbought.
- Divergence Arrows, which indicate that there's a divergence between the market price and the compounded oscillator. The Red arrows above the candles indicate a bearish divergence, while the blue arrows below the candles indicate a bullish divergence. Keep in mind that divergence signals appear 2 candles before the current candle in order to avoid repainting, and to have the divergence confirm by a fractal formed on both the price and the compounded oscillator.
The Tangram could also be used to get entry signals based on those three signals above. However, it allows you to create a custom strategy in order to achieve the results you want. We'll discuss this further in a later section below.
How to trade using the Tangram Indicator?
There are two ways to use the Tangram in your trading:
- For experienced traders, knowing that Tangram is a compounded oscillator, you could use it as you would use any other oscillator, since its a substitute for 7 oscillators, and it gives you a clear view of what's happening on all of them through an easy display on the chart. Knowing when there's a compound divergence, and knowing when all oscillators confirm an overbought/oversold price, is a game changer for any trader.
- For both experienced and inexperienced traders, the Tangram allows you to pick and choose which signals you want to use for your entries, and then displays arrows on the chart at the opening of the candle where you should enter (Non-repainting). It also allows you to pick and choose your exit strategy based on the signals it provides, along with Stop Losses and Take Profits. We'll go through how you could customize you own strategy below.
What is the Dashboard for, and how to use it to create a strategy?
So as mentioned before, Tangram allows you to create a strategy by choosing your desired entry and exit signals. The Dashboard is where all this happens.

As you could see in the picture, the dashboard is divided into two parts:
- The Bottom Part: This is where you could toggle on and off the trading strategy criteria.
First of all, to get trading signals, you would have to turn "Show Entries"On. You could also choose if you want to receive alerts when an entry signal appears. - Secondly, you have to choose entries in order to receive signals. You have 3 entry options, and 1 filter:
- Divergences: You get an entry signal when there's a divergence that appears (2 candles back).
- Overbought/Oversold: You get a signal when the indicator exits the Overbought/Oversold areas.
- Color Change: You get a signal when the bars change color.
- Color Filter: It only gives signals in the direction of the bar colors. You only get long signals on green bars, and only short signals on red bars.
- Then, you have 5 possible exits:
- Stop Loss: which you could set in pips in the space provided
- Take Profit: which you could also set in pips in the space provided
- Divergence: you exit a long trade when a bearish divergence appears, and vice versa.
- Overbought/Oversold: you exit a long trade when the indicator exits overbought area, and a short trade when it exits oversold area.
- Color Change: you exit a long trade when bars change to red, and short trades when bars change to green.
- You could also toggle to receive alerts when any of those signals appear.
- The Top Part: This is where you get instant backtesting results of the strategy you have chosen.
- First, you see the date when the backtesting starts. You define this in the indicator input settings, but it's also limited by how far your chart history goes back.
- Second, you will see the profit your strategy made, in pips. Keep in mind that the spread is taken into account to achieve a very realistic result. You set the spread in the input settings of the indicator.
- Then you could see the number of winning trades, followed by the number of total trades, and the winning percentage which is calculated from these two former values.
- The Profit factor, which is the same ratio you get from the strategy tester (Gross Profit/Gross Loss)
- Finally, you get the maximum drawdown that the strategy achieved. Keep in mind that this is a Balance Drawdown, and not an Equity Drawdown.
You could always show/hide the dashboard by clicking on the arrow to the right of the white bar. You could also move the bar and dashboard by dragging the cross which is on the left side of the white bar.
Please note that all dashboard changes won't work when you're offline, or if the market is closed. The on-chart visual functions update on every tick, so when there are no ticks, nothing will be updated. When this is the case, you could always set all the parameters in the input settings of the indicator.
What are all those extra lines that appear on the chart when you switch "Show Entries" on?
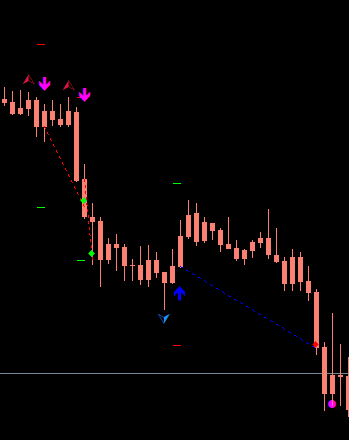
Whenever you toggle the "Show entries" function, you will see arrows on the chart which indicate an entry signal.
You will also see two dashes above and below every entry arrow, and these are the Stop Loss and Take Profit prices which are placed according to your SL and TP settings. The green dash is for TP, and the red dash is for SL.
Also, for every entry signal that appears, the indicator checks if that trade would have been closed by now or not. If it would have been closed, the indicator draws a dotted line from the open price of the trade to the closing price (blue for long trades, red for short trades). If that trade is closed in profit, you will see a green dot at the closing price, otherwise, you will see a red dot at the close price of trades which resulted in a loss.

What are the input settings of the indicator?
The Tangram settings are devided into 6 categories.
First you will see the Oscillator Period and the Oscillator Level:
- Oscillator Period: sets the period of the compounded oscillator.
- Oscillator Level: sets the top level above which we consider the price to be overbought. The bottom oversold level is calculated symmetrically according to the overbought level (example: if you set the Level at 70, you get overbought signals when the value is above 70, and oversold signals when it's below 30)
![]()
Then you will see the "Entries" Category: (All these settings could be changed from the dashboard)
- Show Entries: set to true, if you want to get entry signals and see previous entries. (note that if the next 3 parameters below are set to false, you still won't see any signals)
- Enter at Divergence: if set to true, you get an entry signal at divergences.
- Enter at Color Change: if set to true, you get an entry signal when the bars change color.
- Enter at Exit from Overbought/Oversold area: if set to true, you get an entry signal when price exits an Overbought/Oversold area.
- Entry Color Filter: if set to true, you only get signals in the direction of the bar colors. You only get long signals on green bars, and only short signals on red bars.

Then you will see the "Exits" Category: (All these settings could be changed from the dashboard)
- Stop Loss in Pips: set the stop loss in number of pips. Set to 0 to disable stop loss (not recommended)
- Take Profit in Pips: set the take profit in number of pips. Set to 0 to disable take profit.
- Exit at Divergence: if set to true, the indicator will calculate entries as exiting at opposite divergence signals.
- Exit at Color Change: if set to true, the indicator will calculate entries as exiting at color change to opposite bar color.
- Exit at Exit from Overbought/Oversold area: if set to true, the indicator will calculate entries as exiting as price exits overbought/oversold area.

The "Backtest" category:
- Backtesting Start Date: If the case where you have "show entries" enabled, this let's you set the start date of when you want the indicator to start tracking the results of your strategy. If this date is older than the oldest date on your chart, the oldest chart date is used instead.
- Spread: Set the spread in pointsto be used by the indicator when calculating the backtesting results of your strategy.

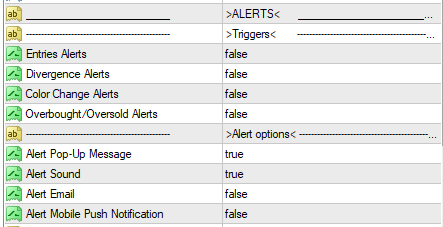
The "Alerts" category Allows you to choose which signals you want to get alerts for, as well as the types of alerts you want to receive.

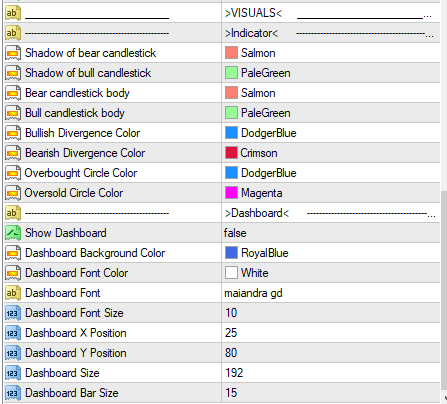
The "Visuals" category gives you some control over how the indicator looks. You could change the colors of the bars, overbought/oversold circles, and the divergence arrows. You could also change how the dashboard looks under the "Dashboard" subcategory. You could enable "Show panel" in the settings whenever you are offline or when the markets are closed so you could see the dashboard

Reminder to update your version. Updates are free.
Specials New Release
Discount !
Profit
now with a lower price. Limited time offer.
Original 1-Year Rent Price: 30$
Discounted Price: 15$
Original 3-Months Rent Price: 50$
Discounted Price: 29$
Get It Here: The Tangram Indicator
Write an honest review of the indicator
and send me a proof of purchase to tangramindicator@gmail.com
and get a free Tangram Optimizer and Tangram EA
that helps you find the best settings to use for each currency and timeframe


