How to Trade ICT Suspension Blocks Correctly (The "Golden" Confluence Strategy)

If you trade using Smart Money Concepts (ICT), you are likely obsessed with Order Blocks and Fair Value Gaps. But there is a hidden gem in price action that many traders overlook: The Suspension Block.
In this article, I will explain what a Suspension Block is, why most traders fail using them, and the "Golden Secret" to filtering out 80% of false signals.
1. What is a Suspension Block?
A Suspension Block is a specific 3-candle formation that indicates a momentary pause in institutional order flow before a continuation or reversal. Unlike a standard Order Block which is often just the "last down candle," a Suspension Block involves specific price gaps between the open and close of consecutive candles. It represents a zone where price is "suspended" and is highly likely to be revisited.
-
Bullish Scenario: Price rallies, leaving a specific gap structure. When price returns to this zone, we expect a violent reaction upward.
-
Bearish Scenario: The opposite occurs for selling opportunities.
2. The Problem: Why do they fail?
If you open any chart (e.g., M15 or M5), you will see dozens of potential blocks. If you try to trade all of them, you will blow your account. The market is full of noise. A block on M5 might look good, but if it contradicts the H1 or H4 structure, it will get smashed.
3. The Solution: The "Golden" Overlap Rule 🟡
This is the game-changer. The secret to high win-rate setups is Multi-Timeframe Confluence.
You should only trade a Suspension Block if it exists inside or overlaps with a block from a Higher Timeframe (HTF).
-
Weak Zone: A block that only exists on M15.
-
Golden Zone: An M15 block that overlaps perfectly with an H1 block.
When these two align, we call it a "Golden Block". These zones act like magnets for price and hold significant institutional orders.

4. The Strategy: How to Trade It
Here is a simple step-by-step framework to trade these zones:
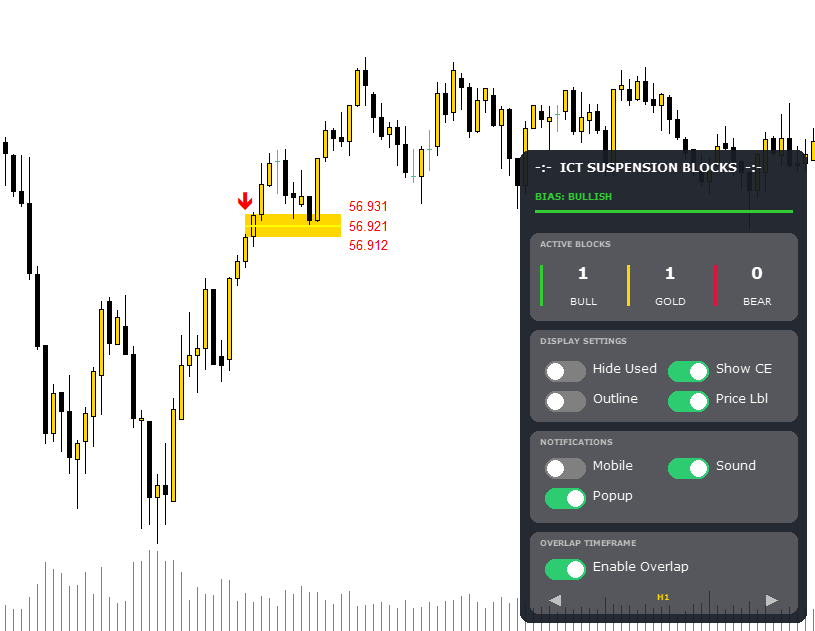
Step 1: Identify the Bias Before looking for blocks, ask yourself: Is the market Bullish or Bearish? You can determine this by looking at the H4 structure or using a dashboard tool.
Step 2: Wait for the "Golden" Setup Do not trade every green or red box you see. Wait for a Golden Block to form in the direction of your bias. This confirms that the higher timeframe supports your trade.
Step 3: The Entry (Sniper Mode) Place your Limit Order at the edge of the block. For even higher precision (and tighter Stop Loss), use the CE Line (Consequent Encroachment), which is the exact 50% midpoint of the block.
Step 4: Invalidation If a candle body closes below a Bullish block (or above a Bearish one), the setup is invalid. Get out. Do not hope.
5. Manual vs. Automated
You can train your eyes to spot these 3-candle patterns and then manually check the H1/H4 charts for overlap. It works, but it is time-consuming and prone to human error.
To solve this, I developed a tool called ICT Gold Sweeper. It automatically detects these patterns and runs a background scan on higher timeframes. If it finds an overlap, it automatically turns the block GOLD 🟡 so you know exactly where to trade.
Conclusion
Stop trading every support and resistance level. Focus on Quality over Quantity. By filtering your trades using the Golden Overlap rule, you align yourself with the "Smart Money" flow.
Want to try this strategy on your chart?
🚀 Download the Basic Version (Free): [ICT Suspension Blocks FREE]
💎 Get the Full "Gold Sweeper" System (with Golden Overlap & Alerts): [ICT Gold Sweeper PRO]
🎁 LOYALTY REWARD UPDATE🎁
To celebrate the launch of the automated version, I have gifted the ICT Gold Sweeper EA (Worth $149) to all my previous customers for FREE!
If you purchased this indicator before the launch and haven't received your gift yet, please send me a private message here on MQL5.


")
