Get the News Filter Tool here
No demo version available. EA does not work in the strategy tester.
News Tool EA Use Cases and Benefits
Unlock the full potential of your trading strategy with the News Tool EA. Below are the most impactful use cases that demonstrate how the News Tool solves critical trading challenges:
1. Mitigate Risk During High-Impact News Events
- Problem: Sudden volatility during high-impact news events can lead to significant losses, especially when automated trading systems execute trades unaware of impending market shifts.
- Solution: The News Tool EA automatically manages your other Expert Advisors (EAs) by pausing them before specified news events and reactivating them afterward.
- Benefit: Protects your capital by preventing unwanted trades during volatile periods, ensuring your automated strategies don't suffer unexpected losses.
2. Analyse Historical Price Reactions to News Events
- Problem: Without insights into past market reactions to news, traders struggle to predict how current events might affect prices.
- Solution: The News Tool provides detailed historical data showing how price has reacted to specific news events, including whether the outcome was bullish or bearish.
- Benefit: Informs your trading decisions by revealing patterns and tendencies in market reactions, allowing you to anticipate potential movements and adjust your strategy accordingly.
3. Identify Events with the Greatest Market Impact
- Problem: Traders often waste time monitoring numerous news events without knowing which ones truly affect their trading instruments.
- Solution: The EA ranks news events based on their average impact on your selected symbols, highlighting those that historically cause significant price movements.
- Benefit: Optimizes your focus on the most impactful events, maximizing trading opportunities and improving efficiency.
4. Receive Timely Alerts for Critical News Releases
- Problem: Missing important news events due to lack of timely notifications can result in missed opportunities or unexpected market exposure.
- Solution: Set up customizable alerts for specific events, importance levels, or currencies, receiving notifications via pop-up or mobile alerts before events occur.
- Benefit: Keeps you informed and prepared, enabling you to take proactive measures before the market reacts.
5. Visualize News Events on Trading Charts
- Problem: It's challenging to correlate price movements with news events when they aren't visually represented on your charts.
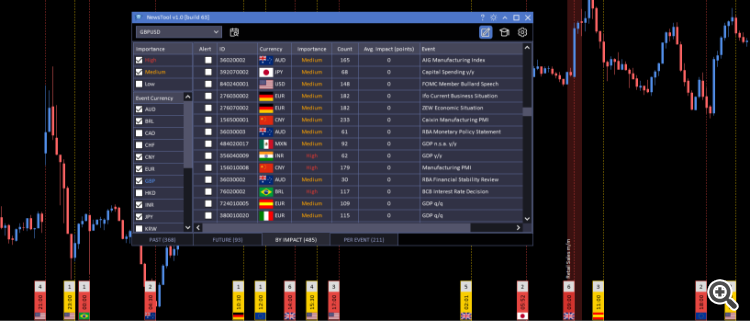
- Solution: The News Tool plots news events directly onto your MT5 charts, using color-coded lines based on importance and displaying event details.
- Benefit: Enhances your situational awareness by providing immediate visual context, making it easier to interpret and respond to market movements.
1.Introduction
The News Tool is an advanced Expert Advisor for MT5 that integrates with the MetaQuotes Economic Calendar to provide real-time news event analysis. It helps traders manage and analyze the impact of news events on various financial instruments, allowing for informed decision-making and strategic planning. The tool offers features such as event filtering, impact analysis, and the ability to manage other EAs around news events.
2. Header Bar
The header bar at the top of the News Tool window provides quick access to essential functions and settings.
2.1 Symbol Selector
- Description: A dropdown box that allows you to select the symbol or instrument for analysis.
- Functionality:
- Lists all symbols available in the Market Watch window.
- Selecting a symbol updates the analysis throughout the News Tool.
- Usage:
- Click the dropdown arrow to open the list.
- Scroll or type to find the desired symbol.
- Click on the symbol to select it.
2.2 Analyse Button
- Description: A toggle button that controls the analysis of events.
- Functionality:
- On: Enables automatic calculation of values in the "By Impact" and "Per Event" tabs when changing event filter options or selecting specific events.
- Off: Disables automatic calculations, allowing for faster navigation without loading data.
- Usage:
- Click the "Analyse" button to toggle between On and Off.
- Recommended to keep it Off when navigating, and turn it On when ready to perform analysis.
2.3 Draw Events Button
- Description: A toggle button that controls the display of news event lines on the chart.
- Functionality:
- On: Displays news event lines on the chart, color-coded by importance:
- High Importance: Red
- Medium Importance: Orange
- Low Importance: White
- Aggregates nearby events into a single line on higher timeframes.
- Each event line includes:
- A rectangle showing the time of the highest priority event.
- A number indicating the count of aggregated events (clicking opens a detailed list).
- A flag representing the country of the event's origin.
- On: Displays news event lines on the chart, color-coded by importance:
- Usage:
- Click the "Draw Events" button to toggle the display.
- Click on the lines for more details.
2.4 Algo Manager Button
- Description: Opens the Algo Manager for managing other EAs.
- Functionality:
- Allows you to set parameters for removing and reapplying other EAs around news events.
- Usage:
- Click the "Expert Window" button to open the window.
3. Algo Manager
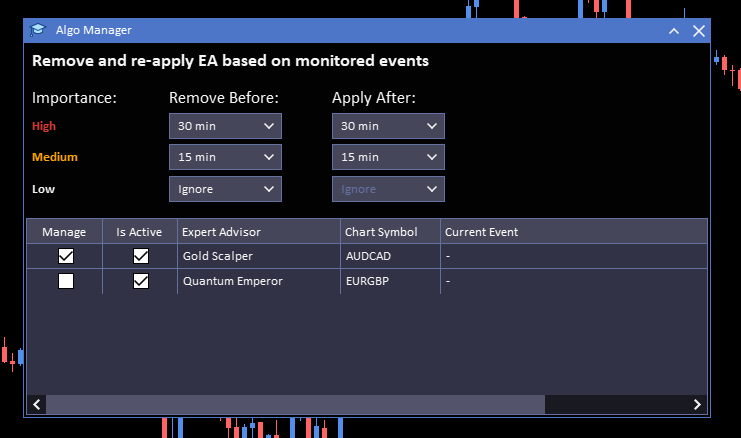
3.1 Managing Other EAs
- Remove and Reapply EAs:
- Set time intervals for removing EAs before and reapplying them after news events.
- Time intervals are adjustable for High, Medium, and Low importance events.
- Settings:
- Remove Before: Choose when to remove the EA before an event (e.g., "5min", "10min", "15min", "Ignore").
- Apply After: Choose when to reapply the EA after an event (e.g., "5min", "10min", "15min", "Ignore").
- Selecting "Ignore" means no action will be taken for that setting.
- EAs Table:
- Columns:
- Manage: Checkbox to include the EA in the News Tool's management.
- Is Active: Indicates if the EA is currently applied.
- Expert Advisor: Name of the EA.
- Chart Symbol: The symbol on which the EA is running.
- Current Event: Shows if a filtered event is currently occurring for that chart.
- Columns:
- Usage:
- Set the desired time intervals for each importance level.
- Check the "Manage" box for each EA you wish the News Tool to control.
- The News Tool will automatically remove and reapply the selected EAs based on your settings.
Settings
Accessed via the Settings button, this window allows you to configure various parameters for the News Tool.
4.1 Expert Settings
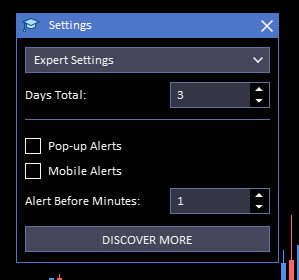
- Days Total:
- Description: Number of days of data to visualize with news lines on your chart.
- Usage: Enter the desired number of days.
- Alerts:
- Pop-up Alerts: Enable or disable on-screen notifications before events.
- Mobile Alerts: Enable or disable push notifications to your mobile device.
- Alert Before (Minutes):
- Description: How many minutes before a news event to receive an alert.
- Usage: Enter the number of minutes.
4.2 Data Settings
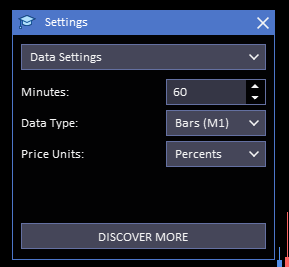
- Minutes:
- Description: Time frame evaluated before and after an event to determine its impact.
- Usage: Enter the number of minutes for pre- and post-event analysis.
- Data Type:
- Options:
- Bars M1: Uses 1-minute bars for analysis (faster but less precise).
- Ticks: Uses tick data for analysis (more precise but slower).
- Usage: Select the preferred data type.
- Options:
- Price Units:
- Options:
- Percentage: Measures impact in percentage terms (useful for comparing different instruments).
- Points: Measures impact in points.
- Usage: Select the unit for displaying impact data.
- Options:
Main Tabs
The News Tool interface is divided into four main tabs, each providing specific functionalities.
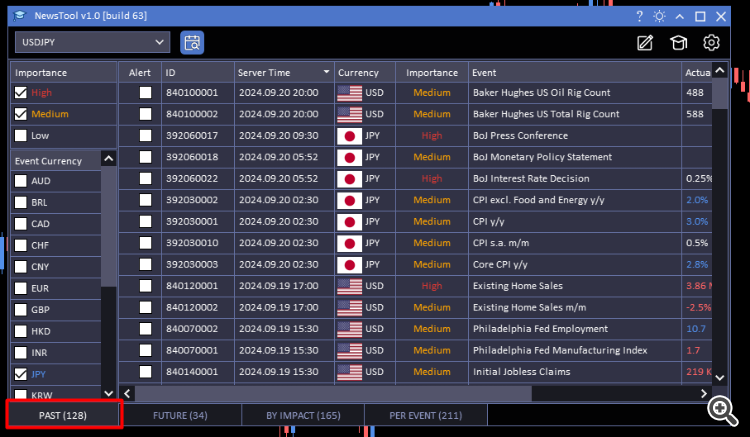
5.1 Past Events Tab
Displays a list of past news events for analysis.
5.1.1 Filters
- Importance:
- Checkboxes for High, Medium, and Low importance events.
- Usage: Select the levels of importance to include.
- Event Currency:
- Checkboxes for various currencies (e.g., USD, GBP, AUD).
- Usage: Select the currencies to include.
5.1.2 Events Table
- Columns:
- Alert: Checkbox to subscribe to alerts for future occurrences of the event type.
- ID: Unique identifier for the event.
- Server Time: Date and time when the event occurred.
- Currency: Currency associated with the event.
- Importance: Importance level of the event.
- Event: Name of the event.
- Actual: Actual data released.
- Previous: Data from the previous release.
- Revised: Any revisions to previous data.
- Forecast: Predicted data before the release.
- Usage:
- Click on an event to select it for detailed analysis.
- Use the Alert checkbox to receive notifications for future events.
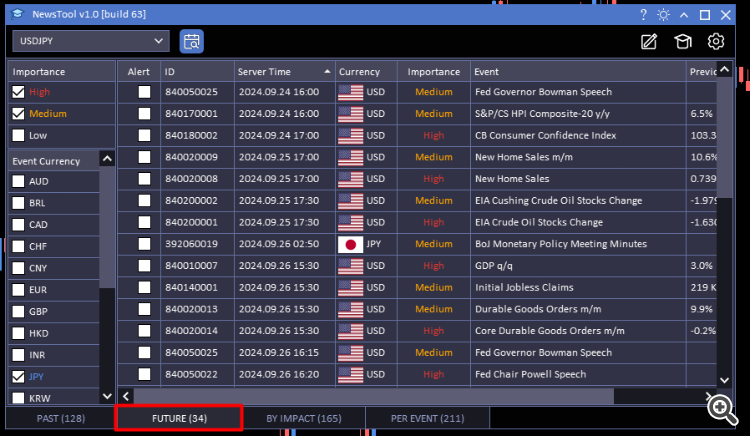
5.2 Future Events Tab
Displays upcoming news events to help you prepare for potential market movements.
5.2.1 Filters
- Same as Past Events Tab: Use Importance and Event Currency filters to customize the event list.
5.2.2 Events Table
- Same as Past Events Tab: Contains similar columns and functionalities.
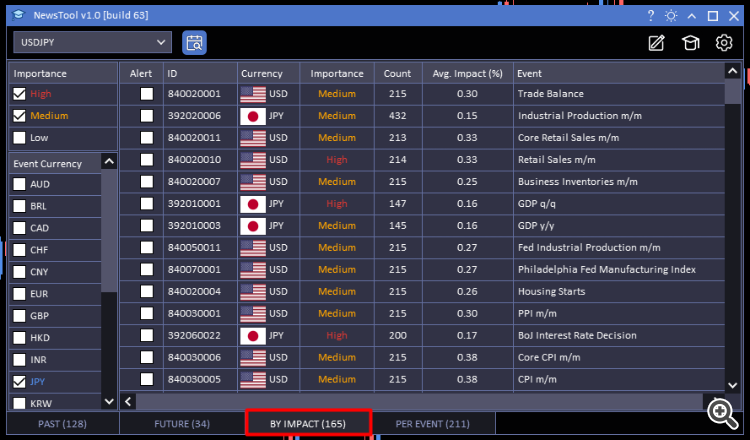
5.3 By Impact Tab
Ranks events based on their average impact on the selected symbol.
5.3.1 Filters
- Importance: Select the importance levels to include.
- Event Currency: Select the currencies to include.
5.3.2 Events Table
- Columns:
- Alert: Subscribe to alerts for the event type.
- ID: Unique identifier for the event.
- Currency: Currency associated with the event.
- Importance: Importance level.
- Count: Number of times the event has occurred.
- Avg. Impact (Points/Percent): Average impact on the symbol, calculated based on settings.
- Event: Name of the event.
- Usage:
- Events are listed in order of average impact.
- Click on an event to select it for further analysis.
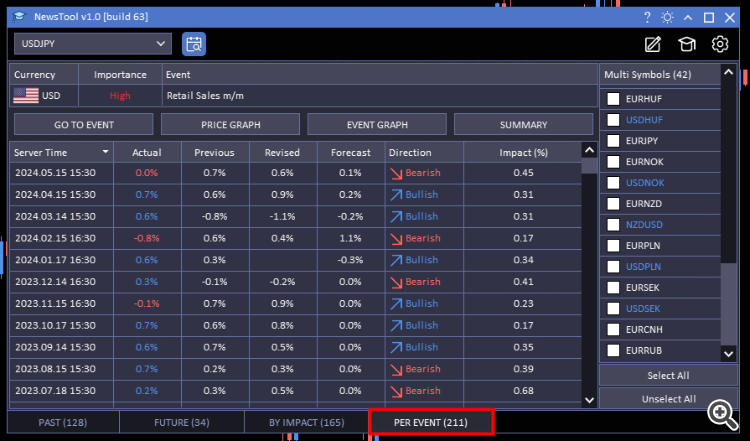
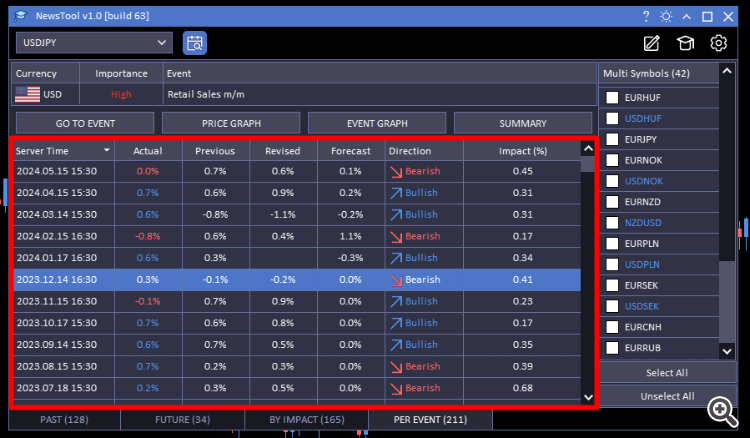
5.4 Per Event Tab
Provides detailed analysis for a selected event.
5.4.1 Selected Event Details
- Displayed Information:
- Currency: Currency associated with the event.
- Importance: Importance level.
- Event Name: Name of the event.
5.4.2 Action Buttons
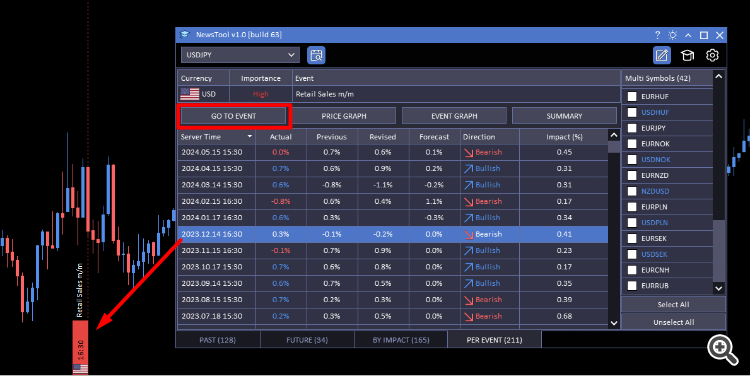
- Go to Event:
- Price Graph:
- Description: Opens a window displaying the price movement centered around the event time.
- Usage:
- Click to open the graph.
- Use the Multi Symbols section to compare multiple instruments.
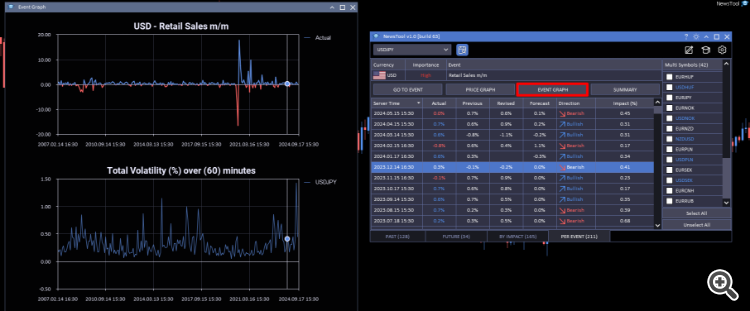
- Event Graph:
- Description: Shows two graphs—published figures over time and total volatility.
- Graphs:
- Top Graph: Actual, Forecast, Previous, and Revised data over time.
- Bottom Graph: Total volatility in percentage or points.
- Usage: Click to open and analyze the relationship between event data and market impact.
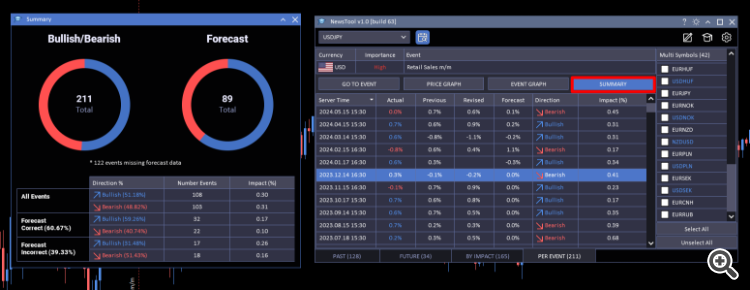
- Summary:
- Description: Provides an overview of the event's historical impact.
- Includes:
- Bullish/Bearish Donut Chart: Percentage of times the event resulted in bullish or bearish movements.
- Forecast Donut Chart: Accuracy of forecasts in relation to actual outcomes.
- Table: Breakdown of impacts based on forecast accuracy.
- Usage: Click to view summarized data for strategic insights.
Above: Go to event button.
Above: Price graph.
above: event graph.
above: Summary window
5.4.3 Events Table
- Columns:
- Server Time: Date and time of each event occurrence.
- Actual: Data released.
- Previous: Data from the previous release.
- Revised: Revisions to previous data.
- Forecast: Predicted data.
- Direction: Indicates whether the event had a bullish or bearish impact.
- Impact (%/Points): Magnitude of the impact.
- Usage:
- Review historical data for the selected event.
- Click on rows to highlight data in graphs.
Multi Symbols Section
Allows you to analyze the impact of events across multiple instruments.
- Location: Right-hand side of the "Per Event" tab.
- Features:
- Instrument List: Displays all symbols from the Market Watch.
- Select All: Button to select all instruments.
- Unselect All: Button to deselect all instruments.
- Usage:
- Check the boxes next to the instruments you want to include.
- Selected instruments will appear in the Price Graph and Event Graph for comparative analysis.
Conclusion
The News Tool is a powerful EA that enhances your trading by providing detailed insights into how news events affect the markets. By utilizing its features, you can:
- Manage Other EAs: Control the operation of other EAs during periods of high volatility.
- Analyze Historical Data: Understand past market reactions to news events.
- Prepare for Future Events: Anticipate potential market movements.
- Customize Alerts and Settings: Tailor the tool to your trading style and preferences.
Leverage this guide to fully utilize the News Tool and make informed trading decisions.
For more resources and other MT5 tools checkout our website:
https://algotradingpros.com/

