

TakePropips Donchian Trend Pro is a powerful and effective tool that automatically detects the direction of the trend using the Donchian Channel and provides you with an entry and exit trading signals!
This multi-function indicator includes a trend scanner, trading signals, statistical panel, screener, trading sessions, and alerts history dashboard. It is designed to provide you with trading signals and save you hours analyzing the charts!
The TakePropips Donchian Trend Pro indicator works on all Forex pairs, Metals, Commodities, Indices, and Crypto.
Purchase, rent, or download strategy tester demo here: https://www.mql5.com/en/market/product/60494
Main Features
Trading Signals - detects buy & sell opportunities on all pairs across multiple timeframes. It will provide you with alerts and plot the trading signals on the chart with up to 3 take profit and a stop loss price.
Trend Scanner - used to quickly scan and identify the trend direction of each pair across multiple timeframes. The trend scanner shows color green for uptrend and color red for downtrend. The numbers inside the box represents the success rate of the signals.
Dynamic Take Profit & Stop Loss - the TP and SL targets will always adapt to the current market conditions based on volatility and support/resistance levels. It is better than having a fixed target for TP and SL. By default, the TP is based on current volatility (ATR) and the SL is based on current support/resistance level.
Trade Signals Dashboard - shows the trade direction, entry price, up to 3 TP levels, SL, success rate, and total profit of each pair so you know exactly the result of each trading signals.
· Trade Signal Metrics - Comprehensive trade signal metrics, including profit factor, expected payoff, success rate, total profit, performance rating, and average win/loss analysis.
Technical Data Panel - shows the data of RSI, Stochastic, MACD, Moving Averages, Spreads, and a timer countdown for the next candle.
Screener - shows technical data for each pair across all timeframes using various technical indicators such as RSI, Stochastic, MACD, Moving Average, CCI, WPR, ATR, and Momentum indicator. This can be used as part of your technical analysis or confirmation before entering a trade.
Trading Market Sessions - automatically identify the trading session of each candlesticks and its range from sessions high to sessions low on the chart. The trading sessions are London, New York, Tokyo, and Sydney Sessions.
Notifications History - shows you the most recent history of trading signal alerts sent out by the trading system. You can also filter the alerts by date and pairs.
MT4 Alerts, Email, and Phone Notifications - receive alerts when a new buy or sell signals are identified so you never miss another trading opportunity. The alerts includes the pair name and timeframe the signal was generated, trade direction (buy or sell), win rate, entry price, SL, TP1, TP2, and TP3.
Trend Scanner Data - you can modify the data shown on the trend scanner boxes. By default, it will show the win rate of the trade signals on the trend dashboard scanner.
Accurate Trading Signals - the signals generated by the indicator are highly accurate and precise. The Donchian Trend Pro strategy is tested and verified to work in the current market conditions.
Non-Repainting Signals -the signals are never repainted or back-painted.
Average Daily Range (ADR) - shows the ADR of each pair on the dashboard which can be used to determine the volatility of each pair.
Range Meter - used to determine the strength and weakness of the current price of each pair relative to the highs and lows of its current daily bar.
Chart Screenshot - quickly take a screenshot of the current chart.
Customizable Dashboard - you can customize the size of the dashboard and change its colors and theme based on your own personal preference.
Hotkeys - convenience of interacting with the dashboard using keyboard shortcuts.
Trading Signals Dashboard

The Trading Signals Dashboard displays important information regarding the current trend of the market and the trading signal statistics of the current pair and timeframe on the chart.
Trend Scanner Dashboard

The Trend Scanner is used to quickly scan and identify the trend direction of each symbol in their respective timeframes. Color green means uptrend and color red means downtrend. By default, the number inside the box represents the current success rate of that particular symbol/timeframe. You can however change the data shown on the trend scanner by clicking the “Trend Scanner Data” on the main dashboard of the trading system.
An overall summary is also provided to determine whether this currency pair is in a strong trend or not. A strong buy or strong sell signals will appear if multiple timeframes on each symbol are in the same trend direction.
Multi-Timeframe Analysis can also be used as a way to determine a strong trend. If the lower timeframes and the higher timeframes are in the same trend direction (same color), then it means the symbol is in a strong trend.
Range column is used to determine the strength and weakness of the current price relative to the highs and lows of the current daily candle. If the current price is near or at its daily high, then the meter will show more as green. If the current price is near or at its daily low, then the meter will show more as red.
Average Daily Range (ADR) can be used to measure the volatility of an asset.
Please note that the Spread and ADR are calculated by points, and not pips. E.g., 10 pips = 100 points
Trade Signals Dashboard

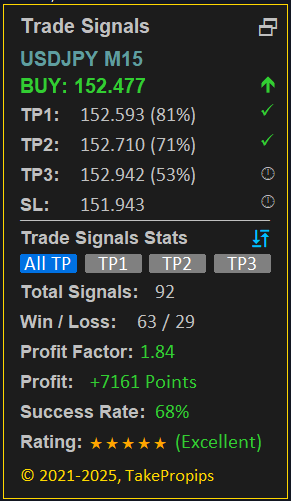
The Trade Signals Dashboard shows the current trading signal for a specific symbol and timeframe. In the example above for EURGBO H1 timeframe, the current signal is a BUY signal. It provides you with entry price, up to 3 take profit level, and a stop loss price.
The percentage besides the prices of each TP represents the success rate for that particular TP. If the price has already reached the take profit, it will show a checkmark.
Total Signals shows the total number of wins and loss combined.
Win / Loss shows the total number of winning trades that have reached at least the TP1 compared to reaching its stop loss. Wins and loss are only counted once per trading signal. It does not count TP2/TP3.
Last Signal Age shows the position of the bar for the most recent trading signal. From the example above, the last trading signal was generated on the previous 20 bar or the past 20 hours since its on H1 timeframe and each bar represents 1 hour.
Profit shows the total number of points generated through wins and losses of the trading signals. Please note that the profit is counted only once using a partial close system and one position only. Example, if the prices hit all TP targets, then it will only count the profit of TP3 and it will not add TP2 and TP1 profits. If the stop loss is hit, the loss is counted only once since we are only working on one position.
Success Rate shows the winning percentage of reaching TP1.
Rating shows the quality of the current signal based on its success rate.
The Trade Signals Dashboard shows the current trading signal for a specific symbol and timeframe. In the example above for EURJPY H1 timeframe, the current signal is a BUY signal. It provides you with entry price, up to 3 take profit level, and a stop loss price.
The percentage besides the prices of each TP represents the success rate for that particular TP. If the price has already reached the take profit, it will show a checkmark.
Total Signals shows the total number of wins and loss combined.
Win / Loss shows the total number of winning trades that have reached at least the TP1 compared to reaching its stop loss. Wins and loss are only counted once per trading signal.
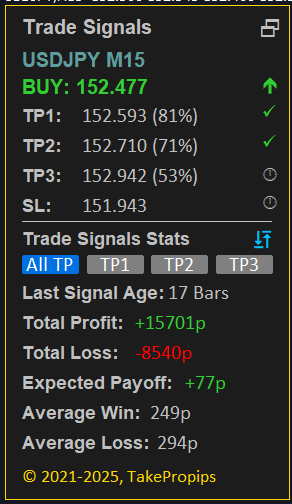
Last Signal Age shows the position of the bar for the most recent trading signal. From the example above, the last trading signal was generated on the previous 24 bar or the past 24 hours since its on H1 timeframe and each bar represents 1 hour.
Profit shows the total number of points generated through wins and losses of the trading signals. [Net Profit = Total Profit – Total Loss].
Success Rate shows the winning percentage of the selected TP target. If its “All TP”, then it will be the average win rate of all TP targets. [Winning Percentage = (Total Wins / (Total Wins + Total Losses)) * 100]
Rating shows the quality of the current signal based on its profit factor.
Profit Factor indicates the ratio of profit earned for every point lost. [Profit Factor = Total Profit / Total Loss].
Expected Payoff – calculates the average amount of profit (or loss) expected per trade in points. [Expected Payoff = Net Profit / (Total Wins + Total Losses)]
Total Profit – calculates the total profit in points gained from all winning trades. [Total Profit = Sum of all profits]
Total Loss – calculates the total loss in points gained from all losing trades. [Total Loss = Sum of all losses]
Average Win – calculates the average profit in points per winning trade. [Average Win = Total Profit / Total Wins]
Average Loss – calculates the average loss in points per losing trade. [Average Loss = Total Loss / Total Losses]
Automated Entry & Exit Signals

This program will scan and detect trading signals on each symbol for all timeframes and shows you the entry and exit signals directly unto the chart. It will provide you with take profit and stop loss level.
You can easily scan the history of signals from the chart and identify if the current strategy is working well for that specific symbol / timeframe.
The signals are never repainted or back painted.
Buy signals are shown in green arrows and sell signals are shown in yellow arrows.
The numbers on the chart represents the total number of points in profit or loss. E.g., If it shows +250, then it means the price has reached its target of 250 points or 25 pips.
Technical Data Panel

The Technical Data panel shows the data of popular indicators such as RSI, Stochastic, MACD, and Moving Averages and these can be used as a confirmation for your entries. It will also show the current spreads, price data, and a timer countdown for the next bar. The values shown on this panel are calculated using the current charts pair and timeframe.
This panel shows technical data of:
- Spread shows the current spread of the pair. The value is shown in pips.
- Next Bar shows the countdown timer for the next bar of the current chart.
- RSI shows the value of RSI for the current chart.
- Stochastic shows the value of Stochastic for the current chart. It will show an UP arrow if the fast stochastic (%K line) is above the slow stochastic (%D line) and it will show a DOWN arrow if the fast stochastic (%K line) is below the slow stochastic (%D line).
- MACD shows the value of MACD for the current chart. It will show an UP arrow if the MACD line is above the signal line and a DOWN arrow if the MACD line is below the signal line.
- 50 EMA / 200 EMA shows whether the current price is above or below these moving averages. If will show an UP arrow if the current price is above the moving average and a DOWN arrow if the current price is below the moving average. You can customize the moving average period on input settings..
You can click the switch icon on the top right corner of the panel to show the price data of the current chart which shows the high, low, open, close, and change %.
By default, the technical data and price data are calculated using the current bar. This can be changed to the previous bar on the input settings if you prefer to calculate data on a finished bar..
Advanced Screener Management

The Advanced Screener Management shows technical data of various technical indicators and symbol information of all pairs on the dashboard across multiple timeframes.
You can switch the data shown on the panel by clicking the “Symbol Info” or the “Technical” button.
You can also switch the timeframe in which the technical data is calculated. E.g., If you have technical column selected and you selected to a different timeframe, then the value shown for the technical indicators will be based on that selected timeframe.
To open the Advanced Screener Management panel, you can click the “Screener” button on the main dashboard.
Notifications History

Notifications History shows you the most recent history of trading signal alerts sent out by the trading system. Even if you miss out the alerts sent out to MetaTrader or your phone, you can check on this dashboard to see a full list of alert messages that was generated.
You can enable or disable the notifications directly on this on this dashboard.
You can filter the result by date and pairs. You can also sort the columns in ascending or descending order by clicking the column name that has the up/down arrow besides it. The Filter by Date field will filter the “Alert Time” data.
Forex Trading Sessions

The Trading Market Session feature will automatically draw dotted rectangles which identifies the trading session of the candlesticks. The trading sessions are London, New York, Tokyo, and Sydney sessions.
The number besides the trading session name is the total range of points from the sessions low to sessions high. You can use it to determine the volatility of a specific trading session based on this range. Larger range means it is more volatile and lower range means its less volatile.
Trend Scanner Data

You can change the data shown on the scanner by clicking the “Trend Scanner Data” button on the main dashboard.
This will allow you to toggle between 8 different options:
- Success rate shows the current success rate of a pair for each timeframe.
- Last Signal Bar Age shows the age in candlesticks for the last buy/sell signal generated.
- Rating shows the total rating / performance of the trading signals.
- Total Signals shows the total number of trading signals generated.
- Total Wins shows the total number of wins generated.
- Total Loss shows the total number of losses generated.
- RSI shows the current value of the RSI on that particular pair/timeframe.
- Stochastic shows the current value of the Stochastic on that particular pair/timeframe.
You can hover over the buttons on the scanner and it will explain to you the description of the data shown on the scanner.
Trading Signals Alerts

You will receive alerts for new signals on all symbols on the dashboard. You can specify which timeframes you want to get signals alert by modifying the settings.
You can toggle these alerts on/off depending on your preference.
By default, the alerts for M1 and M5 timeframes are disabled. You can enable these by changing the input settings of the indicator.
You can setup push notifications to your mobile phone and also via email.
You can download the attached FAQ, Input Settings, and User Manual PDF for more detailed explanation.
You can test the TakePropips Donchian Trend Pro on the strategy tester or you can request a free trial to test on live charts by private message.
Purchase, rent, or download strategy tester demo here: https://www.mql5.com/en/market/product/60494


")