
Introducing The Advanced Candle Range Theory Indicator for MT4/MT5
30 January 2026, 10:12

0
1 117
Introducing the Advanced Candle Range Theory Indicator for MT4/MT5
MT5 -> [Advanced CRT Indicator MT5]
MT4 ->[Advanced CRT Indicator MT4]
━━━━━━━━━━━━━━━━━━━━━━━━━━━━━━━━━━━━━━━━━━━━━━━━━━━━━━━━━━━━━━━━━━━━━
THE FUTURE OF PRICE ACTION TRADING IS HERE
Are you tired of manually marking ranges on your charts? Missing critical breakouts while you sleep? Struggling to identify Fair Value Gaps consistently?
The wait is over.
Today, we're excited to introduce the Advanced Candle Range Theory (CRT) Indicator - a professional-grade tool that automates the entire CRT methodology and brings institutional-level analysis to your MetaTrader platform.
━━━━━━━━━━━━━━━━━━━━━━━━━━━━━━━━━━━━━━━━━━━━━━━━━━━━━━━━━━━━━━━━━━━━━
WHAT IS CANDLE RANGE THEORY?
Before we dive into the indicator, let's understand the methodology behind it.
Candle Range Theory (CRT) is a powerful price action concept that focuses on:
• Consolidation Ranges: Periods where price moves sideways, building energy
• Breakout Points: Key levels where price breaks out of consolidation
• Directional Bias: Understanding market sentiment through candle structure
• Target Projection: Calculating potential profit targets based on range size
Traditionally, traders would manually identify these ranges, draw lines, calculate targets, and set alerts. This process is time-consuming, subjective, and easy to miss when you're not watching the charts.
That's exactly why we built this indicator.
━━━━━━━━━━━━━━━━━━━━━━━━━━━━━━━━━━━━━━━━━━━━━━━━━━━━━━━━━━━━━━━━━━━━━
WHY THIS INDICATOR CHANGES EVERYTHING
The Advanced CRT Indicator doesn't just draw a few lines on your chart. It's a complete trading system that does the heavy lifting for you:
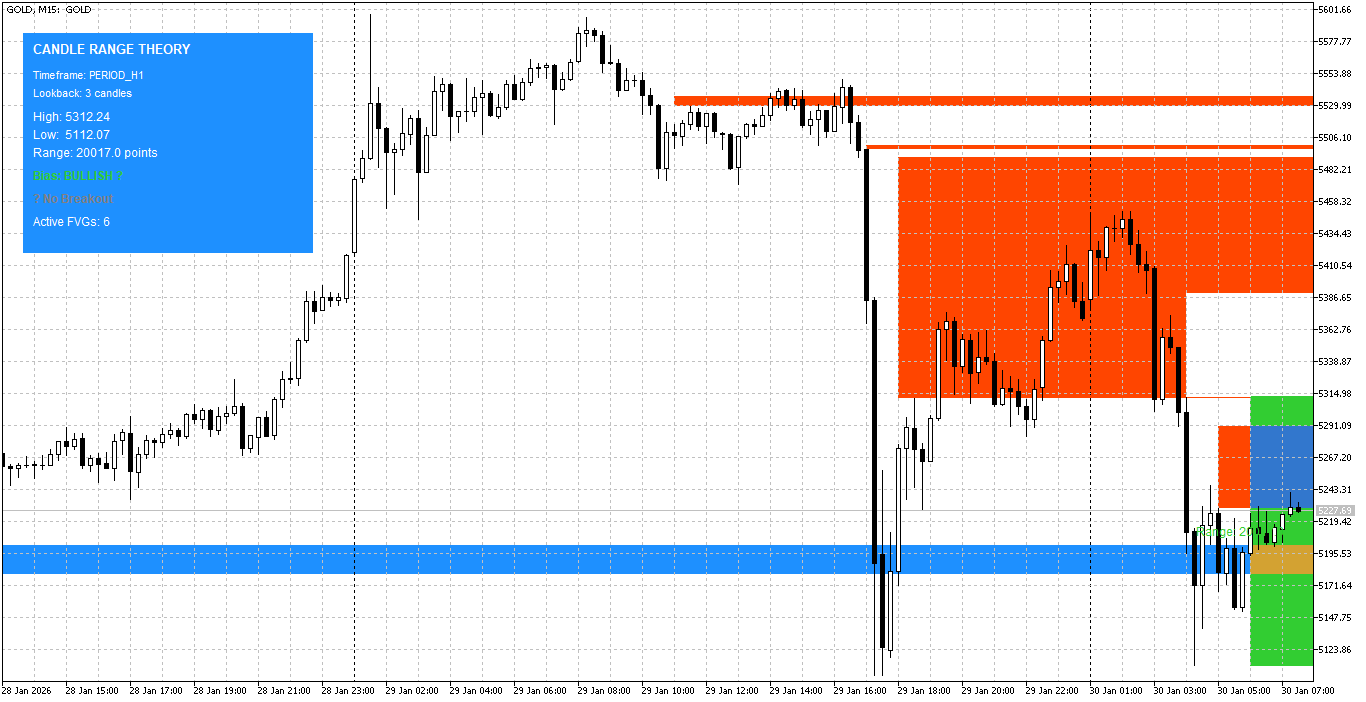
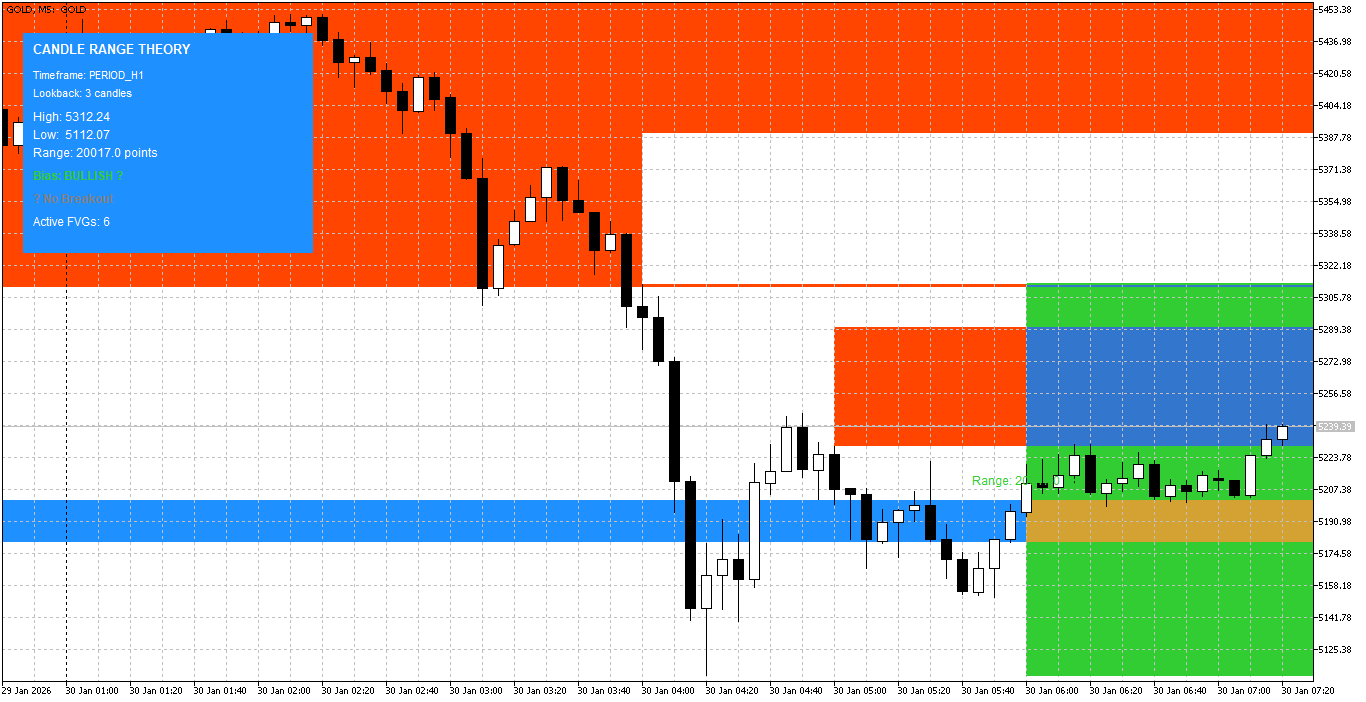
AUTOMATED RANGE DETECTION
Gone are the days of eyeballing consolidation zones. The indicator automatically identifies candle ranges based on your preferred lookback period (1-20 candles). Whether you trade the 5-minute chart or the daily, it adapts to your style.
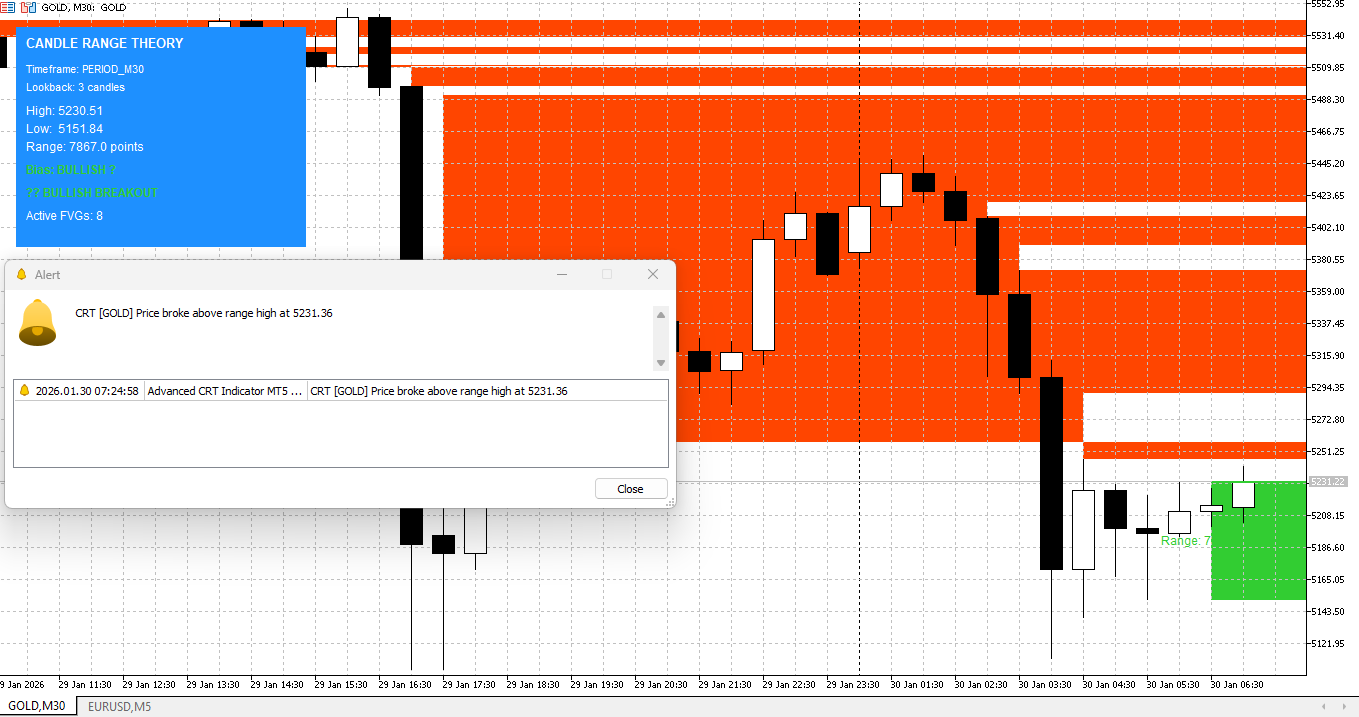
INTELLIGENT BREAKOUT TRACKING
The indicator monitors price in real-time and alerts you the moment a breakout occurs. No more staring at screens or missing opportunities. You'll know instantly when price breaks above or below the range.
FAIR VALUE GAP INTEGRATION
This is where things get really interesting. The indicator doesn't just show ranges - it also identifies Fair Value Gaps (FVGs), those inefficient price zones that institutional traders love to target. It tracks up to 200 FVGs, marks them on your chart, and even hides filled gaps automatically to keep your workspace clean.
MULTIPLE PROFIT TARGETS
Every range comes with three pre-calculated profit targets based on customizable Risk:Reward ratios. The default settings give you 1:1, 2:1, and 3:1 targets, but you can adjust these to match your trading plan. The indicator even tracks when each target is hit and alerts you accordingly.
VISUAL CLARITY
Your chart won't look like a mess of lines and boxes. Everything is color-coded: bullish ranges in green, bearish in red, FVGs in blue and orange. Historical ranges fade into the background so you can focus on current opportunities.
━━━━━━━━━━━━━━━━━━━━━━━━━━━━━━━━━━━━━━━━━━━━━━━━━━━━━━━━━━━━━━━━━━━━━
KEY FEATURES THAT TRADERS LOVE
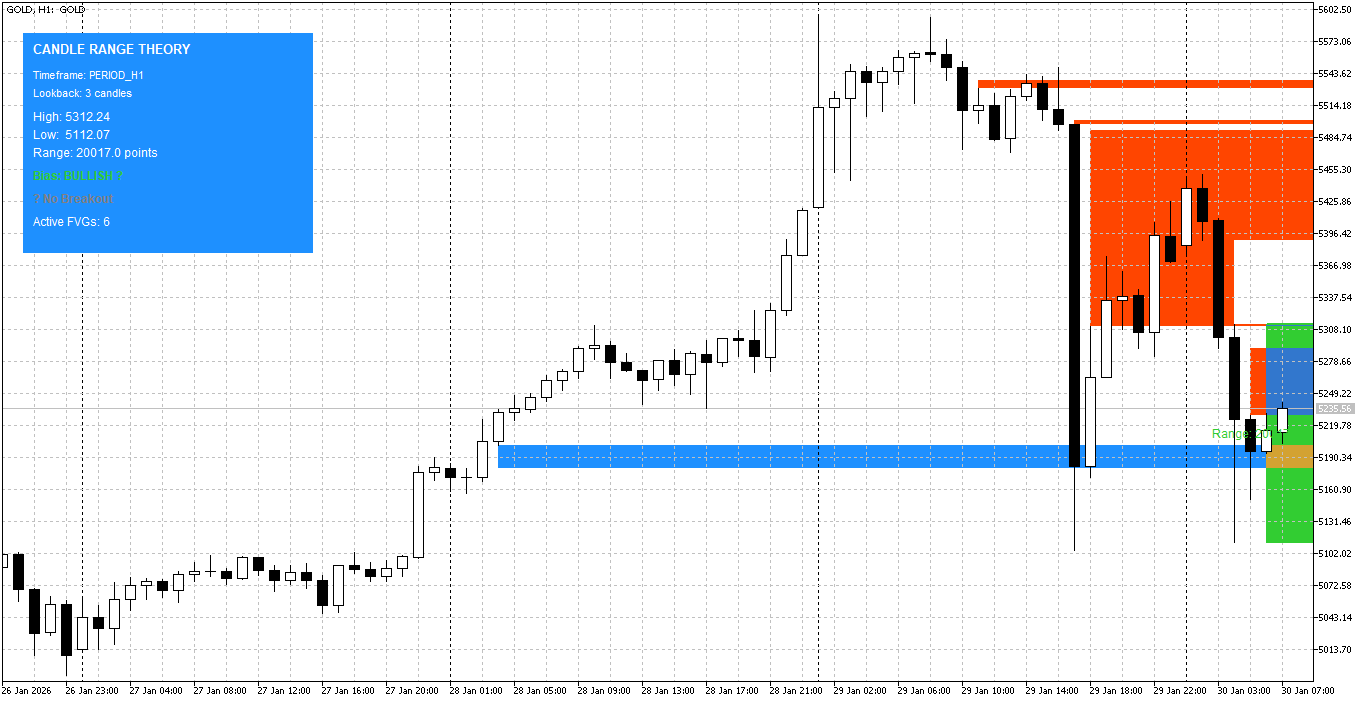
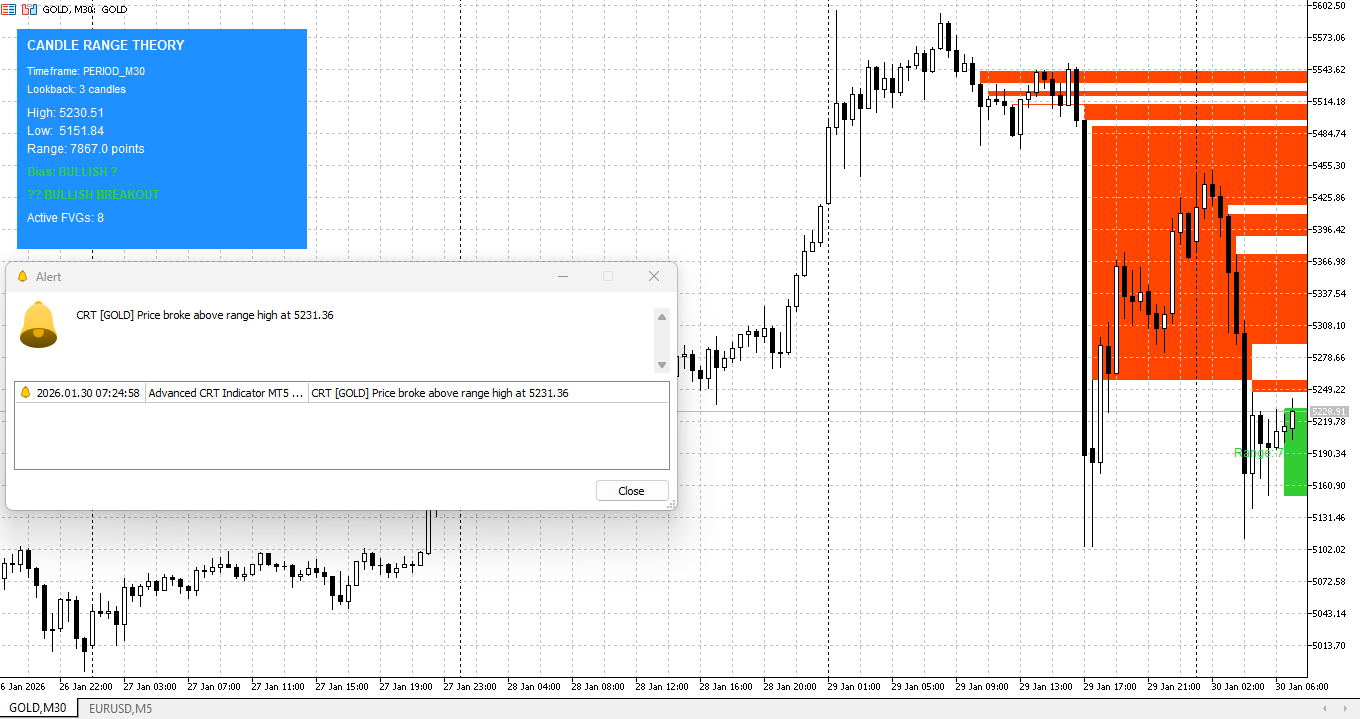
1. REAL-TIME INFORMATION DASHBOARD
A sleek, professional dashboard sits on your chart displaying:
- Current timeframe and lookback settings
- Range high, low, and size in points
- Market bias (Bullish or Bearish)
- Breakout status
- Number of active Fair Value Gaps
You get a complete market overview at a glance. The dashboard is fully customizable - adjust position, colors, transparency, and font size to match your setup.
2. COMPREHENSIVE ALERT SYSTEM
Never miss another trade opportunity:
- Sound alerts when breakouts occur
- Popup notifications for important events
- Push notifications to your mobile device
- Separate alerts for each profit target
- Optional FVG detection alerts
You can trade from anywhere, knowing your indicator is watching the market 24/7.
3. MULTI-TIMEFRAME ANALYSIS
The beauty of this indicator is its flexibility. Analyze ranges on any timeframe while viewing your chart on another. For example:
- Chart on M15, analyze H1 ranges
- Chart on H1, analyze H4 ranges
- Chart on H4, analyze Daily ranges
This gives you the big picture while managing trades on lower timeframes.
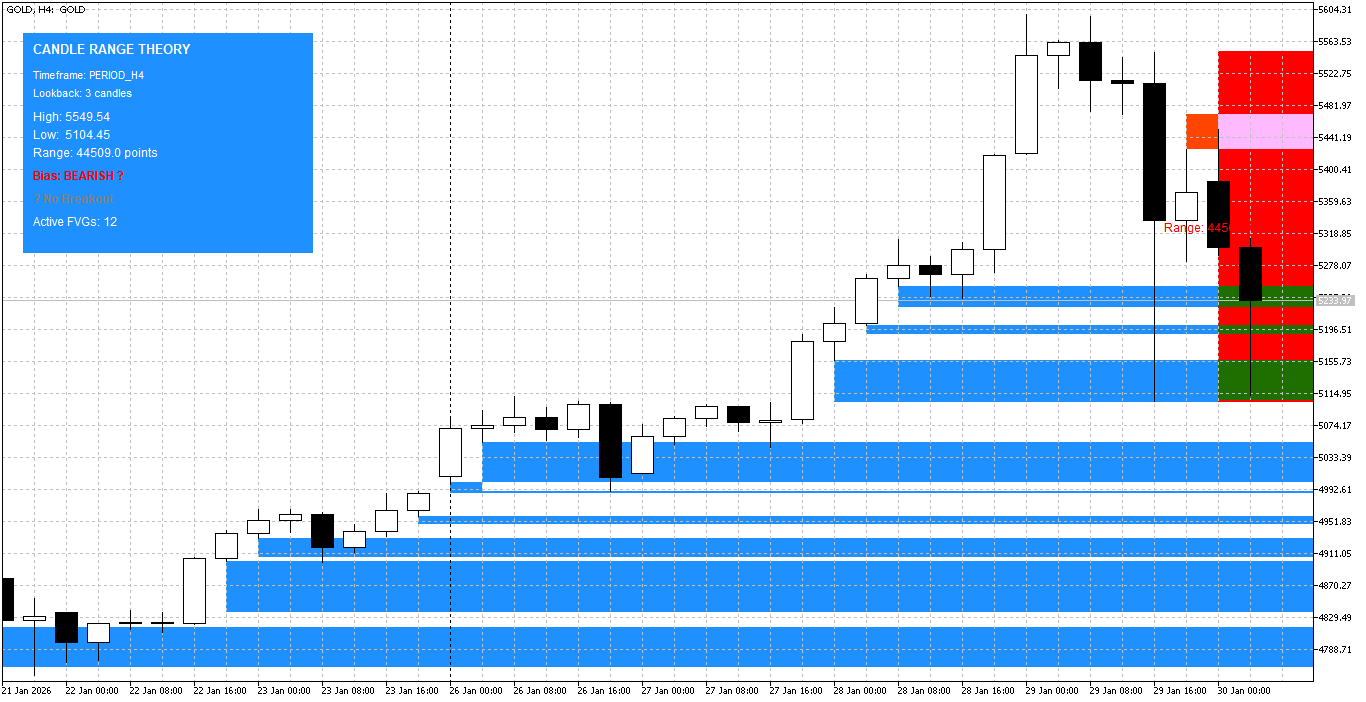
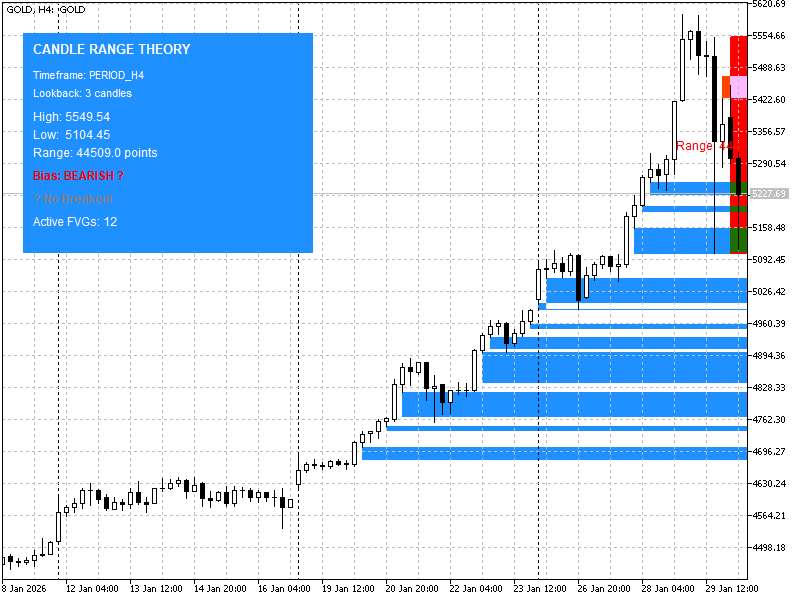
4. HISTORICAL RANGE DISPLAY
Learn from the past. The indicator can display up to 50 historical ranges, showing you how price behaved at previous consolidations. This helps you:
- Identify recurring patterns
- Understand typical breakout behavior
- Build confidence in your entries
- Backtest strategies visually
5. ZERO REPAINT GUARANTEE
Here's something critical: this indicator does NOT repaint. All calculations are based on closed candles. What you see is what you get. No false signals, no disappearing ranges, no second-guessing your entries.
━━━━━━━━━━━━━━━━━━━━━━━━━━━━━━━━━━━━━━━━━━━━━━━━━━━━━━━━━━━━━━━━━━━━━
HOW PROFESSIONAL TRADERS USE THIS INDICATOR
Let's walk through a real trading scenario:
SCENARIO: EUR/USD H1 Chart
Step 1: The indicator identifies a 3-candle consolidation range between 1.0850 and 1.0820 (30-point range).
Step 2: The dashboard shows "Bias: BULLISH" because the most recent candle closed higher than the previous one.
Step 3: Breakout levels are drawn:
- Bullish breakout: 1.0855 (5-point buffer above high)
- Bearish breakout: 1.0815 (5-point buffer below low)
Step 4: Profit targets are calculated:
- Bull T1: 1.0880 (1:1 RR = 30 points)
- Bull T2: 1.0910 (2:1 RR = 60 points)
- Bull T3: 1.0940 (3:1 RR = 90 points)
Step 5: Price breaks above 1.0855. ALERT! "Bullish Breakout detected"
Step 6: You enter long at 1.0856, stop loss at 1.0815 (range low).
Step 7: Price reaches 1.0880. ALERT! "Bull Target 1 reached" - You take partial profits.
Step 8: Price reaches 1.0910. ALERT! "Bull Target 2 reached" - You move stop to breakeven and take more profits.
Step 9: Price reaches 1.0940. ALERT! "Bull Target 3 reached" - You close the remaining position.
The entire process is automated. Your job is simply to execute the trade and manage your risk.
━━━━━━━━━━━━━━━━━━━━━━━━━━━━━━━━━━━━━━━━━━━━━━━━━━━━━━━━━━━━━━━━━━━━━
FAIR VALUE GAPS: YOUR SECRET WEAPON
One of the most powerful features is the FVG detection system.
What are Fair Value Gaps?
Fair Value Gaps occur when price moves so quickly that it leaves an "inefficiency" or "imbalance" in the market. These gaps often act as magnets, with price returning to fill them later.
How the Indicator Helps:
• Automatically scans up to 200 candles for FVGs
• Identifies both bullish and bearish gaps
• Draws colored rectangles marking the gap zones
• Tracks whether gaps have been filled
• Optionally hides filled gaps to reduce chart clutter
• Shows labels indicating gap type
Trading with FVGs:
Many professional traders use FVGs as:
- Entry zones for pullback trades
- Targets for profit-taking
- Areas to add to positions
- Confirmation of trend strength
With this indicator, you'll spot these zones instantly, giving you an edge over traders who miss them.
━━━━━━━━━━━━━━━━━━━━━━━━━━━━━━━━━━━━━━━━━━━━━━━━━━━━━━━━━━━━━━━━━━━━━
CUSTOMIZATION: YOUR INDICATOR, YOUR WAY
We understand that every trader is different. That's why we built extensive customization options:
Candle Range Settings:
- Choose any timeframe for analysis
- Set lookback period from 1 to 20 candles
- Adjust breakout buffer from 0 to 100 points
- Display up to 50 historical ranges
- Toggle historical ranges on/off
Fair Value Gap Settings:
- Enable or disable FVG detection
- Set lookback from 10 to 200 candles
- Auto-hide filled gaps option
- Show or hide FVG labels
- Custom colors for bullish/bearish FVGs
Breakout & Target Settings:
- Enable or disable breakout levels
- Customize all three Risk:Reward ratios
- Adjust target calculations to your strategy
Visual Settings:
- Choose your own colors for everything
- Line width from 1 to 5 pixels
- Multiple line styles (solid, dash, dot)
- Font sizes from 6 to 14
- Show or hide price labels
Dashboard Settings:
- Position anywhere on your screen
- Custom background, border, and text colors
- Font size from 8 to 12
- Transparency from 0 to 255
- Toggle entire panel on/off
Alert Settings:
- Enable individual alert types
- Sound, popup, and mobile notifications
- Separate controls for breakouts, targets, and FVGs
The indicator adapts to YOU, not the other way around.
━━━━━━━━━━━━━━━━━━━━━━━━━━━━━━━━━━━━━━━━━━━━━━━━━━━━━━━━━━━━━━━━━━━━━
COMPATIBLE WITH YOUR TRADING STYLE
Day Traders:
Use lower timeframes (M5, M15, M30) with short lookback periods for quick scalping opportunities. The alerts keep you on top of fast-moving markets.
Swing Traders:
Use higher timeframes (H4, D1) with longer lookback periods for larger moves. Set up your alerts and let the market come to you.
Smart Money Traders:
Combine CRT ranges with FVG detection to identify institutional order blocks and liquidity zones. The indicator speaks the language of smart money.
Breakout Traders:
The core of CRT is breakout trading. This indicator is purpose-built for identifying high-probability breakout setups with clear risk/reward parameters.
Price Action Purists:
No complicated formulas or lagging indicators. Just pure price action analysis, automated and optimized.
━━━━━━━━━━━━━━━━━━━━━━━━━━━━━━━━━━━━━━━━━━━━━━━━━━━━━━━━━━━━━━━━━━━━━
TECHNICAL EXCELLENCE
We didn't just build a functional indicator. We built it RIGHT.
Optimized Code:
- Minimal CPU usage
- Fast calculations
- No lag or freezing
- Works smoothly on older computers
Memory Management:
- Efficient memory allocation
- Automatic cleanup of old objects
- No memory leaks
- Stable for long-term use
Platform Compatibility:
- Works on MT4 and MT5
- All currency pairs supported
- Works on indices, commodities, stocks
- Compatible with all timeframes
- No DLL dependencies
- No external libraries required
Professional Standards:
- Clean, documented code
- Full source code included
- Easy to modify if you code
- Regular updates and improvements
━━━━━━━━━━━━━━━━━━━━━━━━━━━━━━━━━━━━━━━━━━━━━━━━━━━━━━━━━━━━━━━━━━━━━
WHAT TRADERS ARE SAYING
"I've been manually drawing CRT ranges for two years. This indicator does in seconds what used to take me 10 minutes per chart. The FVG detection is incredibly accurate."
- Marcus T., Full-Time Forex Trader
"The alerts changed my trading. I'm no longer glued to my screens. I get notified on my phone when breakouts happen, even when I'm away from my desk."
- Sarah L., Swing Trader
"Finally, an indicator that doesn't repaint! I can trust the signals and backtest accurately. The historical range display helped me understand my pair's behavior much better."
- James K., Algorithmic Trader
"The dashboard is brilliant. At a glance, I know everything I need about the current market structure. Clean, professional, and highly functional."
- David R., ICT Student
━━━━━━━━━━━━━━━━━━━━━━━━━━━━━━━━━━━━━━━━━━━━━━━━━━━━━━━━━━━━━━━━━━━━━
GETTING STARTED IS EASY
Installation takes less than 2 minutes:
1. Purchase and download the indicator
2. Copy the .mq4/.mq5 file to your Indicators folder
3. Restart MetaTrader or refresh the Navigator
4. Drag the indicator onto any chart
5. Customize settings to your preference
6. Start trading smarter
We include a comprehensive user manual with:
- Step-by-step installation guide
- Detailed explanation of all settings
- Trading strategy examples
- Best practices and tips
- Troubleshooting section
━━━━━━━━━━━━━━━━━━━━━━━━━━━━━━━━━━━━━━━━━━━━━━━━━━━━━━━━━━━━━━━━━━━━━
INVESTMENT IN YOUR TRADING CAREER
Think about how much time you spend analyzing charts every day. Drawing ranges. Calculating targets. Setting alerts. Checking for Fair Value Gaps.
Now imagine all of that happening automatically, accurately, and instantly.
What would that be worth to you?
This indicator is an investment in:
- Time saved (hours every week)
- Opportunities captured (no more missed breakouts)
- Accuracy (no manual calculation errors)
- Consistency (objective, rule-based analysis)
- Peace of mind (24/7 market monitoring)
SPECIAL LAUNCH OFFER
For a limited time, we're offering the Advanced CRT Indicator at an introductory price:
✓ Full indicator with all features unlocked
✓ Complete source code (editable)
✓ Lifetime license (no subscription)
✓ Free updates forever
✓ Comprehensive user manual
✓ Email support
✓ 30-day money-back guarantee
BONUS: Early adopters also receive:
- Custom settings template for major pairs
- Video tutorial series
- Trading strategy PDF guide
- Priority support for 90 days
━━━━━━━━━━━━━━━━━━━━━━━━━━━━━━━━━━━━━━━━━━━━━━━━━━━━━━━━━━━━━━━━━━━━━
RISK-FREE GUARANTEE
We're so confident you'll love this indicator that we offer a 30-day money-back guarantee. If you're not completely satisfied, just let us know and we'll refund your purchase. No questions asked.
You have nothing to lose and everything to gain.
━━━━━━━━━━━━━━━━━━━━━━━━━━━━━━━━━━━━━━━━━━━━━━━━━━━━━━━━━━━━━━━━━━━━━
FREQUENTLY ASKED QUESTIONS
Q: Does this indicator repaint?
A: No. All calculations are based on closed candles. What you see is permanent and reliable.
Q: Can I use this on multiple charts simultaneously?
A: Absolutely. Load it on as many charts as you want.
Q: Does it work on all currency pairs?
A: Yes. Works on forex, indices, commodities, stocks - any instrument in MetaTrader.
Q: Is coding knowledge required?
A: Not at all. It works perfectly out of the box. However, source code is included if you want to customize.
Q: How often is it updated?
A: We release updates regularly based on user feedback and market conditions. All updates are free.
Q: Can I change the colors and styles?
A: Everything is customizable. Colors, sizes, positions, transparency - you have full control.
Q: Does it send alerts to mobile?
A: Yes. You can enable push notifications to receive alerts on your MetaTrader mobile app.
Q: What if I need help setting it up?
A: We provide email support and a detailed user manual. Most users are up and running in minutes.
━━━━━━━━━━━━━━━━━━━━━━━━━━━━━━━━━━━━━━━━━━━━━━━━━━━━━━━━━━━━━━━━━━━━━
THE BOTTOM LINE
Trading is hard enough. Your tools shouldn't make it harder.
The Advanced Candle Range Theory Indicator was built by traders, for traders. It automates the tedious parts of CRT analysis so you can focus on what matters: making good trading decisions.
Whether you're a beginner learning price action or a veteran trader looking to optimize your workflow, this indicator will transform how you trade.
Stop missing opportunities. Stop manually drawing ranges. Stop second-guessing your analysis.
Start trading with confidence, clarity, and precision.
DOWNLOAD NOW
Available on the MQL5 Market and our official website.
Join thousands of traders who have already upgraded their trading with the Advanced CRT Indicator.
Your edge is waiting.
━━━━━━━━━━━━━━━━━━━━━━━━━━━━━━━━━━━━━━━━━━━━━━━━━━━━━━━━━━━━━━━━━━━━━
DISCLAIMER
Trading foreign exchange, commodities, indices, and other financial instruments carries a high level of risk and may not be suitable for all investors. The high degree of leverage can work against you as well as for you. Before deciding to trade, you should carefully consider your investment objectives, level of experience, and risk appetite.
This indicator is a technical analysis tool designed to assist traders in identifying potential trading opportunities. It should not be considered as financial advice or a guarantee of profits. Past performance is not indicative of future results.
Always conduct your own research and trade responsibly. Only risk capital you can afford to lose. Consider seeking advice from an independent financial advisor if you have any doubts.
The developers and sellers of this indicator accept no liability for any loss or damage resulting from the use of this software.
━━━━━━━━━━━━━━━━━━━━━━━━━━━━━━━━━━━━━━━━━━━━━━━━━━━━━━━━━━━━━━━━━━━━━
MT5 -> [Advanced CRT Indicator MT5]
MT4 ->[Advanced CRT Indicator MT4]
Files:
GOLDH1.png
55 kb
GOLDH1c.png
41 kb
GOLDH4.png
45 kb
GOLDH4c.png
34 kb
GOLDM15a.png
62 kb
GOLDM30.png
51 kb
GOLDM5.png
51 kb
XM_Global_MT5.png
77 kb
XM_Global_MT5B.png
83 kb


