

Trading recommendations
Sell Stop 2305.0. Stop-Loss 2322.0. Objectives 2275.0, 2256.0, 2243.0, 2220.0, 2200.0, 2190.0, 2170.0
Buy Stop 2322.0. Stop-Loss 23050.0. Objectives 2330.0, 2350.0, 2400.0
Overview and Dynamics
Investors continued to withdraw funds from safe assets such as gold, the yen, the US government bonds last week. All three major US indices (Dow Jones Industrial Average, S&P500, Nasdaq Composite) updated its highs on Friday and ended the week higher.
ICE dollar index closed Friday at its highest level (100.80) since the final January 19. The ICE index grew an eighth consecutive session. Investors also expect the Fed this year will raise rates by 2-3 times.
Economists are positive about the outlook for the US economy. The expectations of accelerating economic growth will boost appetite investors to buy riskier assets such as stocks and the conclusion of funds from safe assets - precious metals, government bonds. Steps taken to revive the Trump oil projects, deregulation, and tax cuts will lead to an increase in infrastructure spending, spurring inflation.
Today, the economic calendar is empty, and in the week, investors' attention will be focused on Fed Chairman Janet Yellen, who will present to Congress semi-annual report on monetary policy. Her speech is scheduled for tomorrow at 15:00 (GMT). Market participants will also closely monitor the statements and actions of US President Donald Trump. Donald Trump's statements he made last week about "the phenomenal terms of taxes", a tendency reinforced investors to buy riskier assets and contributed to the growth of US indexes. Tax cuts (one of the campaign promises Trump) will contribute to the growth of consumer spending and investment companies, which will benefit the economy as a whole. And this is a positive factor for US stock indexes.
Technical analysis
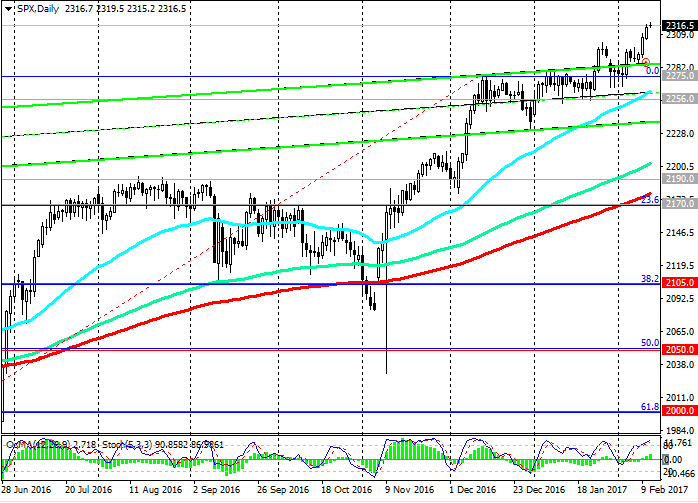
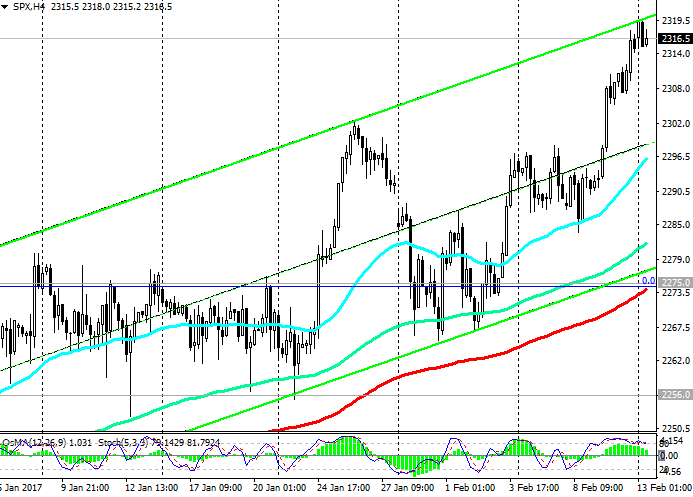
Struck in the early months of the resistance level of 2275.0 (the December highs and recent highs reached in the wake of S & P500 growth since February 2016, as well as EMA200 and the lower line of the rising channel on 4-hour chart), S&P500 index continued to grow and today is trading in a narrow range near the mark 2316.0.
The S&P500 during the Asian session set a new absolute record near the mark of 2320.0 after the election of a new president in the United States.
OsMA and Stochastic indicators on monthly, weekly, daily and 4-hour charts recommend long positions. Despite overbought, the growth index is likely to continue. It is considered that the only long positions.
Alternative scenario implies a decline in the return below 2275.0. Break of this support level will increase risks of further decline of the index to levels 2190.0 (August highs), 2170.0 (EMA200 on the daily chart and Fibonacci correctional level of 23.6% in the wake of the growth of S & P500 index from February 2016). Break of the support level of 2105.0 (38.2% Fibonacci level) cancels the bullish trend of the index.
However, while the S&P500 index is above the support level of 22275.0, its positive momentum is maintained.
Support levels: 2275.0, 2256.0, 2243.0, 2220.0, 2200.0, 2190.0, 2170.0
Resistance levels: 2320.0, 2350.0, 2400.0
Author signals - https://www.mql5.com/en/signals/author/edayprofit
*)presented material expresses the personal views of the author and is not a direct guide to conduct trading operations.


 & AMD Framework")
