
USDCAD Technical Analysis 2016, 18.09 - 25.09: daily bullish breakout
18 September 2016, 15:04

13
275
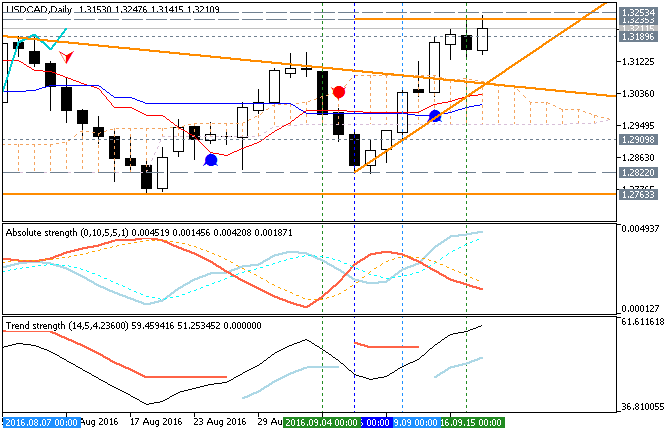
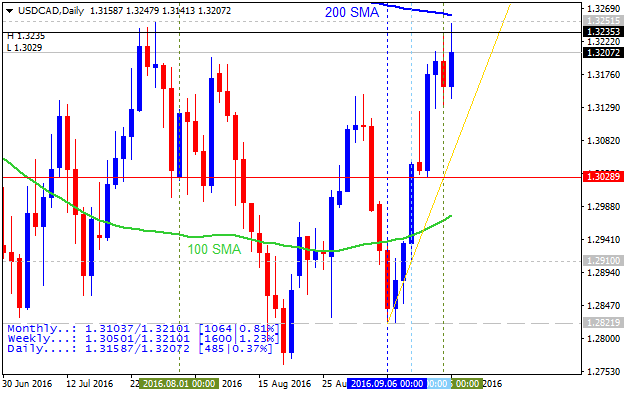
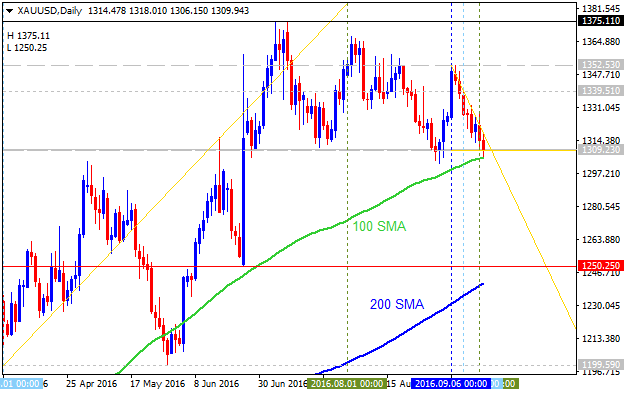
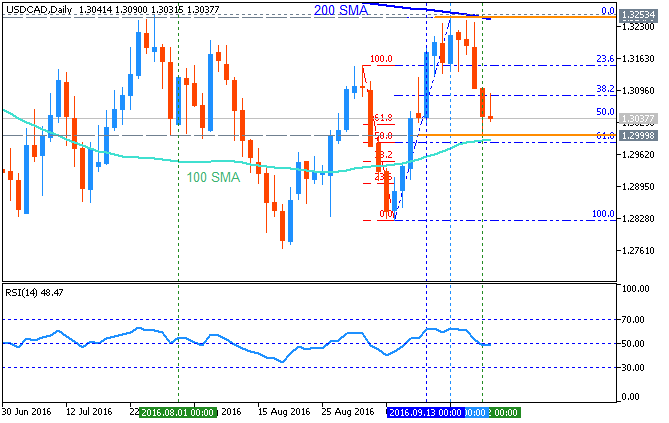
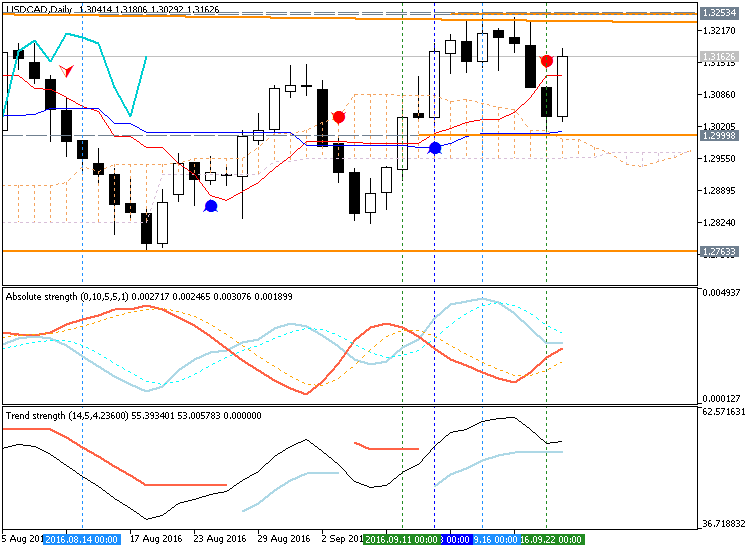
Daily price is located above Ichimoku cloud in the bullish area of the chart.
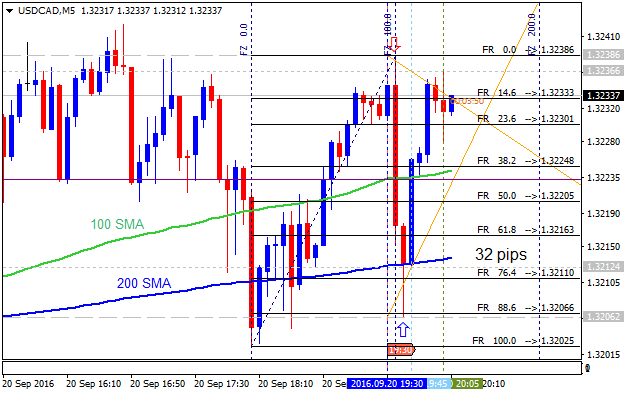
- The price is on bullish breakout with ascending triangle pattern to be formed by the price to be crossed to above together with 1.3235 res. for the breakout to be continuing.
- Chinkou Span line crossed the price to above for the breakout.
- Absolute Strength indicator and Trend Strength indicator are evaluating the future trend as the primary bullish.
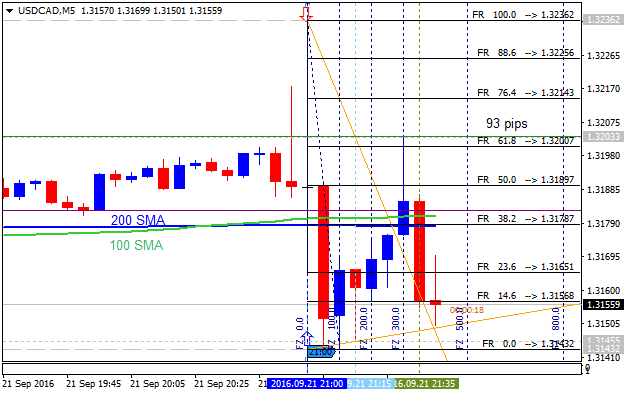
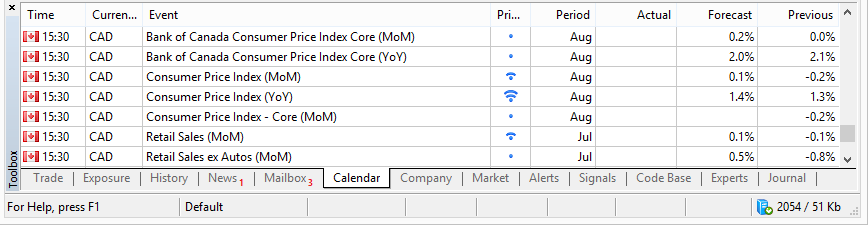
- Nearest resistance levels are 1.3235 and 1.3253.
- Nearest support levels are 1.2909 and 1.2763.
If D1 price breaks 1.2909
support level on close bar so the reversal of the primary bullish to
the primary bearish market condition will be started with 1.2763 nearest
daily bearish target to re-enter.
If D1 price breaks 1.3235
resistance level on close bar from below to above so the bullish trend will be continuing with 1.3253 level as a target.
If not so the price will be on bullish ranging within the levels.
- Recommendation for long: watch close D1 price to break 1.3235 for possible buy trade
- Recommendation
to go short: watch D1 price to break 1.2909 support level for possible sell trade
- Trading Summary: bullish
| Resistance | Support |
|---|---|
| 1.3235 | 1.2909 |
| 1.3253 | 1.2763 |
SUMMARY : breakout


")
