
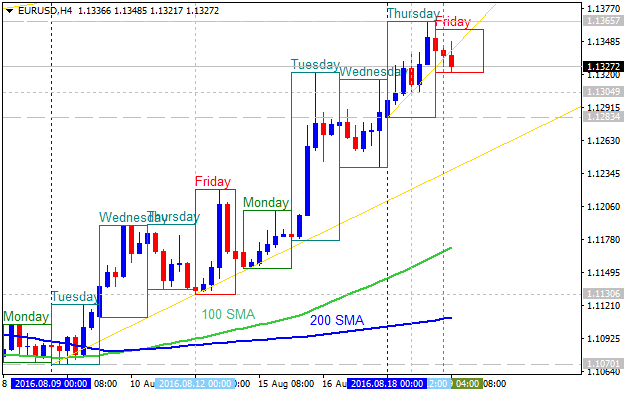
EURUSD Technical Analysis 2016, 14.08 - 21.08: daily ranging inside Ichimoku cloud for direction

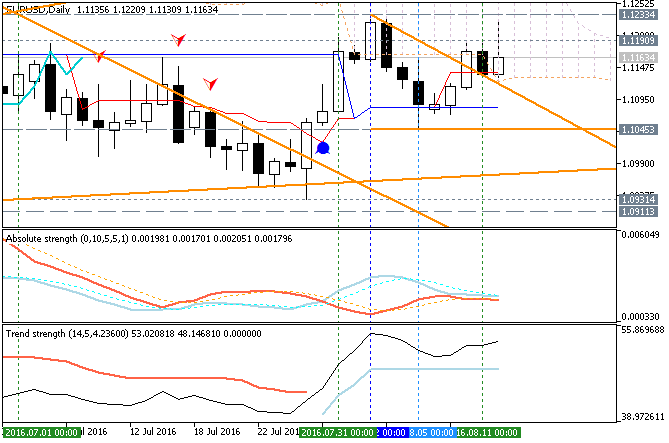
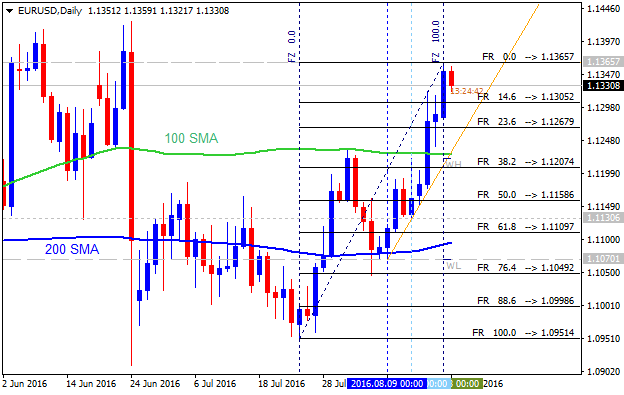
Daily price broke one of the 'reversal' Senkou Span line of
Ichimoku indicator together with trendline to above: the price broke
this line to be located inside Ichimoku cloud in the bearish ranging
area of the chart waiting for the direction. Absolute Strength indicator
is estimating the trend to be on ranging waiting for
breakout/breakdown, and Trend Strength inticator is evaluating the
future possible trend as the possible daily bullish reversal.
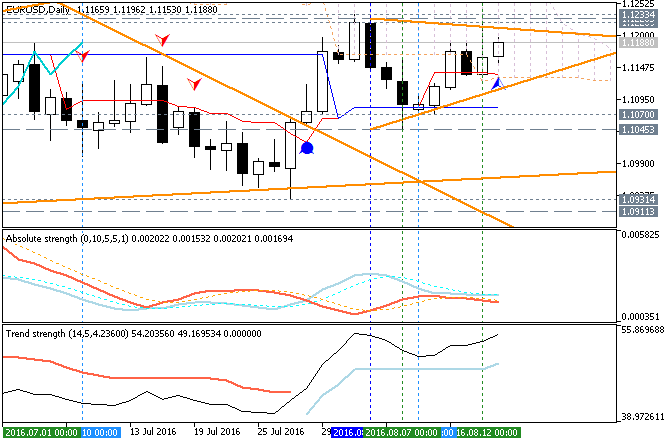
If D1 price breaks 1.1045
support level on close bar together with descending triangle pattern to below so the primary bearish trend will be resumed.
If D1 price breaks 1.1233
resistance level on close bar from below to above so the bullish
reversal will be started.
If not so the price will be on bearish ranging within the levels.
- Recommendation for long: watch close D1 price to break 1.1233 for possible buy trade
- Recommendation
to go short: watch D1 price to break 1.1045 support level for possible sell trade
- Trading Summary: ranging
| Resistance | Support |
|---|---|
| 1.1233 | 1.1072 |
| N/A | 1.0931 |
SUMMARY : ranging bearish


")
 & AMD Framework")