
USD/CAD rose for a second straight week, gaining 150 points. The pair closed at the 1.30 line. This week’s key event is GDP. Here is an outlook on the major market-movers and an updated technical analysis for USD/CAD.
Last week’s Brexit vote in the UK sent shock waves in Britain and across Europe. Brits decided to leave the EU in a decisive 52% to 48% vote. After the vote, the Canadian dollar lost ground as investors shied away from risk. The Brexit has implications not only on the economies of Europe, but across the globe. In the US, Yellen sounded quite dovish and a rate hike is unlikely before September at the earliest.
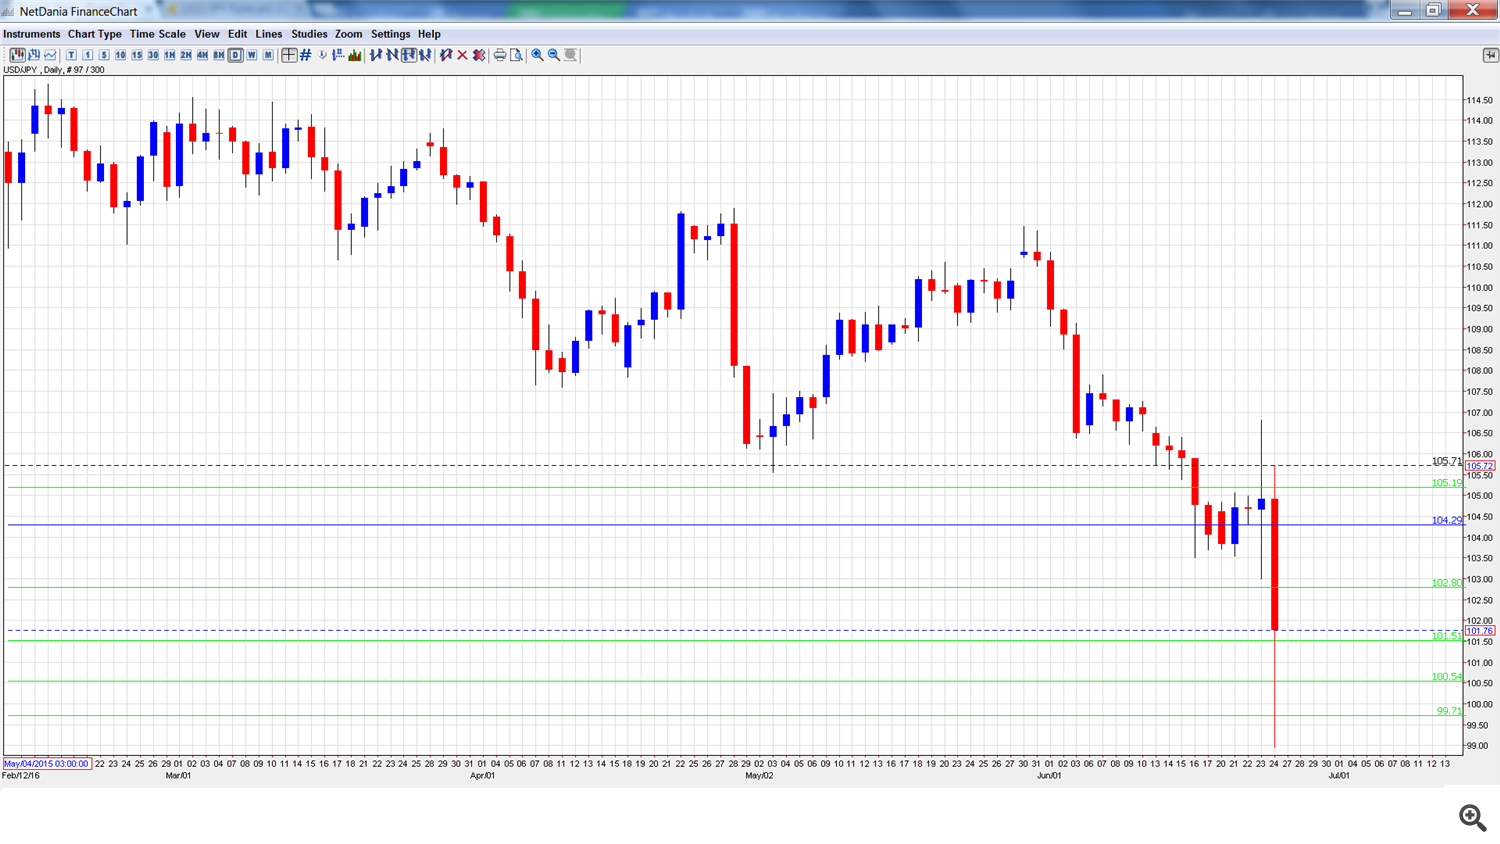
Updates:USD/CAD daily graph with support and resistance lines on it. Click to enlarge:
- GDP: Thursday, 12:30. GDP is one of the most important economic indicators, and an unexpected reading can have a sharp impact on the movement of GBP/USD. The indicator has posted two straight declines, but the forecast for the May report stands at a 0.1% gain.
- RMPI: Thursday, 12:30. RMPI measures inflation in the manufacturing sector. The index slipped to 0.7% in May, well short of the forecast of 2.2%
USD/CAD Technical Analysis
USD/CAD opened the week at 1.2849 and touched a low of 1.2674 later in the week. The pair then climbed sharply to a high of 1.3098, testing resistance at 1.3081. USD/CAD closed the week at 1.2996.
Technical lines, from top to bottom
1.3219 was a cap in April.
1.3081 was tested but remains a strong resistance line.
1.2990 is next.
1.2900 starts the week just above the current level of USD/CAD. It will likely see action early in the week.
1.2780 is providing support.
1.2663 has held firm in support since early May.
1.2538 is next.
1.2459 is the final support level for now.
I am bullish on USD/CAD
The aftershocks from the Brexit vote are likely to continue this week, and jumpy investors may dump Canadian dollars in favor of the safe-haven greenback.


")
![[XAUUSD]: Weekly Liquidity Activation Points (timings), June 22-26, 2026](https://c.mql5.com/6/1013/splash-preview-771790.png "[XAUUSD]: Weekly Liquidity Activation Points (timings), June 22-26, 2026")
