


We can see areas, with almost no free levels and therefore the price for passage without problems and areas full of minor skirmishes area that hindered the progress of our army in their battle. We can see where sl and tp our adversaries are hidden behind guessing that level have placed their positions.
It is a very useful indicator for planning a trade, taking on the screen, the two largest and white lines that are going to mark the conflict zone, and define within it the potential difficulties that we can find.
Highly recommended for those who want to operate manually and visually to have a clear idea of how the battle.
The lines shown are:
Red lines: These are points of low resistance, shows the front line, where is being performed the sharpest battle. We see the position of the army bull and bear their first effective.

Small white lines: Displays the rear of our battle, are the points where there will be a start of the drag of the price. The thickness of the line shows the strength of that line and therefore the price will have difficulty in through.

Large long white lines: mark the boundaries of the battlefield, shows the upper and lower two limits of our battle, I recommend resize the chart so that these lines are always on display. If we are close to the top, shows how the bulls are attacking strongly bears and can be rejected, then we will look at below the price and see if we have a clear field or bulls were creating lines of defense in the conquered territory. If we are close to the bottom, the situation is similar but reversed with bears strong attacking bull zone of high resistance.

Brown lines: Shows the pivot point, we have on the battlefield.

Blue lines: They mark the zero points, places where it is more likely to place tp and sl and therefore potential areas of our army ambush. The thicker, more powerful ambush this point.


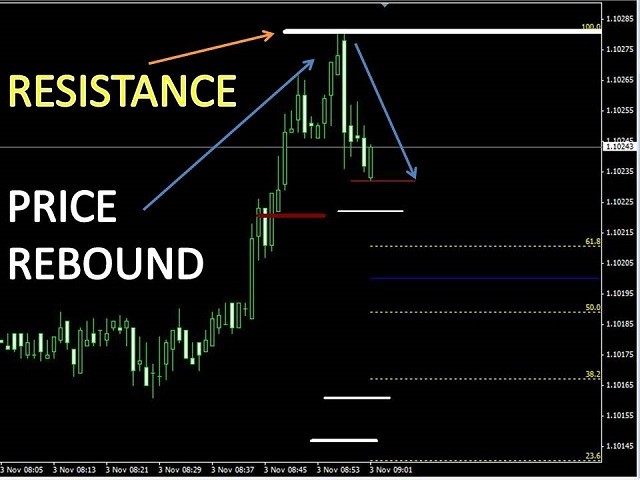
Scenario 1: Rebound in strength Bull:

In this scenario we see our map of the battle, the army look like the bear mercilessly advancing toward the thick bull strong support that delimits the end of our field. On his way he has left white lines represent areas where bears can be made strong in his retirement. Also we note as the resistance level zero point has been overcome.
But progress has been slowed to reach the defensive line bull, producing a price rebound tending toward the first fortified area bear is the top white line.
Scenario 2: Rebound in strength BEAR:
In this case we see how the powerful bull forward, braking fuer bear in strength, that after realizing the level impenetrability makes a strong pullback to defensive positions. It is important to note as the pivot point was a major battle zone and once solved this resistance point price go along smoothly towards the bear strength.
Scenario 3: Detection of weaknesses in defense (military intelligence reports happens to us):
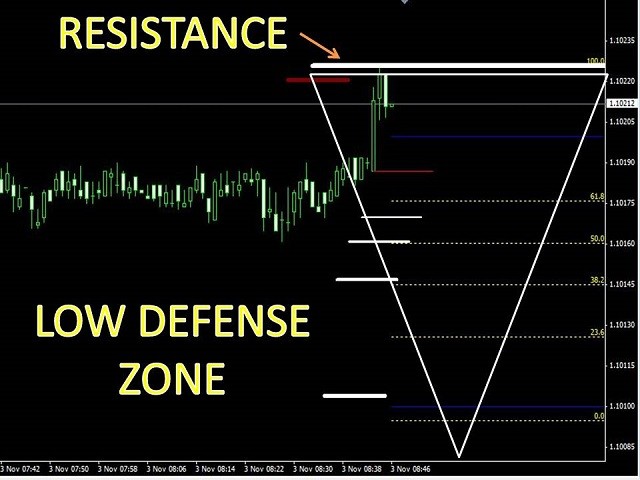
In this scenario the intelligence shows us on the map as the bull army is far from its base. And you have an area with few points of resistance and far between them, that makes us think that if it fails in its attempt to break the bear strength, the withdrawal will be uncoordinated and can take advantage of putting aside the Bears, for example waiting below the zero line and go quietly offensive expected quiet.
Scenario 4: Map of the battlefield:
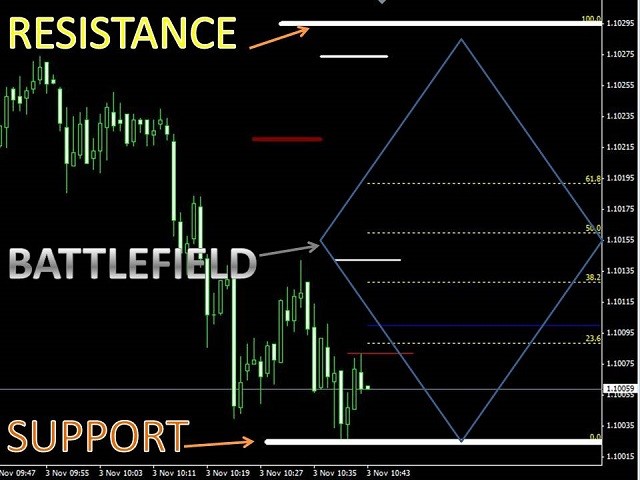
In the center we see all the pockets of resistance that we will find in the field, with their different importances, to help us position ourselves on the battlefield.
I hope you like the indicator. A greeting Raúl


")
![[XAUUSD]: Weekly Liquidity Activation Points (timings), June 22-26, 2026](https://c.mql5.com/6/1013/splash-preview-771790.png "[XAUUSD]: Weekly Liquidity Activation Points (timings), June 22-26, 2026")
")