
The most popular Forex indicator is subjective and varies depending on the trader's strategy and preferences.
However, some of the top indicators used by professionals include:
1. Moving Average (MA)
is a commonly used technical analysis tool that helps traders and investors to identify trends and potential price movements in financial markets.
It is a simple calculation that takes the average price of an asset over a specified period of time, typically ranging from a few days to several months.
The moving average is plotted on a chart as a line that moves along with the price of the asset, smoothing out short-term fluctuations and highlighting longer-term trends.
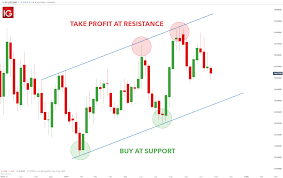
Traders often use moving averages to identify support and resistance levels, as well as to generate buy and sell signals based on crossovers between different moving averages.
There are different types of moving averages, including simple moving averages (SMA), exponential moving averages (EMA), weighted moving averages (WMA), and others, each with its own strengths and weaknesses.
Overall, moving averages are a useful tool for traders and investors who want to stay on top of market trends and make informed trading decisions.
2. Relative Strength Index (RSI)
is a technical analysis indicator that measures the strength of a security by comparing its average gains to its average losses over a specified period of time.
The RSI is typically calculated using a 14-day period but can be adjusted to fit the trader's preference.
The RSI is plotted on a scale of 0 to 100, with readings above 70 indicating an overbought condition and readings below 30 indicating an oversold condition.
Traders use the RSI to identify potential trend reversals or confirm existing trends. The RSI can also be used in conjunction with other technical indicators to create a complete trading strategy.

3. The Stochastic Oscillator
is a technical analysis tool that measures the momentum of an asset's price movement.
It was developed by George Lane in the 1950s and is based on the idea that as an asset's price increases, its closing price tends to be closer to the high of the day, and as the price decreases, its closing price tends to be closer to the low of the day.
The Stochastic Oscillator compares the current closing price of an asset to its price range over a specified period of time, typically 14 days.
The resulting value is plotted on a scale of 0 to 100, with readings above 80 indicating an overbought condition and readings below 20 indicating an oversold condition.
Traders use the Stochastic Oscillator to identify potential trend reversals and to generate buy and sell signals based on divergences between the oscillator and the asset's price.
It is a popular tool among technical analysts and is often used in conjunction with other indicators to confirm trading decisions.

4. Bollinger Bands
are a technical analysis tool that was developed by John Bollinger in the 1980s.
They are a type of trading indicator that is used to measure the volatility of a financial instrument, such as a stock or currency pair. Bollinger Bands consist of three lines: the upper band, the lower band, and the middle band.
The middle band is typically a simple moving average, while the upper and lower bands are calculated based on the standard deviation of price movements from the middle band.
The width of the bands can be adjusted to reflect different levels of volatility, and traders often use Bollinger Bands to identify potential buy or sell signals.
When prices move outside of the bands, it can indicate that a trend reversal is likely to occur. Overall, Bollinger Bands are a popular tool among traders and can be used in a variety of trading strategies.
5. Fibonacci retracement
is a technical analysis tool used to identify potential levels of support and resistance in a financial market.
It is based on the idea that markets tend to retrace a predictable portion of a move, after which they continue in the original direction. The tool uses horizontal lines to indicate areas of support or resistance at the key Fibonacci levels before the price continues in the original direction.
These levels are derived from the Fibonacci sequence, a mathematical pattern where each number is the sum of the two preceding numbers. The most commonly used Fibonacci retracement levels are 38.2%, 50%, and 61.8%.
Traders use Fibonacci retracement to identify potential entry and exit points for trades, as well as to set stop-loss orders to limit their losses. However, it is important to note that Fibonacci retracement is not a foolproof tool and should be used in conjunction with other technical analysis tools and fundamental analysis.
6. MACD (Moving Average Convergence Divergence)
is a popular technical analysis indicator used to identify trends and momentum in financial markets.
It is calculated by subtracting the 26-period exponential moving average (EMA) from the 12-period EMA. The resulting line is then plotted on a chart, along with a 9-period EMA of the MACD line, known as the signal line.
Traders use the MACD to identify bullish and bearish crossovers between the MACD line and the signal line, as well as divergences between the MACD line and the price of an asset.
The MACD can also be used to identify overbought and oversold conditions in an asset, as well as potential trend reversals. Overall, the MACD is a versatile tool that can be used in a variety of trading strategies and is widely used by traders and investors around the world.
7. Ichimoku Kinko Hyo
is a technical analysis tool used in trading financial markets.
It was developed by Japanese journalist Goichi Hosoda in the late 1930s and is also known as Ichimoku Cloud or simply Ichimoku.
The system consists of five lines that are plotted on a price chart, including the Tenkan-sen, Kijun-sen, Senkou Span A, Senkou Span B, and Chikou Span.
These lines provide traders with information on trend direction, support and resistance levels, and potential buy or sell signals.
The Ichimoku Cloud is formed by the Senkou Span A and Senkou Span B lines and is used to identify areas of potential support or resistance.
The system is popular among traders due to its ability to provide a comprehensive view of the market in a single chart.
8. The Average Directional Index (ADX)
is a technical analysis indicator that measures the strength of a trend in a financial asset.
It was developed by J. Welles Wilder Jr. and is used to determine whether a market is trending or not.
The ADX is calculated by taking the difference between two directional movement indicators (DMI), which are also developed by Wilder, and then smoothing the result over a certain period of time. The resulting value ranges from 0 to 100, with values above 25 indicating a strong trend and values below 20 indicating a weak trend or no trend at all.
Traders use the ADX to help identify potential trading opportunities and to manage risk by avoiding trades in markets that are not trending strongly. It is important to note that the ADX does not provide information on the direction of the trend, only its strength.
Therefore, it is often used in conjunction with other technical indicators to make trading decisions.
9. Parabolic SAR
is a technical analysis indicator that is used to determine the direction of an asset's price movement.
It is commonly used by traders to identify potential trend reversals in the market. The indicator is represented by a series of dots that are plotted above or below the price of an asset on a chart.
When the dots are below the price, it indicates an uptrend, while dots above the price indicate a downtrend.
The dots move closer to the price as the trend continues, which can help traders identify potential entry and exit points for their trades.
The Parabolic SAR is a popular tool among traders due to its simplicity and effectiveness in identifying trends.
However, it should be used in conjunction with other technical indicators and analysis methods to make informed trading decisions.
10. Williams %R
11. On-Balance-Volume (OBV)
12. Commodity Channel Index (CCI)
13. Aroon Indicator
14. Chaikin Money Flow (CMF)
15. Keltner Channels
are a technical analysis tool that is used to identify potential price trends in the financial markets.
They consist of three lines that are plotted on a price chart: a central moving average line, an upper channel line, and a lower channel line.
The central line is typically a 20-period exponential moving average, while the upper and lower lines are drawn at a distance from the central line based on the average true range of the asset being analyzed.
The upper and lower lines act as dynamic support and resistance levels, with prices tending to bounce off them as they move within the channel.
Traders use Keltner Channels to identify potential breakouts or reversals in price trends, with a breakout above the upper channel indicating a bullish trend and a breakout below the lower channel indicating a bearish trend.
Keltner Channels can be used in conjunction with other technical analysis tools to confirm signals and improve trading accuracy.
16. Momentum Indicator
17. The SuperTrend Indicator
is a technical analysis tool used to identify the direction of a trend in the financial markets.
It is a popular indicator among traders and investors due to its simplicity and effectiveness.
The SuperTrend Indicator is based on the average true range (ATR) and the moving average (MA) of the price.
It plots two lines on the chart: the upper line represents the resistance level, while the lower line represents the support level.
When the price is above the upper line, it indicates an uptrend, and when it is below the lower line, it indicates a downtrend.
The SuperTrend Indicator can be used in conjunction with other technical indicators to confirm trading signals and improve accuracy.
It is available on most trading platforms and can be customized to suit individual preferences.
Overall, the SuperTrend Indicator is a valuable tool for traders and investors looking to identify trends in the financial markets and make informed trading decisions.
18. Donchian Channels
is a technical analysis tool used to identify potential trading opportunities in financial markets.
It was developed by Richard Donchian, a pioneer in the field of trend-following trading strategies. The tool consists of three lines: an upper line, a lower line, and a middle line.
The upper line represents the highest price over a specified period, while the lower line represents the lowest price over the same period. The middle line is the average of the upper and lower lines.
Traders use Donchian Channels to identify breakouts, which occur when prices move outside the upper or lower lines.
Breakouts can signal potential trends and provide opportunities for traders to enter or exit positions.
Donchian Channels can be applied to any financial market, including stocks, commodities, and currencies.
However, like any technical analysis tool, it should be used in conjunction with other indicators and analysis techniques to make informed trading decisions.
19. Envelopes Indicator
20. Heiken Ashi candlesticks
are a type of charting technique used in technical analysis to identify trends and potential trading opportunities in financial markets.
Unlike traditional candlestick charts, Heiken Ashi candlesticks use a modified formula to calculate the open, high, low, and close prices of each candlestick.
This formula takes into account the previous candlestick's prices, resulting in smoother and more reliable trend signals.
Heiken Ashi candlesticks can be used in various timeframes and trading strategies, including swing trading and trend following.
They are particularly useful for traders who prefer a more visual representation of price action and want to avoid false signals caused by market noise.
Overall, Heiken Ashi candlesticks are a valuable tool for traders looking to improve their technical analysis skills and make more informed trading decisions.
Other popular indicators include the Alligator Indicator, Elder Ray Index, and the Ultimate Oscillator, among others.
It's important to note that no single indicator can guarantee success in Forex trading, and traders should use a combination of indicators and other analysis tools to make informed trading decisions.
Additionally, traders should also consider market conditions, economic events, and other external factors that may impact currency prices.
It's also crucial to have a solid understanding of risk management and to have a well-defined trading plan in place.
Ultimately, successful Forex trading requires a combination of knowledge, skill, discipline, and a willingness to adapt to changing market conditions.
https://www.mql5.com/en/market/product/47776
Multi Time Frame Multi Currency Signals Dashboard
https://www.mql5.com/en/market/product/47755
https://www.mql5.com/en/market/product/47989
https://www.mql5.com/en/market/product/50592


")
![[XAUUSD]: Weekly Liquidity Activation Points (timings), June 22-26, 2026](https://c.mql5.com/6/1013/splash-preview-771790.png "[XAUUSD]: Weekly Liquidity Activation Points (timings), June 22-26, 2026")
")