

Weekly price is on bullish market condition with above
100-period SMA and above 200-period SMA with the ranging between 2134.42
resistance level and 1863.12 support level:
- 2134.42 resistance level is located far above 100-SMA/200-SMA in the primary bullish area of the chart;
- 1863.12 support level is located between 100-SMA and 200-SMA on the ranging area and between the primary bearish and the primary bullish market condition;
- the price is ranging around 2033.28 level;
- nearest support levels to be broken are 46.22 and 42.18;
- nearest resistance levels are 54.27 (W1) and 69.57 (W1).
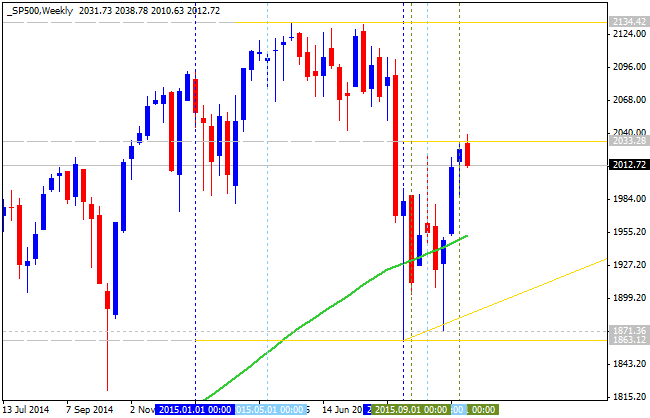
| Resistance | Support |
|---|---|
| 2033.28 (W1) | 1871.36 (W1) |
| 2134.42 (W1) | 1863.12 (W1) |
- if weekly price
breaks 2134.42 resistance so the bullish trend will be continuing;
- if weekly price breaks 1863.12 support level so we may see the secondary ranging condition with the good possibility for the reversal of the price movement from the bullish to the primary bearish trend;
- if not so the price will be moved within the levels.


