Stop Overloading Your XAUUSD Basket - Meet Inventory Control Tool

💎 TL;DR
Many XAUUSD traders don't fail because of a single bad entry. They fail because exposure builds gradually - each add seeming reasonable in isolation - until the basket is too heavy to manage well. The Inventory Control Tool MT5 is a live basket exposure monitor that tracks your total load, directional bias, floating pain, and position aging in a single panel, and outputs three independent readings: a Pressure Level (Watch/Danger/Critical), an Inventory Headline (Stable/Watch/Reduce/Danger), and an Add State (Free/Controlled/Cautious/Locked). It does not trade. It does not signal entries. It gives you the context you were missing before you clicked buy again.
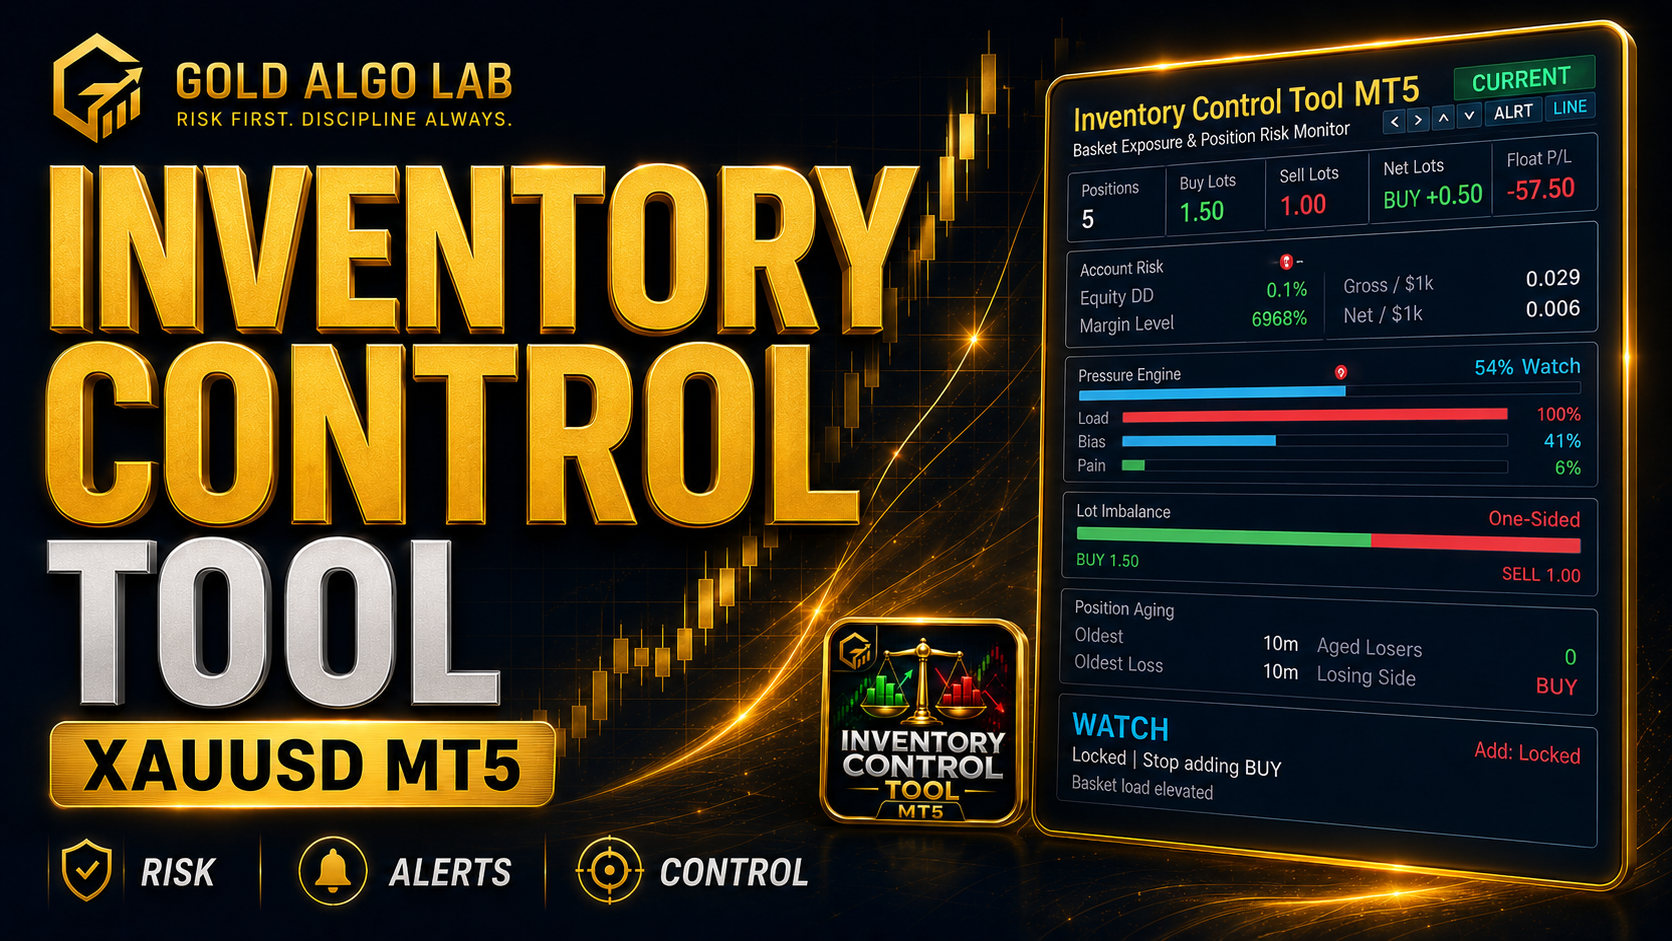
🔔 The Problem
Many XAUUSD traders don't fail because of one oversized entry. They fail because exposure builds gradually as they continue adding to a basket that was already stretched - and there was no clean way to see it in real time.
You put on a buy. Price dips, so you add another. It dips again - and now there's a part of your brain that says "it has to bounce from here" - so you add a third. Then a fourth. You're not trading anymore. You're averaging down with real money on a position that's slowly turning into a liability.
The problem isn't the individual trades. It's that you had no honest read on your total basket state when you clicked buy the third time.
How loaded is the basket right now? How lopsided is it? Which side is older and bleeding more? Is your float already at a pain level where one more adverse move triggers an emotional decision?
These are the questions that matter most when you're managing multiple open positions on gold. And the default MT5 interface gives you almost none of the answers. You get a list of open trades, a floating P&L number, and a lot of guesswork.
That's the environment where most XAUUSD basket losses happen - not from a bad entry, but from adding into a basket that was already in trouble, without knowing it.
🏆 The Real Engine
What separates this tool from a simple position counter is the Pressure Engine - a three-component composite score that evaluates your basket's real-time stress level across three independently measured dimensions.
Rather than showing you raw numbers and leaving interpretation to you, the Pressure Engine continuously evaluates three basket metrics together: how loaded your basket is relative to your account size, how directionally one-sided it has become, and how much unrealized pain is already sitting in the float. These three measurements combine into a single pressure score - and that score drives the output the tool displays across the panel.
The tool produces three distinct outputs from this:
✨ Pressure Level - the raw alert state: Watch, Danger, or Critical. This is the early-warning system.
✨ Inventory Headline - the overall basket assessment: Stable, Watch, Reduce, or Danger. This is the panel's top-line verdict.
✨ Add State - the actionable guidance: Free, Controlled, Cautious, or Locked. This is what tells you what to do next about adding to the basket.
These are three separate outputs, not three names for the same thing. Understanding them as a set is what makes the panel genuinely readable under pressure rather than just decorative.
🔎 What the Tool Shows
🎖️ Live Basket Snapshot
The top of the panel gives you the full picture at a glance: total position count, BUY lots, SELL lots, net lots and direction, and floating P&L. The panel refreshes automatically with each incoming market tick, so the numbers you see reflect current conditions rather than a snapshot from a few seconds ago.
🎖️ Account-Scaled Risk View
Gross and net lot exposure are shown relative to your actual account equity - not as abstract numbers. Importantly, this calculation is dynamic: as your floating drawdown increases, your equity decreases, which in turn tightens the lot density thresholds in real time. You're not being measured against a fixed baseline. You're being measured against what your account can actually absorb right now. Equity drawdown percentage, margin level, and lot density per $1,000 in capital are all visible in one block.
🎖️ Pressure Engine with Three Bars
The Load bar shows how heavy your total lot exposure is relative to your configured limits. The Bias bar reflects how one-sided the basket has become between BUY and SELL. The Pain bar captures the floating loss pressure relative to your reference pain level. Together they produce the composite Pressure Score and the Watch / Danger / Critical state that drives the headline message at the top of the panel.
🎖️ Lot Imbalance Bar
A visual bar that shows BUY lots on one side and SELL lots on the other. When the basket is balanced, it reads clearly. When it's leaning hard in one direction, the color shifts and the label reads One-Sided - a clean flag that your basket is no longer neutral and that adding more to the dominant side requires justification.
🎖️ Position Aging
How long has your oldest position been open? How long has your oldest losing position been sitting there? Which side is carrying the oldest loss? These three numbers - shown as minutes - can provide useful context that raw floating P&L obscures, especially when you're managing several trades opened at different points across the session. A trade that has been bleeding for 90 minutes is a different kind of problem than one that's been open for 5.
🎖️ Inventory Guidance
At the bottom of the panel, the tool synthesizes everything and displays its assessment: the Inventory Headline (Stable / Watch / Reduce / Danger), the Add State (Free / Controlled / Cautious / Locked), and a plain-English action note. In the screenshot at the top of this post, it reads: "WATCH - Locked | Stop adding BUY - Basket load elevated." That's the panel surfacing a condition that deserves attention before you make the next move.
🎖️ Optional Chart Lines
Average buy price, average sell price, and net basket break-even can be drawn directly on the chart. These give you a visual reference for where the basket as a whole needs price to reach before it's profitable - useful context when you're managing multiple positions across different entry levels. Note that the break-even line is an approximation; it does not factor in swap, commission, or slippage from execution.
🌟 What This Looks Like in Real Trading
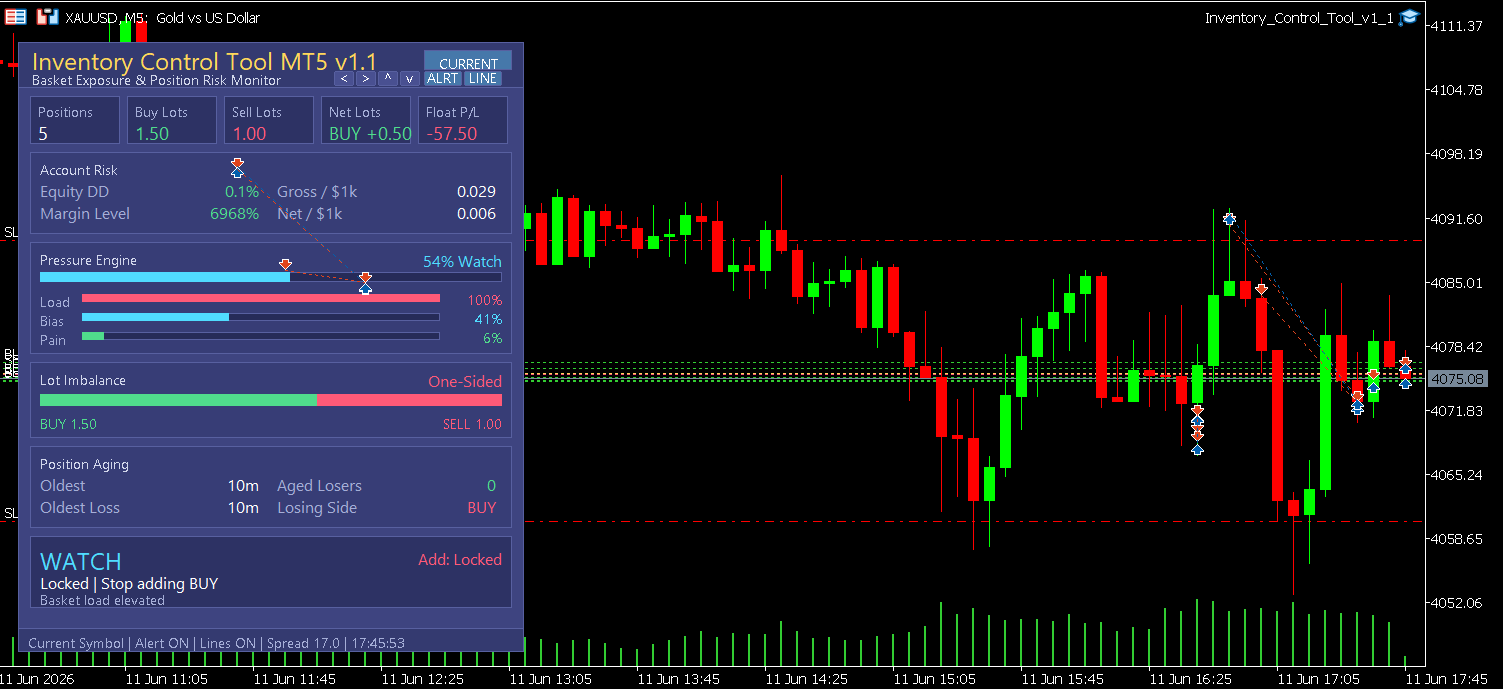
The screenshot at the top of this post was taken from a live XAUUSD M5 chart on June 11, 2026.
At that moment, the basket had 5 positions open: 1.50 BUY lots versus 1.00 SELL lots, with net exposure sitting at BUY +0.50. Floating P&L was −$57.50. The Pressure Engine showed Load at 100%, Bias at 41%, and Pain at a relatively low 6%. The Lot Imbalance block was flagging One-Sided, with BUY clearly dominant.
The composite pressure score had reached 54% - the panel classified this as WATCH territory - and the Add State had locked: "Stop adding BUY. Basket load elevated."
That's not a catastrophic situation. But it's exactly the kind of moment where a trader without this context would look at the chart, see what looks like a potential bounce, and add another BUY - pushing the basket into genuinely more difficult territory. The tool isn't telling you the trade is wrong. It's telling you the basket is already full on that side, and adding more without acknowledging that fact is how small losses become large ones.
That's the scenario this tool was built for.
🚀 Practical Advantages Worth Noting
Works across all account sizes. The risk scaling is relative to your equity, so the thresholds that trigger Watch and Danger states are calibrated dynamically to what your account can absorb - not generic fixed values. Micro-account users may want to review the default lot density settings, as the conservative defaults are calibrated with standard account sizing in mind.
Runs on any setup. The panel uses AUTO_SAFE layout mode by default, which reads your chart window dimensions and adjusts the panel to fit correctly - whether you're on a laptop, a VPS, or an RDP session. It won't overflow your chart or clip data on lower-resolution remote screens.
Scope flexibility. You can monitor your current symbol only, all open positions across every instrument on the account, positions from a specific magic number, or manual trades only. If you run an EA alongside manual trades, the scopes let you track them separately.
Quiet by default. Watch-level alerts update the panel without firing popups unless you specifically enable that behavior. Danger and Critical alerts have independently configurable popup, push notification, email, and sound options. You control which states break into your focus and which ones run silently in the background.
Position saves. The panel remembers where you placed it across sessions, so you don't need to reposition it every time you restart the terminal.
🎁 Who This Is For
You'll get real value from this tool if you trade XAUUSD with any basket approach - whether that's a deliberate hedge structure, a manually managed grid, or simply a habit of adding to positions when price moves against you. It also suits scalpers who open multiple trades across a session and want a consolidated read on total exposure without scrolling the Positions tab.
Risk-conscious traders who already know what they're doing will find it helps organize their decision-making at the margins - particularly the moment before they consider adding to a basket that's already partway through a session. The tool provides a more consolidated basket view than the standard MT5 Positions tab, and the Add State guidance gives you a second opinion based on your own configured thresholds.
📢 Who This Is NOT For
If you run a fully automated EA without any manual intervention, this tool adds limited value - it's designed for active decision points, not passive monitoring of a running system. It also won't help you if you're looking for entry signals, trend filters, or pattern recognition. This isn't an indicator. It's a basket management monitor.
📝 What It Doesn't Do
It does not open, close, or modify any trades. There is no automation, no grid logic, no martingale, no automatic stop loss placement. It does not give you buy or sell entry signals. It does not predict where price is going. It monitors what your basket is doing right now and provides a structured read on whether the conditions support adding more exposure or whether a pause is warranted. The Add State guidance is informational - what you do with it is entirely your decision.
🎁 Get the Tool
👉 Inventory Control Tool MT5 on MQL5 Market: https://www.mql5.com/en/market/product/170213
If you've ever added a position to a basket that was already too heavy - and only understood that afterward - this is the tool that gives you that read in real time, before the next click.
🧰 Related Tools
If you're managing basket risk actively, the Equity Protector Pro MT5 is the natural complement - it monitors your account-level drawdown in real time and gives you a hard circuit breaker at thresholds you define. Where the Inventory Control Tool reads your basket's internal state, Equity Protector Pro watches the account boundary.
For traders who want session context alongside basket monitoring, the Gold Session Box MT5 marks the high-low ranges of London, New York, and Asian sessions directly on the chart. Knowing which session you're in when the Add State hits Locked changes how you interpret that signal.
And if you want a cleaner read on market regime before you open the first position in a basket, Gold Bias Regime Filter classifies current conditions - trending, ranging, or transitioning - so you're not building directional exposure against the dominant structure without knowing it.
❓ FAQ
✅ Does this work with Expert Advisors running at the same time? Yes. Set the scope to Magic Number to monitor only the EA's positions, Manual Only for just your manual trades, or All Symbols to see the combined basket across everything on the account. Each scope gives you a clean, separated view.
✅ Will it close my positions if the basket gets too heavy? No. The tool is read-only. It monitors and alerts. All trade decisions remain with you.
✅ Does the panel work on VPS or RDP sessions? Yes. v1.2 includes the AUTO_SAFE responsive layout, which detects chart window dimensions and scales the panel accordingly, including on lower-resolution remote desktop environments.
✅ What's the difference between the Pressure Level, Inventory Headline, and Add State? These are three separate outputs. The Pressure Level (Watch/Danger/Critical) is the raw alert state from the Pressure Engine - how stressed the basket is on a composite score. The Inventory Headline (Stable/Watch/Reduce/Danger) is the panel's overall basket assessment. The Add State (Free/Controlled/Cautious/Locked) is the actionable guidance - what the tool recommends about adding more positions right now. Reading them together gives you a complete picture of the basket.
✅ Can I use this on instruments other than XAUUSD? The tool is designed and calibrated for XAUUSD, but it will function on any MT5 symbol since it reads position data directly from the account. The lot density thresholds and pain reference inputs may need adjustment for instruments with different contract sizes or volatility profiles. If you're monitoring a multi-symbol basket, note that the All Symbols scope aggregates everything - so threshold calibration matters more in that mode.
✅ Can I monitor my entire account basket at once, not just one chart? Yes. Set the scope to All Symbols and the panel aggregates all open positions across every instrument on the account into a single basket view. If you trade multiple symbols, review your lot density thresholds to account for the cumulative exposure across different asset classes.
✅ What happens to the alert thresholds if my account balance changes significantly? The account-scaled risk view is calculated dynamically against current equity, not a fixed balance snapshot. As your equity changes - from deposits, withdrawals, or floating P&L - the lot density thresholds recalibrate automatically. This means the Pressure Engine is always measuring against what your account can actually absorb in real time.
🎁 New to Gold Algo Lab?
Start with the Gold Algo Lab Tool Map - a practical guide that organizes our MT5 tools into 6 connected stages: market context, setup selection, risk planning, trade execution, position management and account protection.
→ Gold Algo Lab Tool Map: Where to Actually Start With MT5 Tools for XAUUSD
https://www.mql5.com/en/blogs/post/771930
Do not choose a tool by its name alone. Start with the part of your trading process that needs the most control, then build your workflow one layer at a time.
Gold Algo Lab builds practical, risk-first MT5 tools for serious XAUUSD traders, shaped by 8 years of developing and trading real systems to help traders identify clearer setups, manage risk with greater confidence and execute with more discipline.