
GBPUSD Price Action Analysis - Fibo support level breaking to the next bearish target
5 September 2015, 18:11

1
2 370
W1 price is located below 200 period SMA (200-SMA) and 100 period SMA (100-SMA) for ranging between the following levels:
- 1.4565 support level located far below 100-SMA/200-SMA in the primary bearish area of the chart, and
- Fibo resistance level at 1.5929 located on the border between the bearish/bullish trend near 100-SMA/200-SMA values on the chart.
RSI indicator is estimating the bearish trend to be continuing.
- If the price will break 1.5929 resistance level so we may see
the bullish trend to be started on this timeframe: the price will break
100-SMA and 200-SMA from below to above to come to the bullish area of
the chart.
- If price will break 1.4565 support so the bearish trend will be continuing in good breakdown way.
- If not so the price will be ranging within the levels.
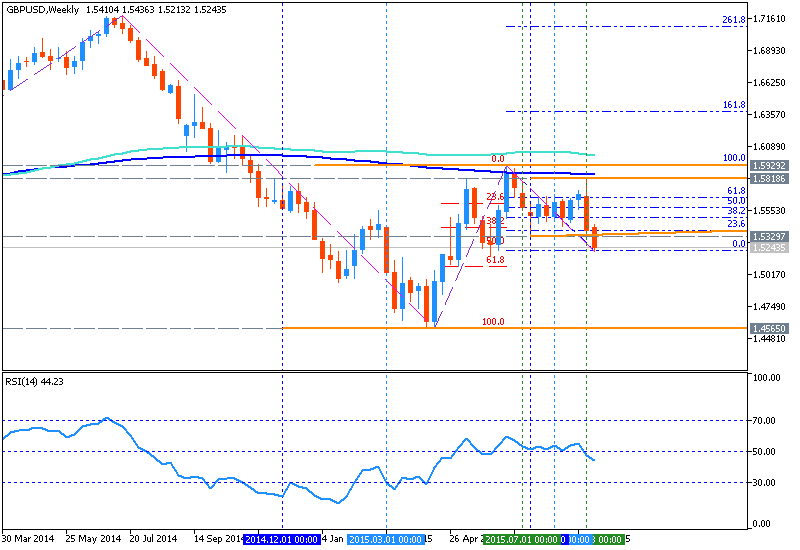
Trend:
- W1 - bearish


 Trading Guide")

