
Technical Price Action Analysis - EURGBP bullish reversal with symmetric triangle to be broken
2 September 2015, 10:29

0
1 058
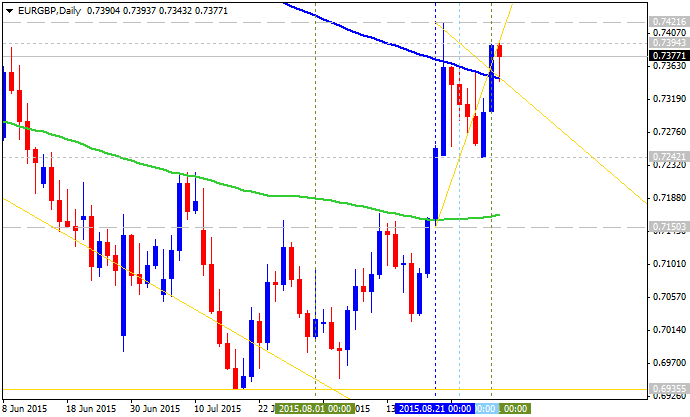
D1 price is on primary bullish market condition: the price crossed 200-day SMA from below to above and located in primary bullish area of the chart. Symmetric triangle pattern was formed by the price to be crossed for the bullish trend to be continuing.
- The price is ranging between 0.7150 key bearish support level and 0.7421 key bullish resistance level.
- Symmetric triangle pattern was formed by the price to be crossed for the bullish trend to be continuing.
- "Looking ahead, near-term resistance comes in at 0.7432, the 38.2% Fibonacci expansion. A break above this barrier on a daily closing basis exposes the 0.7482-90 area, marked by the June 5 high and the 50% level."
- "The long-term EURGBP trend has favored weakness since prices topped in
December 2008. With that in mind, any near-term gains appear corrective
and our preference is to stand aside while those moves play out, waiting
for an actionable selling opportunity to emerge."
Trend:
- H4 - bullish
- D1 - bullish reversal
- W1 - bear market rally
- MN1 - bear market rally


 & AMD Framework")
")