

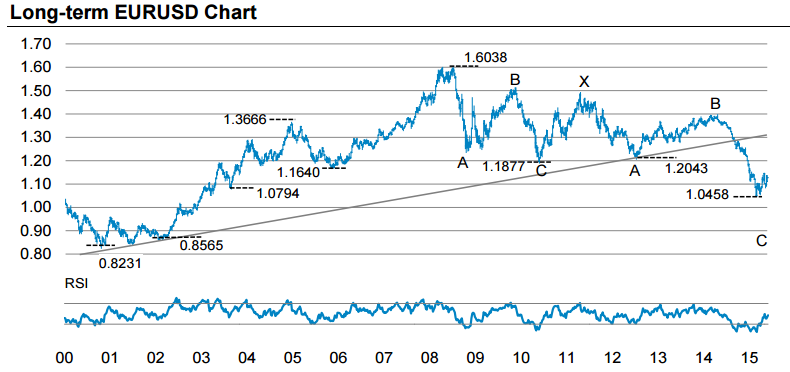
Long-term EURUSD Chart
"Despite the corrective rebound developed since early March, EURUSD remains within a long term down trend, which accelerated from June of last year. Indeed, this move lower over the past year forms part of a C wave decline within a broad multi year corrective structure which has developed since the 1.6038 peak of 2008. The pace of decline over the past year is typical for a C wave. This suggests upside potential is limited for EURUSD".
2-Year EURUSD Chart
"The sub-structure of the decline from June of last year has been “impulsive”, with a 3 rd wave within the C wave now developing. The subsequent recovery since March has developed a clear 3-wave corrective structure, which now looks to have been completed at the 1.1467 mid-May peak (4th wave top within wave (3). This implies the next stage of the EURUSD decline (5th wave within wave (3)) is now likely to unfold".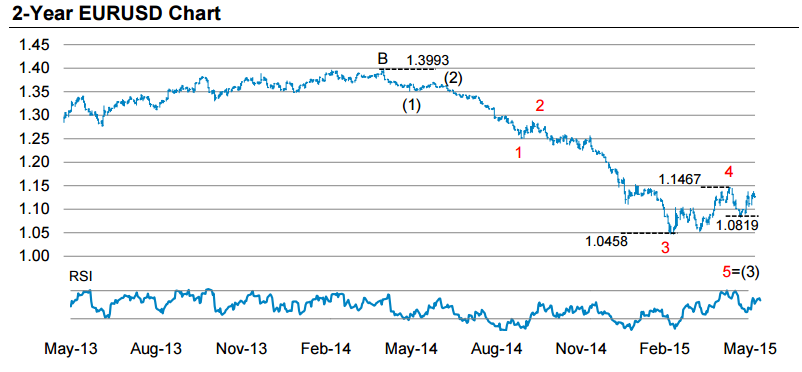
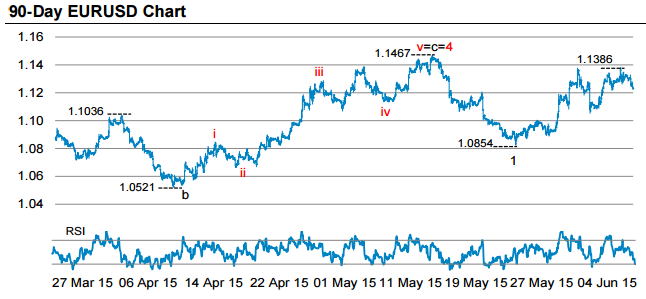
90-Day EURUSD Chart
"This bearish interpretation will be confirmed by a move below 1.1005, suggesting the next impulse decline is set to take EURUSD below the 1.0854 level and back to the 1.0458 March low. This even implies a move to new lows with potential for a decline below parity over the medium term. Near-term risk to this scenario is a move above 1.1467, which would suggest another corrective leg higher before the downtrend resumes".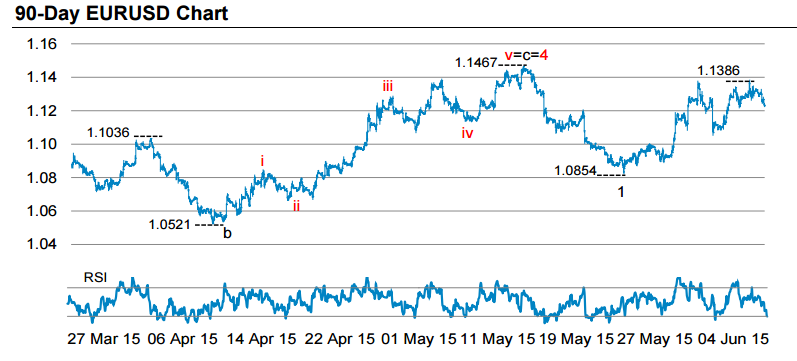


")
![[XAUUSD]: Weekly Liquidity Activation Points (timings), June 22-26, 2026](https://c.mql5.com/6/1013/splash-preview-771790.png "[XAUUSD]: Weekly Liquidity Activation Points (timings), June 22-26, 2026")
