
Technical Analysis for EURUSD, GBPUSD, AUDUSD, USDCAD, NZDUSD, USDJPY and USDCHF: USDJPY registers 6 year high & EURUSD 13 Year Trendline in Support
6 September 2014, 22:11

0
2 352
EUR/USD
Monthly
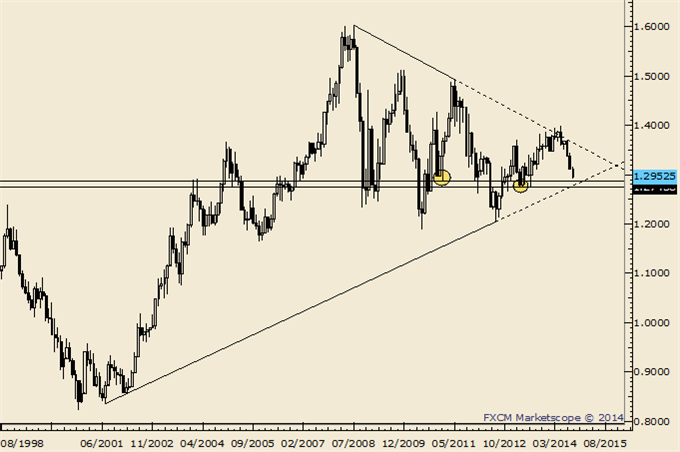
Monthly
- “Long term, a failed breakout and top would keep with the pattern of 3 year cycle tops. The break of 1.3476 completed a topping process with targets of 1.3294 (origin of diagonal), 1.3209 (2 equal legs), and 1.3012 (head and shoulders target).
- ”EURUSD crashed through all the objectives. I was surprised that 1.3020 (50% from 2012) didn’t influence but an even bigger zone rests slightly below the current level. The zone in question is defined by long term trendline support along with the 2011 and 2013 lows (circled) at 1.2873 and 1.2744. These levels straddle the 61.8% retracement of the advance from the 2012 low at 1.2787. The much anticipated squeeze may be in order from this zone.
GBP/USD
Weekly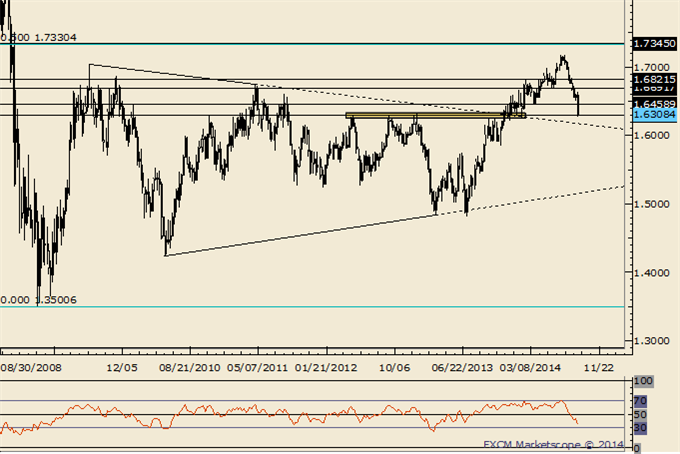
- “Of note is a weekly outside reversal and weekly RSI rolling over from above 70 this week. Prior instances of RSI rolling over (2004, 2006, and 2007) from above 70 indicated tops of at least several months. Major support comes in from the 3 peaks in 2012 and this year’s low at 1.6250-1.6340.”
- It’s only taken 2 months for GBPUSD to drop into its major support zone. Near term momentum (daily RSI) is at a level that has only been reached several times in recent history, 2012 (one day) and 2008 (throughout August and September and once in October). Readings this low were more common (but not common) during the heady trend following days of the 70s and 80s. A period of consolidation is favored.
AUD/USD
Weekly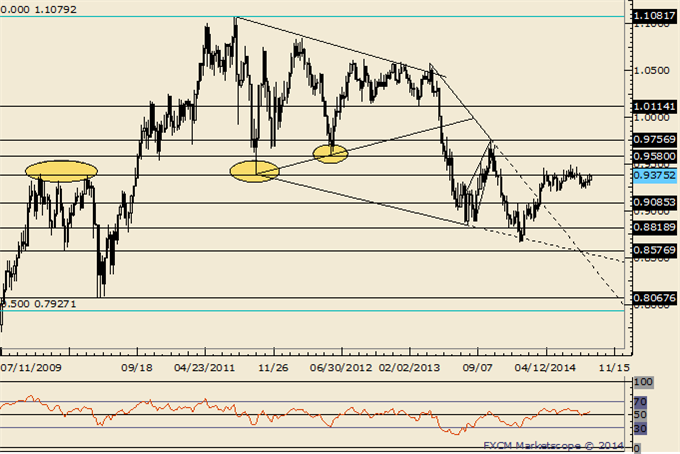
- “The combination of the .9400 figure and weekly RSI failing near 60 indicates a lot of overhead to punch through. Since the 2011 top, each RSI failure near 60 has led to a top or topping process (range for several weeks then a breakdown...that may be the case now).”
- The failure of AUDUSD to break down in the face of a broad USD advance underscores bullish potential. Any reversal towards USD weakness could facilitate the next leg in the bull trend that began at the January low. .9200 needs to hold in order to look higher.
NZD/USD
Monthly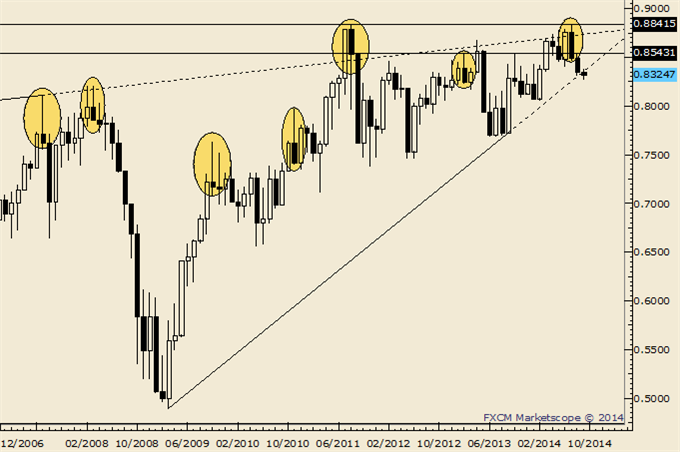
- “Don’t forget about the line that extends off of the 1996 and 2007 highs. That line crosses through the 2008, 2011, and highs as well. In 2011 (record free float high), the rate surged through the line in late July before topping on August 1st. The rate reversed this week from pips below the record high and above the mentioned line.”
- “Above .8534 is needed in order to suggest that at least a minor low is in place. Look lower as long as price is below that level. Exceeding .8534 would shift focus to .8600/50. I’ve highlighted monthly key reversals (filtered with a range condition). Focus on .8250/75 as support.” The late week response at the cited zone along with waning momentum on several time frames warn of a turn higher.
USD/JPY
Weekly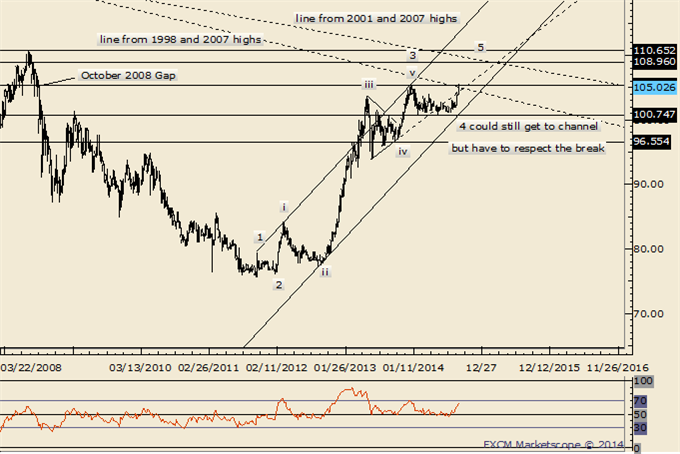
- “Treat wave 4 as complete as long as price is above 102.50 (103.00/30 is support). That means new highs in wave 5 (then risk of a major decline but don’t forget that ‘5ths’ can extend). 104.75 is a near term target.”
- 104.75 was reached and USDJPY continued on to its best level in almost exactly 6 years on Friday. Several key reversals this week indicate strong resistance and a likely pause in the bull move. In other words, expect USDJPY to consolidate before its next rally attempt. 104.25 is support.
USD/CAD
Weekly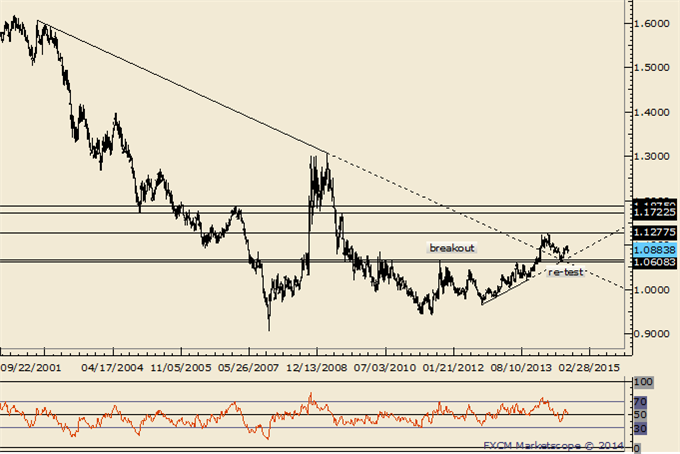
- “USDCAD has fallen apart which ironically means it is probably going to find some sort of low soon. The rate is nearing important price levels. The 2011 high at 1.0657 and current year open at 1.0634 are possible supports. The line that extends off of the 2012 and September 2013 lows is at about 1.0607 next week. This level is in line with the July 2013 high at 1.0608.” USDCAD ended up finding low at 1.0620.
- The USDCAD dip from 1.0997 found support at the 50% retracement of the 1.0620-1.0997 advance (the 61.8% is at 1.0764). The hold is a positive sign and I lean towards the upside although a break above 1.0997 is needed in order to resolve a period of consolidation (5 weeks so far).
USD/CHF
Weekly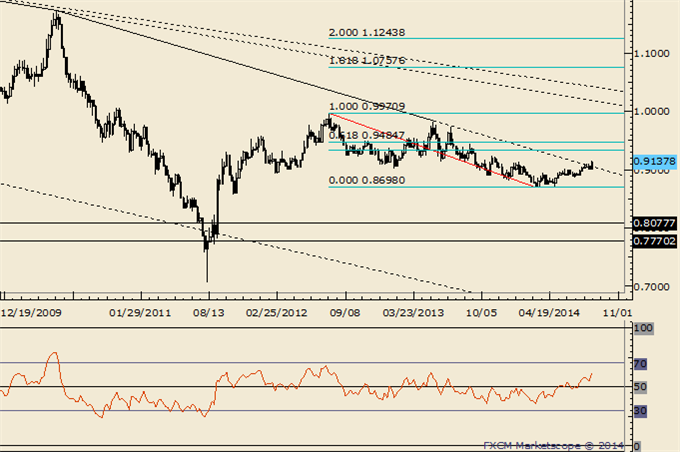
- “There is a trendline that extends off of the 1985 and 2001 highs near .9400). The nearly 30 year trendline splits the 50% and 61.8% retracements of the decline from the 2012 high (.9335 and .9485). The rate could press higher into month end towards this zone before reversing.” On Friday, USDCHF traded into the 50% retracement at .9334. Consolidation may take hold but momentum considerations suggest that any weakness will prove temporary.


")
![[XAUUSD]: Weekly Liquidity Activation Points (timings), June 22-26, 2026](https://c.mql5.com/6/1013/splash-preview-771790.png "[XAUUSD]: Weekly Liquidity Activation Points (timings), June 22-26, 2026")
