

Prices moved lower as expected after putting in a bearish Evening Star candlestick pattern at the top of a rising
channel set from mid-April.
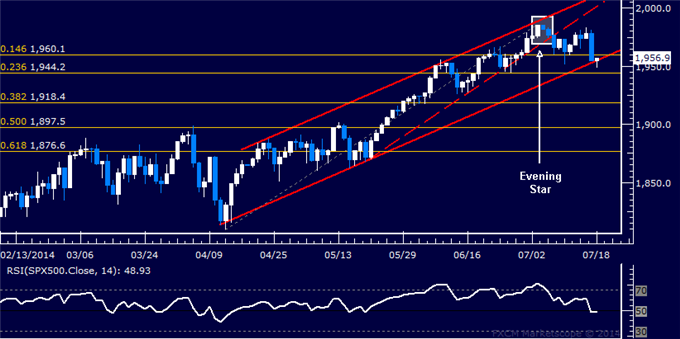
Sellers are testing support in the 1954.20, marked by a rising channel bottom set from early April. A break below that on a daily closing basis exposes the 23.6% Fibonacci retracement at 1944.20. Alternatively, a move back above the 14.6% level at 1960.10 aims for the July 3 high at 1985.90.


![[XAUUSD]: Weekly Liquidity Activation Points (timings), June 22-26, 2026](https://c.mql5.com/6/1013/splash-preview-771790.png "[XAUUSD]: Weekly Liquidity Activation Points (timings), June 22-26, 2026")
