Technical Candlestick Pattern Analysis for US Dollar, S&P 500, Gold and Crude Oil -

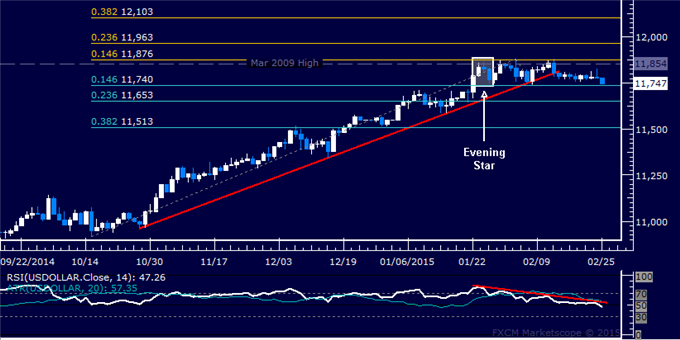
US DOLLAR TECHNICAL ANALYSIS
Prices look to be reversing
downward as expected after putting in a bearish Evening Star candlestick
pattern. A daily close below the 14.6% Fibonacci retracementat 11740
exposes the 23.6% level at 11653.
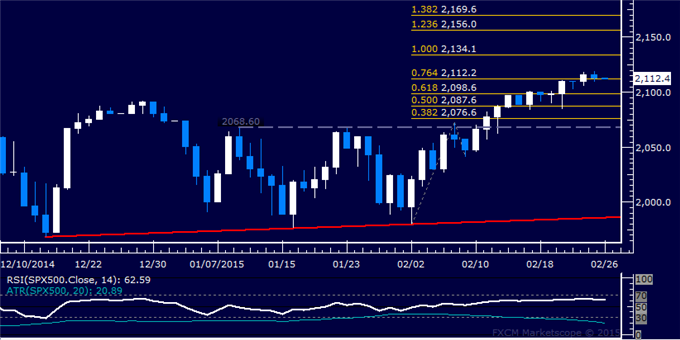
S&P 500 TECHNICAL ANALYSIS
Prices paused to digest gains
after advancing to yet another record high. A daily close above the 100%
Fibonacci expansion at 2134.10 exposes the 123.6% level at 2156.00.
Alternatively, a reversal below the 76.4% Fib at 2112.20 targets the
61.8% expansion at 2098.60.
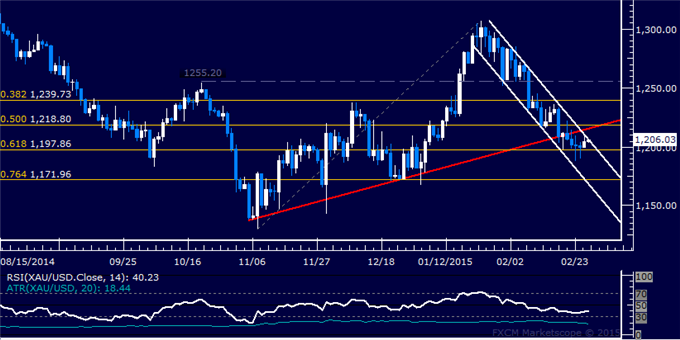
GOLD TECHNICAL ANALYSIS
Prices has stalled above interim
support at 1197.86, the 61.8% Fibonacci retracement. A break above
channel top resistance at 1205.30 exposes the 1215.63-18.00 area (trend
line support-turned-resistance, 50% level). Alternatively, a turn below
1197.86 targets the intersection of channel floor support and the 76.4%
Fib at 1171.96.
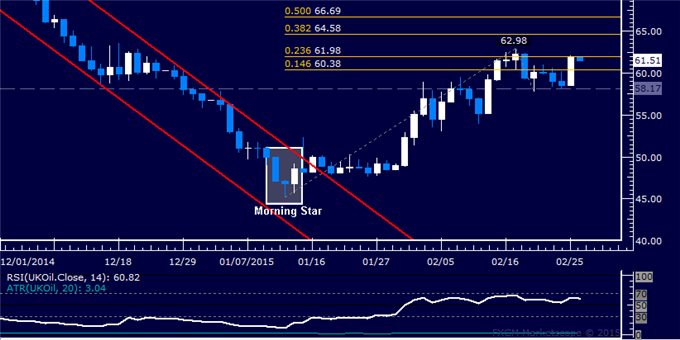
CRUDE OIL TECHNICAL ANALYSIS
Prices launched a recovery as
expected, with buyers now attempting to reclaim momentum after a brief
pullback. A break above the 23.6% Fibonacci expansion at 61.98 exposes
the February 17 high at 62.98, followed by the 38.2% level at 64.58.
Alternatively, a reversal below the 14.6% Fib at 60.38 targets
resistance-turned-support at 58.17.