Pattern Analysis for US Dollar, S&P 500, Gold and Grude Oil - Gold Flat-Lining, Crude Oil Trying to Bounce After $80.00, S&P 500 Rally

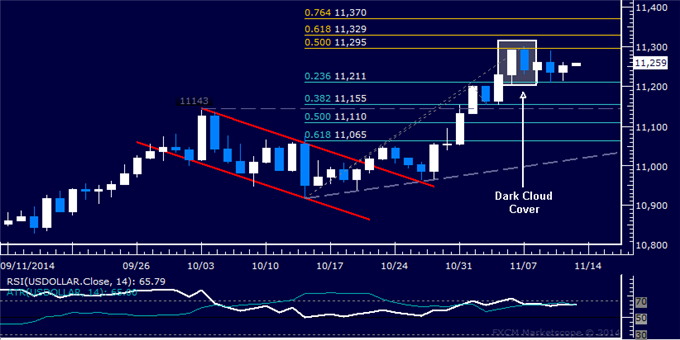
US DOLLAR TECHNICAL ANALYSIS
Prices may be gearing up for a
turn lower after prices produced a bearish Dark Cloud Cover candlestick
pattern. Near-term support is at 11211, the 23.6% Fibonacci retracement,
with a break below that on a daily closing basis exposing the 11143-55
area.
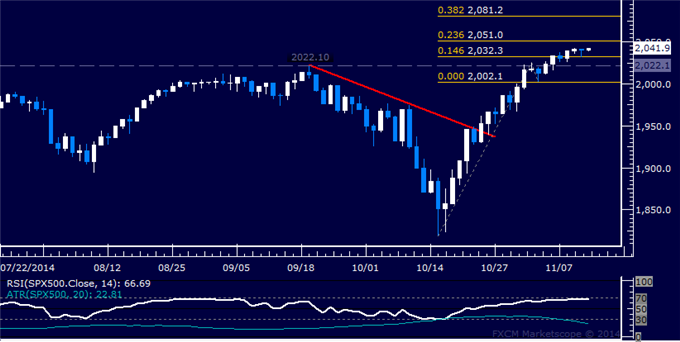
S&P 500 TECHNICAL ANALYSIS
Prices appear poised to move to
another record high, challenging resistance marked by the 23.6%
Fibonacci expansion at 2051.00. A break above this barrier on a daily
closing basis exposes the 38.2% level at 2081.20.
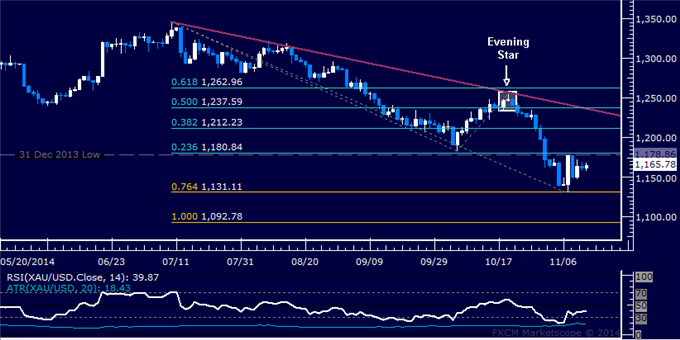
GOLD TECHNICAL ANALYSIS
Prices are treading water below
resistance in the 1178.86-80.84 area marked by the December 2013 low and
the 23.6% Fibonacci retracement. Near-term support is at 1131.11, the
76.4% Fibonacci expansion, with a break below that on a daily closing
basis exposing the 100% level at 1092.78.
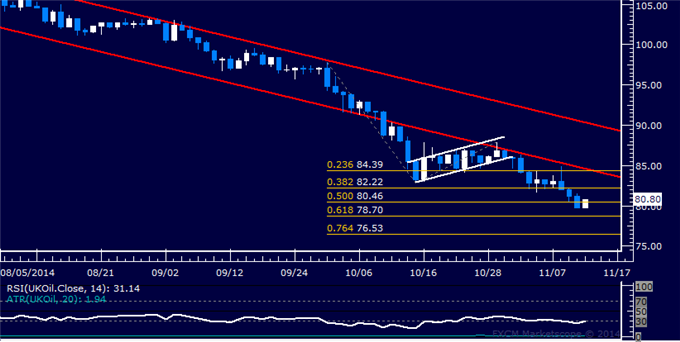
CRUDE OIL TECHNICAL ANALYSIS
Prices are attempting to mount a
recovery after setting yet another four-year low. A daily close back
above the 50% Fibonacci expansion at 80.46 exposes the 38.2% level at
82.22. Alternatively, downward resumption through the 61.8% Fib at 78.70
targets the 76.4% expansion at 76.53.