
Developing a Replay System — Market simulation (Part 12): Birth of the SIMULATOR (II)
Developing a simulator can be much more interesting than it seems. Today we'll take a few more steps in this direction because things are getting more interesting.

Developing a Replay System — Market simulation (Part 11): Birth of the SIMULATOR (I)
In order to use the data that forms the bars, we must abandon replay and start developing a simulator. We will use 1 minute bars because they offer the least amount of difficulty.

How to create a simple Multi-Currency Expert Advisor using MQL5 (Part 3): Added symbols prefixes and/or suffixes and Trading Time Session
Several fellow traders sent emails or commented about how to use this Multi-Currency EA on brokers with symbol names that have prefixes and/or suffixes, and also how to implement trading time zones or trading time sessions on this Multi-Currency EA.
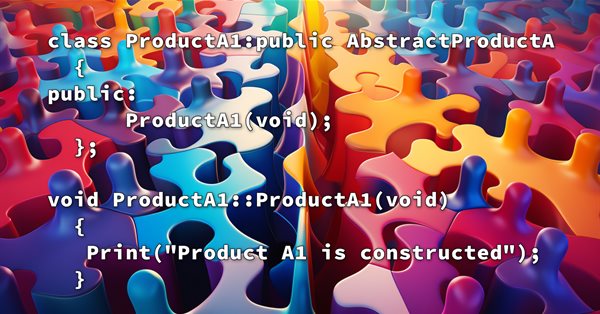
Design Patterns in software development and MQL5 (Part I): Creational Patterns
There are methods that can be used to solve many problems that can be repeated. Once understand how to use these methods it can be very helpful to create your software effectively and apply the concept of DRY ((Do not Repeat Yourself). In this context, the topic of Design Patterns will serve very well because they are patterns that provide solutions to well-described and repeated problems.

Integrate Your Own LLM into EA (Part 2): Example of Environment Deployment
With the rapid development of artificial intelligence today, language models (LLMs) are an important part of artificial intelligence, so we should think about how to integrate powerful LLMs into our algorithmic trading. For most people, it is difficult to fine-tune these powerful models according to their needs, deploy them locally, and then apply them to algorithmic trading. This series of articles will take a step-by-step approach to achieve this goal.

Discrete Hartley transform
In this article, we will consider one of the methods of spectral analysis and signal processing - the discrete Hartley transform. It allows filtering signals, analyzing their spectrum and much more. The capabilities of DHT are no less than those of the discrete Fourier transform. However, unlike DFT, DHT uses only real numbers, which makes it more convenient for implementation in practice, and the results of its application are more visual.

Integrate Your Own LLM into EA (Part 1): Hardware and Environment Deployment
With the rapid development of artificial intelligence today, language models (LLMs) are an important part of artificial intelligence, so we should think about how to integrate powerful LLMs into our algorithmic trading. For most people, it is difficult to fine-tune these powerful models according to their needs, deploy them locally, and then apply them to algorithmic trading. This series of articles will take a step-by-step approach to achieve this goal.

Learn how to deal with date and time in MQL5
A new article about a new important topic which is dealing with date and time. As traders or programmers of trading tools, it is very crucial to understand how to deal with these two aspects date and time very well and effectively. So, I will share some important information about how we can deal with date and time to create effective trading tools smoothly and simply without any complicity as much as I can.

Developing a Replay System — Market simulation (Part 07): First improvements (II)
In the previous article, we made some fixes and added tests to our replication system to ensure the best possible stability. We also started creating and using a configuration file for this system.

Understanding order placement in MQL5
When creating any trading system, there is a task we need to deal with effectively. This task is order placement or to let the created trading system deal with orders automatically because it is crucial in any trading system. So, you will find in this article most of the topics that you need to understand about this task to create your trading system in terms of order placement effectively.

OpenAI's ChatGPT features within the framework of MQL4 and MQL5 development
In this article, we will fiddle around ChatGPT from OpenAI in order to understand its capabilities in terms of reducing the time and labor intensity of developing Expert Advisors, indicators and scripts. I will quickly navigate you through this technology and try to show you how to use it correctly for programming in MQL4 and MQL5.

Improve Your Trading Charts With Interactive GUI's in MQL5 (Part III): Simple Movable Trading GUI
Join us in Part III of the "Improve Your Trading Charts With Interactive GUIs in MQL5" series as we explore the integration of interactive GUIs into movable trading dashboards in MQL5. This article builds on the foundations set in Parts I and II, guiding readers to transform static trading dashboards into dynamic, movable ones.
Everything you need to learn about the MQL5 program structure
Any Program in any programming language has a specific structure. In this article, you will learn essential parts of the MQL5 program structure by understanding the programming basics of every part of the MQL5 program structure that can be very helpful when creating our MQL5 trading system or trading tool that can be executable in the MetaTrader 5.

Understanding functions in MQL5 with applications
Functions are critical things in any programming language, it helps developers apply the concept of (DRY) which means do not repeat yourself, and many other benefits. In this article, you will find much more information about functions and how we can create our own functions in MQL5 with simple applications that can be used or called in any system you have to enrich your trading system without complicating things.
Creating Graphical Panels Became Easy in MQL5
In this article, we will provide a simple and easy guide to anyone who needs to create one of the most valuable and helpful tools in trading which is the graphical panel to simplify and ease doing tasks around trading which helps to save time and focus more on your trading process itself without any distractions.

Understanding MQL5 Object-Oriented Programming (OOP)
As developers, we need to learn how to create and develop software that can be reusable and flexible without duplicated code especially if we have different objects with different behaviors. This can be smoothly done by using object-oriented programming techniques and principles. In this article, we will present the basics of MQL5 Object-Oriented programming to understand how we can use principles and practices of this critical topic in our software.
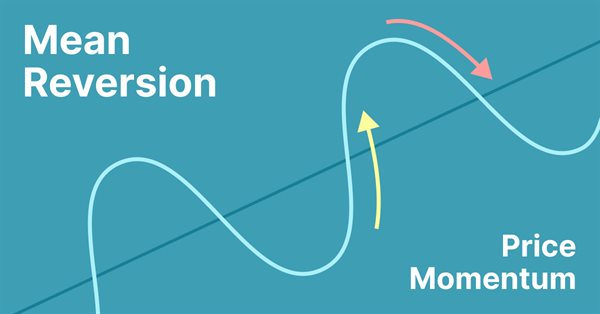
Simple Mean Reversion Trading Strategy
Mean reversion is a type of contrarian trading where the trader expects the price to return to some form of equilibrium which is generally measured by a mean or another central tendency statistic.

Creating an EA that works automatically (Part 15): Automation (VII)
To complete this series of articles on automation, we will continue discussing the topic of the previous article. We will see how everything will fit together, making the EA run like clockwork.

Creating an EA that works automatically (Part 14): Automation (VI)
In this article, we will put into practice all the knowledge from this series. We will finally build a 100% automated and functional system. But before that, we still have to learn one last detail.

How to Become a Successful Signal Provider on MQL5.com
My main goal in this article is to provide you with a simple and accurate account of the steps that will help you become a top signal provider on MQL5.com. Drawing upon my knowledge and experience, I will explain what it takes to become a successful signal provider, including how to find, test, and optimize a good strategy. Additionally, I will provide tips on publishing your signal, writing a compelling description and effectively promoting and managing it.

Improve Your Trading Charts With Interactive GUI's in MQL5 (Part I): Movable GUI (I)
Unleash the power of dynamic data representation in your trading strategies or utilities with our comprehensive guide on creating movable GUI in MQL5. Dive into the core concept of chart events and learn how to design and implement simple and multiple movable GUI on the same chart. This article also explores the process of adding elements to your GUI, enhancing their functionality and aesthetic appeal.

Automated exchange grid trading using stop pending orders on Moscow Exchange (MOEX)
The article considers the grid trading approach based on stop pending orders and implemented in an MQL5 Expert Advisor on the Moscow Exchange (MOEX). When trading in the market, one of the simplest strategies is a grid of orders designed to "catch" the market price.

Creating an EA that works automatically (Part 13): Automation (V)
Do you know what a flowchart is? Can you use it? Do you think flowcharts are for beginners? I suggest that we proceed to this new article and learn how to work with flowcharts.

Rebuy algorithm: Math model for increasing efficiency
In this article, we will use the rebuy algorithm for a deeper understanding of the efficiency of trading systems and start working on the general principles of improving trading efficiency using mathematics and logic, as well as apply the most non-standard methods of increasing efficiency in terms of using absolutely any trading system.

Category Theory (Part 9): Monoid-Actions
This article continues the series on category theory implementation in MQL5. Here we continue monoid-actions as a means of transforming monoids, covered in the previous article, leading to increased applications.

Money management in trading
We will look at several new ways of building money management systems and define their main features. Today, there are quite a few money management strategies to fit every taste. We will try to consider several ways to manage money based on different mathematical growth models.
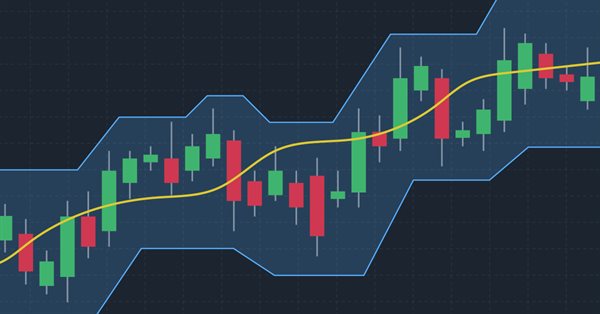
How to create a custom Donchian Channel indicator using MQL5
There are many technical tools that can be used to visualize a channel surrounding prices, One of these tools is the Donchian Channel indicator. In this article, we will learn how to create the Donchian Channel indicator and how we can trade it as a custom indicator using EA.
Understand and Use MQL5 Strategy Tester Effectively
There is an essential need for MQL5 programmers or developers to master important and valuable tools. One of these tools is the Strategy Tester, this article is a practical guide to understanding and using the strategy tester of MQL5.

Creating an EA that works automatically (Part 12): Automation (IV)
If you think automated systems are simple, then you probably don't fully understand what it takes to create them. In this article, we will talk about the problem that kills a lot of Expert Advisors. The indiscriminate triggering of orders is a possible solution to this problem.
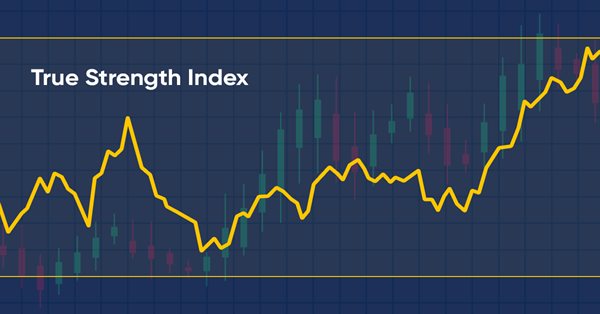
How to create a custom True Strength Index indicator using MQL5
Here is a new article about how to create a custom indicator. This time we will work with the True Strength Index (TSI) and will create an Expert Advisor based on it.

Creating an EA that works automatically (Part 11): Automation (III)
An automated system will not be successful without proper security. However, security will not be ensured without a good understanding of certain things. In this article, we will explore why achieving maximum security in automated systems is such a challenge.

Creating an EA that works automatically (Part 10): Automation (II)
Automation means nothing if you cannot control its schedule. No worker can be efficient working 24 hours a day. However, many believe that an automated system should operate 24 hours a day. But it is always good to have means to set a working time range for the EA. In this article, we will consider how to properly set such a time range.

Creating an EA that works automatically (Part 09): Automation (I)
Although the creation of an automated EA is not a very difficult task, however, many mistakes can be made without the necessary knowledge. In this article, we will look at how to build the first level of automation, which consists in creating a trigger to activate breakeven and a trailing stop level.

How to create a custom indicator (Heiken Ashi) using MQL5
In this article, we will learn how to create a custom indicator using MQL5 based on our preferences, to be used in MetaTrader 5 to help us read charts or to be used in automated Expert Advisors.

Take a few lessons from Prop Firms (Part 1) — An introduction
In this introductory article, I address a few of the lessons one can take from the challenge rules that proprietary trading firms implement. This is especially relevant for beginners and those who struggle to find their footing in this world of trading. The subsequent article will address the code implementation.
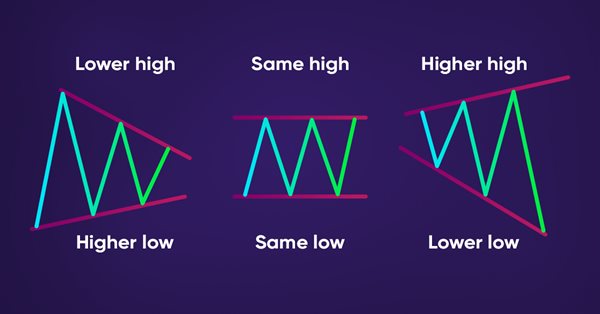
How to detect trends and chart patterns using MQL5
In this article, we will provide a method to detect price actions patterns automatically by MQL5, like trends (Uptrend, Downtrend, Sideways), Chart patterns (Double Tops, Double Bottoms).
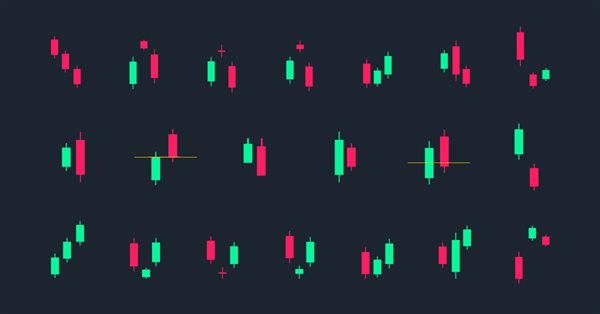
How to use MQL5 to detect candlesticks patterns
A new article to learn how to detect candlesticks patterns on prices automatically by MQL5.

Moral expectation in trading
This article is about moral expectation. We will look at several examples of its use in trading, as well as the results that can be achieved with its help.

Creating a comprehensive Owl trading strategy
My strategy is based on the classic trading fundamentals and the refinement of indicators that are widely used in all types of markets. This is a ready-made tool allowing you to follow the proposed new profitable trading strategy.

Creating an EA that works automatically (Part 08): OnTradeTransaction
In this article, we will see how to use the event handling system to quickly and efficiently process issues related to the order system. With this system the EA will work faster, so that it will not have to constantly search for the required data.