
Applying OLAP in trading (part 2): Visualizing the interactive multidimensional data analysis results
In the first article related to the use of OLAP techniques in trading, we considered the general multidimensional data processing principles and provided ready-to-use MQL classes, which enable the practical application of OLAP for account history or trading report processing. However we implemented a simplified output of results as a text in the Experts logs. For a more efficient visual representation, you need to create a new class, a child of the Display interface, which can visualize OLAP data using graphics. This task requires a lot of preparatory work and concerns many different aspects which are not related to the OLAP. So let's put aside data processing and let's focus on the graphical interface of the MQL program.
Several MQL libraries are available for the GUI implementation, including the Standard library of controls (Include/Controls). One of the noticeable drawbacks in almost all libraries is related to the fact that there are no means to automatically control the layout of elements in the window. In other words, positioning and alignment of elements is performed statically using hard-coded constants with the X and Y coordinates. There is another problem closely related to the first one: there is no visual design for screen forms. This is an even more difficult task, which is though not impossible. Since the interface is not the main topic within this project, it was decided not to focus on the screen form editor but to implement a simpler adaptive interface approach. Elements in this interface must be specially arranged in groups, which can automatically support correlated positioning and scaling rules.
The problem with the Standard Library is that its dialog windows have a fixed size. However, when rendering large OLAP hypercubes, it would be more convenient for the user to be able to maximize the window or at least to stretch it enough to fit the cell labels on the axes without overlapping.
Separate open GUI related developments are available in the mql5.com website: they address separate issues, but their complexity/capability ratio is far from optimal. Either the capabilities are limited (for example, a solution features a layout mechanism but does not provide scaling options), or integration requires a lot of effort (you have to read extensive documentation, learn non-standard methods, etc.). In addition, all other things being equal, it is better to use a solution based on standard elements, which are more common and popular (i.e. which are used in a larger number of MQL applications and therefore have a higher coefficient of utility).
As a result, I selected what seemed to be a simple technological solution, described in articles Using Layouts and Containers for GUI Controls: The CBox Class and Using Layouts and Containers for GUI Controls: The CGrid Class by Enrico Lambino.
In the first article, the controls are added to containers with the horizontal or vertical layout. They can be nested and thus provide arbitrary interface layout. The second article presents containers with the tabular layout. Both can work with all standard controls, as well as with any properly developed controls which are based on the CWnd class.
The solution only lacks dynamic window and container resizing. This will be the first step in solving the general problem.
"Rubber" windows
The CBox and CGrid classes are connected to projects as header files Box.mqh, Grid.mqh and GridTk.mqh. If you are using archives from the articles, install these files under the Include/Layouts directory.
Attention! The Standard Library already contains the CGrid structure. It is designed for drawing the chart grid. The CGrid container class is not related to this. The coincidence of names is unpleasant, but it is not critical.
We will fix a small error in the GridTk.mqh file and will make some additions in the Box.mqh file, after which we can proceed directly to improving the standard dialog class CAppDialog. Of course, we will not break the existing class. Instead, we will create a new class derived from CAppDialog.
The major changes concern the CBox::GetTotalControlsSize method (the relevant lines are marked with comments). You can compare the files from original projects with those attached below.
  void CBox::GetTotalControlsSize(void)
  {
    m_total_x = 0;
    m_total_y = 0;
    m_controls_total = 0;
    m_min_size.cx = 0;
    m_min_size.cy = 0;
    int total = ControlsTotal();

    for(int i = 0; i < total; i++)
    {
      CWnd *control = Control(i);
      if(control == NULL) continue;
      if(control == &m_background) continue;
      CheckControlSize(control);

      // added: invoke itself recursively for nested containers
      if(control.Type() == CLASS_LAYOUT)
      {
        ((CBox *)control).GetTotalControlsSize();
      }

      CSize control_size = control.Size();
      if(m_min_size.cx < control_size.cx)
        m_min_size.cx = control_size.cx;
      if(m_min_size.cy < control_size.cy)
        m_min_size.cy = control_size.cy;

      // edited: m_total_x and m_total_y are incremeted conditionally according to container orientation
      if(m_layout_style == LAYOUT_STYLE_HORIZONTAL) m_total_x += control_size.cx;
      else m_total_x = MathMax(m_min_size.cx, m_total_x);
      if(m_layout_style == LAYOUT_STYLE_VERTICAL) m_total_y += control_size.cy;
      else m_total_y = MathMax(m_min_size.cy, m_total_y);
      m_controls_total++;
    }

    // added: adjust container size according to new totals
    CSize size = Size();
    if(m_total_x > size.cx && m_layout_style == LAYOUT_STYLE_HORIZONTAL)
    {
      size.cx = m_total_x;
    }
    if(m_total_y > size.cy && m_layout_style == LAYOUT_STYLE_VERTICAL)
    {
      size.cy = m_total_y;
    }
    Size(size);
  }
In short, the modified version takes into account possible dynamic resizing of elements.
The test examples in the original articles included the Controls2 Expert Advisor (an analogue of the standard Controls project which is available in the standard MetaTrader delivery package, under the Experts\Examples\Controls\ folder) and the SlidingPuzzle2 game. Both container examples are located under the Experts\Examples\Layouts\ folder by default. Based on these containers, we will try to implement the rubber windows.
Create MaximizableAppDialog.mqh under Include\Layouts\. The window class will be inherited from CAppDialog
  #include <Controls\Dialog.mqh>
  #include <Controls\Button.mqh>

  class MaximizableAppDialog: public CAppDialog
  {
We need 2 new buttons with images: one to maximize the window (it will be located in the header, next to the Minimize button) and the other one for arbitrary resizing (in the lower right corner).
  protected:
    CBmpButton m_button_truemax;
    CBmpButton m_button_size;
The indication of the current maximized state or of the resizing process will be stored in the corresponding logical variables.
    bool m_maximized;
    bool m_sizing;
Also, let's add a rectangle, in which we will constantly monitor the chart size for the maximized state (so that the chart size also needs to be adjusted), as well as set a certain minimum size, which the window cannot be less than (the user will be able to set this limitation using the SetSizeLimit public method).
    CRect m_max_rect;
    CSize m_size_limit;
The newly added maximization and resizing modes should interact with standard modes: the default size and minimizing of a dialog. So, if the window is maximized, it should not be dragged by holding the title bar, which is allowed with the standard size. Also, the minimizing button state should be reset when maximizing the window. For this purpose, we need access to the the variables CEdit m_caption in the CDialog class and CBmpButton m_button_minmax in CAppDialog. Unfortunately, they, as well as many other members of these classes are declared in the private section. This looks rather strange, while these base classes are part of the public library intended for widespread use. A better solution would be to declare all members as 'protected' or at least to provide methods for accessing them. But in our case they are private. So the only thing which we can do is to fix the Standard Library by adding a "patch". The problem with the patch is that after the library update, you will have to apply the patch again. But the only possible alternative solution, to create duplicate classes CDialog and CAppDialog, does not seem appropriate from the point of view of the OOP ideology.
This is not the last case when the private declaration of the class members will prevent the expansion of the functionality of the derived classes. Therefore, I suggest creating a copy of the Include/Controls folder and if the "private member access error" occurs during compilation, you will be able to edit appropriate parts, such as to move the appropriate element to the 'protected' section or to replace 'private' with 'protected'.
We need to re-write some of the virtual methods of the base classes:
    virtual bool CreateButtonMinMax(void) override;
    virtual void OnClickButtonMinMax(void) override;
    virtual void Minimize(void) override;

    virtual bool OnDialogDragStart(void) override;
    virtual bool OnDialogDragProcess(void) override;
    virtual bool OnDialogDragEnd(void) override;
The first three methods are associated with the Minimize button and the other three are related to the resizing process, which is based on the drag'n'drop technology.
The virtual methods for creating the dialog and reaction to events will also be covered (the latter is always implicitly used in macro definitions of the event handling map, which will be considered later).
    virtual bool Create(const long chart, const string name, const int subwin, const int x1, const int y1, const int x2, const int y2) override;
    virtual bool OnEvent(const int id, const long &lparam, const double &dparam, const string &sparam) override;
The Maximize button will be created together with the standard Minimize button in the predefined version of CreateButtonMinMax. Firstly the basic implementation is called, in order to obtain the standard header buttons. Then the new Maximize button is additionally drawn. The source code contains a common set of instructions which set initial coordinates and alignment, as well as connect image resources. Therefore this code will not be shown here. The full source code is attached below. The resources of these two buttons are located under the "res" subdirectory:
  #resource "res\\expand2.bmp"
  #resource "res\\size6.bmp"
  #resource "res\\size10.bmp"
The following method is responsible for the processing of Maximize button clicks:
virtual void OnClickButtonTrueMax(void);
In addition, we will add helper methods to maximize the window to the entire chart and to restore its original size: these methods can be called from OnClickButtonTrueMax and perform all the work, depending on whether the window is maximized or not.
    virtual void Expand(void);
    virtual void Restore(void);
Creation of the resize button and lunch of the scaling process are implemented in the following methods:
    bool CreateButtonSize(void);
    bool OnDialogSizeStart(void);
Event handling is determined by familiar macros:
  EVENT_MAP_BEGIN(MaximizableAppDialog)
    ON_EVENT(ON_CLICK, m_button_truemax, OnClickButtonTrueMax)
    ON_EVENT(ON_DRAG_START, m_button_size, OnDialogSizeStart)
    ON_EVENT_PTR(ON_DRAG_PROCESS, m_drag_object, OnDialogDragProcess)
    ON_EVENT_PTR(ON_DRAG_END, m_drag_object, OnDialogDragEnd)
  EVENT_MAP_END(CAppDialog)
The m_button_truemax and m_button_size objects were created by ourselves, while m_drag_object is inherited from the CWnd class. The object is used in that class to enable window dragging using the title bar. In our class, this object will be involved in resizing.
But this is not all the required work with events. In order to intercept the chart resizing, we need to handle the CHARTEVENT_CHART_CHANGE event. For this purpose, let us describe the ChartEvent method in our class: it will overlap the similar method in CAppDialog. Thus we will need to call the basic implementation. In addition, we will check the event code and perform specific processing for CHARTEVENT_CHART_CHANGE.
  void MaximizableAppDialog::ChartEvent(const int id, const long &lparam, const double &dparam, const string &sparam)
  {
    if(id == CHARTEVENT_CHART_CHANGE)
    {
      if(OnChartChange(lparam, dparam, sparam)) return;
    }
    CAppDialog::ChartEvent(id, lparam, dparam, sparam);
  }
The OnChartChange method tracks the chart size and if the chart size is changed while it is the active maximizing mode, a new layout of elements is initiated. This is performed by the SelfAdjustment method.
  bool MaximizableAppDialog::OnChartChange(const long &lparam, const double &dparam, const string &sparam)
  {
    m_max_rect.SetBound(0, 0,
                        (int)ChartGetInteger(ChartID(), CHART_WIDTH_IN_PIXELS) - 0 * CONTROLS_BORDER_WIDTH,
                        (int)ChartGetInteger(ChartID(), CHART_HEIGHT_IN_PIXELS) - 1 * CONTROLS_BORDER_WIDTH);
    if(m_maximized)
    {
      if(m_rect.Width() != m_max_rect.Width() || m_rect.Height() != m_max_rect.Height())
      {
        Rebound(m_max_rect);
        SelfAdjustment();
        m_chart.Redraw();
      }
      return true;
    }
    return false;
  }
This method is declared in the MaximizableAppDialog class as abstract and virtual, which means that the child class will have to adjust its controls to the new size.
virtual void SelfAdjustment(const bool minimized = false) = 0;
The same method is called from other places of the "rubber" window class, in which resizing is performed. For example, from OnDialogDragProcess (when the user drags the lower right angle) and OnDialogDragEnd (the user has completed scaling).
The behavior of the advanced dialog is as follows: after it is displayed with the standard size on the chart, the user can drag it using the title bar (standard behavior), minimize it (standard behavior) and maximize it (the added behavior). The maximized state is saved when the chart is resized. The same button can be used in the maximized state to reset the window to the original size or to minimize it. The window can also be instantly maximized from the minimized state. If the window is neither minimized nor maximized, the active area for arbitrary scaling (triangular button) is displayed in the lower right corner. If the window is minimized or maximized, this area is deactivated and hidden.
This could complete the implementation of MaximizableAppDialog. However, another aspect was revealed during testing, which required further development.
In the minimized state, the active resize area overlaps the window closing button and intercepts its mouse events. This is the obvious library error, because the resize button is hidden in the minimized state and it becomes inactive. The problem concerns the CWnd::OnMouseEvent method. It needs the following check:
// if(!IS_ENABLED || !IS_VISIBLE) return false; - this line is missing
As a result, even disabled and invisible controls intercept events. Obviously, the problem could be solved by setting the appropriate Z-order for the control elements. However, the problem with the library is that it does not take into account the Z-order of the controls. In particular, the CWndContainer::OnMouseEvent method contains a simple loop through all subordinate elements in a reverse order, so it does not try to determine their priority in the Z-order.
Thus we either need a new patch for the library or kind of a "trick" in the child class. Here the second variant is used. The "trick" is the following: in the minimized state, the Resize button click should be interpreted as the Close button click (since this is the button which is overlapped). The following method has been added to MaximizableAppDialog for this purpose:
  void MaximizableAppDialog::OnClickButtonSizeFixMe(void)
  {
    if(m_minimized)
    {
      Destroy();
    }
  }
The method has been added to the event map:
  EVENT_MAP_BEGIN(MaximizableAppDialog)
    ...
    ON_EVENT(ON_CLICK, m_button_size, OnClickButtonSizeFixMe)
    ...
  EVENT_MAP_END(CAppDialog)
Now the MaximizableAppDialog class is ready for use. Please note that it is designed for use in the main chart area.
Firstly, let us try to add it to the SlidingPuzzle game. Copy SlidingPuzzle2.mq5 and SlidingPuzzle2.mqh as SlidingPuzzle3.mq5 and SlidingPuzzle3.mqh before starting to edit them. There is almost nothing to change in the mq5 file: only change the reference to the include file to SlidingPuzzle3.mqh.
In the SlidingPuzzle3.mqh file, include the newly created class instead of the standard dialog class:
#include <Controls\Dialog.mqh>
вставим:
#include <Layouts\MaximizableAppDialog.mqh>
The class description must use the new parent class:
class CSlidingPuzzleDialog: public MaximizableAppDialog // CAppDialog
The similar replacement of class names should be performed in the events map:
EVENT_MAP_END(MaximizableAppDialog) // CAppDialog
Also the replacement should be performed in Create:
  bool CSlidingPuzzleDialog::Create(const long chart, const string name, const int subwin, const int x1, const int y1, const int x2, const int y2)
  {
    if(!MaximizableAppDialog::Create(chart, name, subwin, x1, y1, x2, y2)) // CAppDialog
      return (false);
    ...
Finally, the new dialog requires the implementation of the SelfAdjustment method which responds to resizing.
  void CSlidingPuzzleDialog::SelfAdjustment(const bool minimized = false)
  {
    CSize size;
    size.cx = ClientAreaWidth();
    size.cy = ClientAreaHeight();
    m_main.Size(size);
    m_main.Pack();
  }
The relevant work will be performed by the m_main container: its 'Pack' method will be called for the last known size of the window's client area.
This is absolutely enough to provide the game with an adaptive layout. However, for better code readability and efficiency, I slightly changed the button use principle in the application: now they are all collected in a single array CButton m_buttons[16], they can be accessed by index instead of the 'switch' operator and are processed in a single line (by the OnClickButton method) in the events map:
ON_INDEXED_EVENT(ON_CLICK, m_buttons, OnClickButton)
You can compare the source code of the original game and the modified code.
The behavior of the adaptive window is shown below.
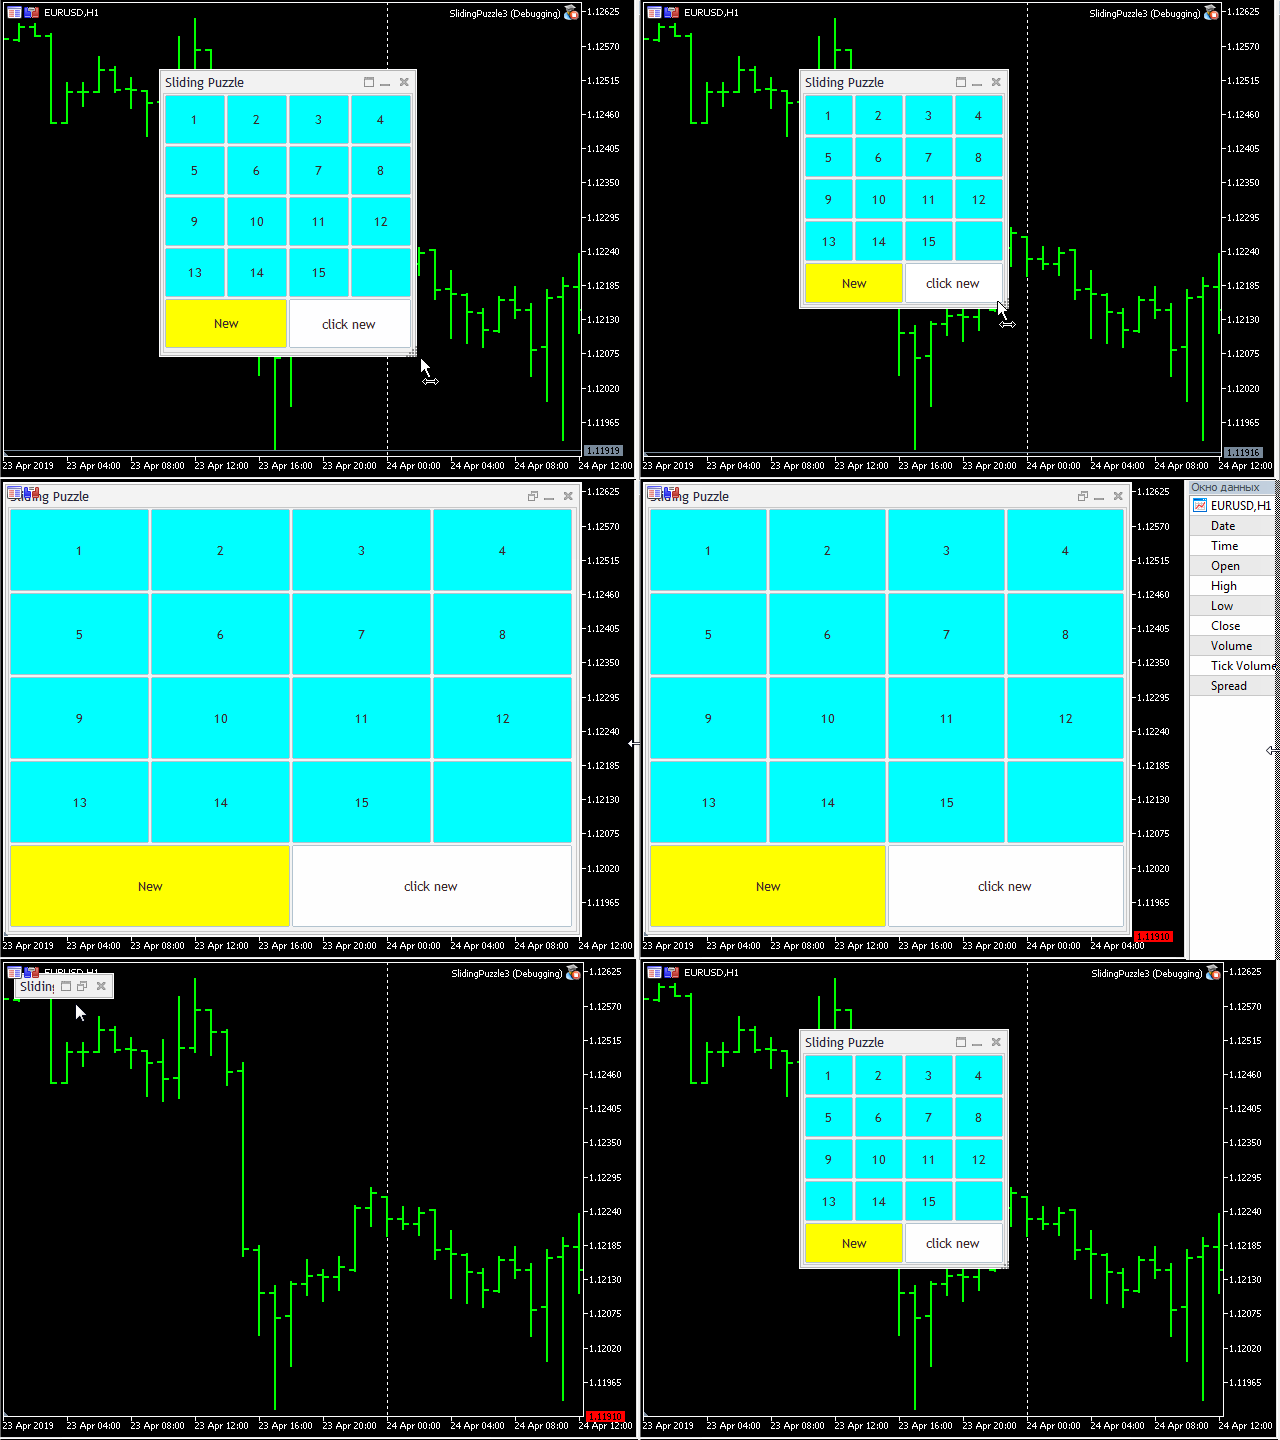
The SlidingPuzzle game
Similarly, we need to amend the demo Expert Advisor Experts\Examples\Layouts\Controls2.mq5: its main mq5 file and the include header file containing the dialog description, which are presented here under the new names, Controls3.mq5 and ControlsDialog3.mqh. Note that the game used a container of the grid type, while the dialog with controls is constructed based on the 'box' type.
If we leave in the modified project the same implementation of the SelfAdjustment method, similar to the one used in the game, we can easily notice the previously unnoticed flaw: the adaptive window resizing only works for the window itself, but it doesn't affect controls. We need implement the possibility to adjust the size of controls to fit the dynamic window size.
"Rubber" controls
Different standard controls have different adaption to dynamic resizing. Some of them, such as the CButton buttons, can properly respond to the 'Width' method call. For others, such as the CListView lists, we can simply set alignment using 'Alignment' and the system will automatically save the distance between the control and the window border, which is equal to making it "rubber". However, some of the controls do not support any of the variants. These include CSpinEdit and CComboBox, among others. To add the new ability to them, we will need to create subclasses.
For CSpinEdit, it would be enough to override the virtual OnResize method:
  #include <Controls/SpinEdit.mqh> // patch required: private: -> protected:

  class SpinEditResizable: public CSpinEdit
  {
    public:
      virtual bool OnResize(void) override
      {
        m_edit.Width(Width());
        m_edit.Height(Height());

        int x1 = Width() - (CONTROLS_BUTTON_SIZE + CONTROLS_SPIN_BUTTON_X_OFF);
        int y1 = (Height() - 2 * CONTROLS_SPIN_BUTTON_SIZE) / 2;
        m_inc.Move(Left() + x1, Top() + y1);

        x1 = Width() - (CONTROLS_BUTTON_SIZE + CONTROLS_SPIN_BUTTON_X_OFF);
        y1 = (Height() - 2 * CONTROLS_SPIN_BUTTON_SIZE) / 2 + CONTROLS_SPIN_BUTTON_SIZE;
        m_dec.Move(Left() + x1, Top() + y1);

        return CWndContainer::OnResize();
      }
  };
Since CSpinEdit actually consists of 3 elements, an input field and two buttons, in response to a resize request (done by the OnResize method) we need to increase or decrease the input field to fit the new size, and move the buttons close to the right edge of the field. The only problem is that the subordinate elements, m_edit, m_inc and m_dec, are described in the private area. Thus we need to fix the standard library again. CSpinEdit was used here only to demonstrate the approach, which in this case can be easily implemented. For the real OLAP interface we need an adapted drop-down list.
But a similar issue can be encountered when customizing the CComboBox class. Before implementing a derived class, we need to apply a patch to the CComboBox base class, in which 'private' should be replaced with 'protected'. Note that all these patches do not affect compatibility with other projects, which use the standard library.
A little more effort is needed to implement the "rubber" combo box. We need to override not only OnResize, but also OnClickButton, Enable and Disable, as well as to add an event map. We manage all subordinate objects m_edit, m_list and m_drop, i.e. all the objects which the combo box consists of.
  #include <Controls/ComboBox.mqh> // patch required: private: -> protected:

  class ComboBoxResizable: public CComboBox
  {
    public:
      virtual bool OnEvent(const int id, const long &lparam, const double &dparam, const string &sparam) override;

      virtual bool OnResize(void) override
      {
        m_edit.Width(Width());

        int x1 = Width() - (CONTROLS_BUTTON_SIZE + CONTROLS_COMBO_BUTTON_X_OFF);
        int y1 = (Height() - CONTROLS_BUTTON_SIZE) / 2;
        m_drop.Move(Left() + x1, Top() + y1);

        m_list.Width(Width());

        return CWndContainer::OnResize();
      }

      virtual bool OnClickButton(void) override
      {
        // this is a hack to trigger resizing of elements in the list
        // we need it because standard ListView is incorrectly coded in such a way
        // that elements are resized only if vscroll is present
        bool vs = m_list.VScrolled();
        if(m_drop.Pressed())
        {
          m_list.VScrolled(true);
        }
        bool b = CComboBox::OnClickButton();
        m_list.VScrolled(vs);
        return b;
      }

      virtual bool Enable(void) override
      {
        m_edit.Show();
        m_drop.Show();
        return CComboBox::Enable();
      }

      virtual bool Disable(void) override
      {
        m_edit.Hide();
        m_drop.Hide();
        return CComboBox::Disable();
      }
  };

  #define EXIT_ON_DISABLED \
        if(!IsEnabled())   \
        {                  \
          return false;    \
        }

  EVENT_MAP_BEGIN(ComboBoxResizable)
    EXIT_ON_DISABLED
    ON_EVENT(ON_CLICK, m_drop, OnClickButton)
  EVENT_MAP_END(CComboBox)
Now we can check these "rubber" controls using the demo project Controls3. Replace the CSpinEdit and CComboBox classes with SpinEditResizable and ComboBoxResizable, respectively. Change the sizes of controls in the SelfAdjustment method.
  void CControlsDialog::SelfAdjustment(const bool minimized = false)
  {
    CSize min = m_main.GetMinSize();
    CSize size;
    size.cx = ClientAreaWidth();
    size.cy = ClientAreaHeight();
    if(minimized)
    {
      if(min.cx > size.cx) size.cx = min.cx;
      if(min.cy > size.cy) size.cy = min.cy;
    }
    m_main.Size(size);
    int w = (m_button_row.Width() - 2 * 2 * 2 * 3) / 3;
    m_button1.Width(w);
    m_button2.Width(w);
    m_button3.Width(w);
    m_edit.Width(w);
    m_spin_edit.Width(w);
    m_combo_box.Width(m_lists_row.Width() / 2);
    m_main.Pack();
  }
The SelfAdjustment method will be called automatically by the parent MaximizableAppDialog class following the window resizing. In addition, we will call this method ourselves once, at the time of window initialization, from the CreateMain method.
This is how this may look like in reality (for simplicity, controls fill the working area only horizontally, but the same effect can be applied vertically).
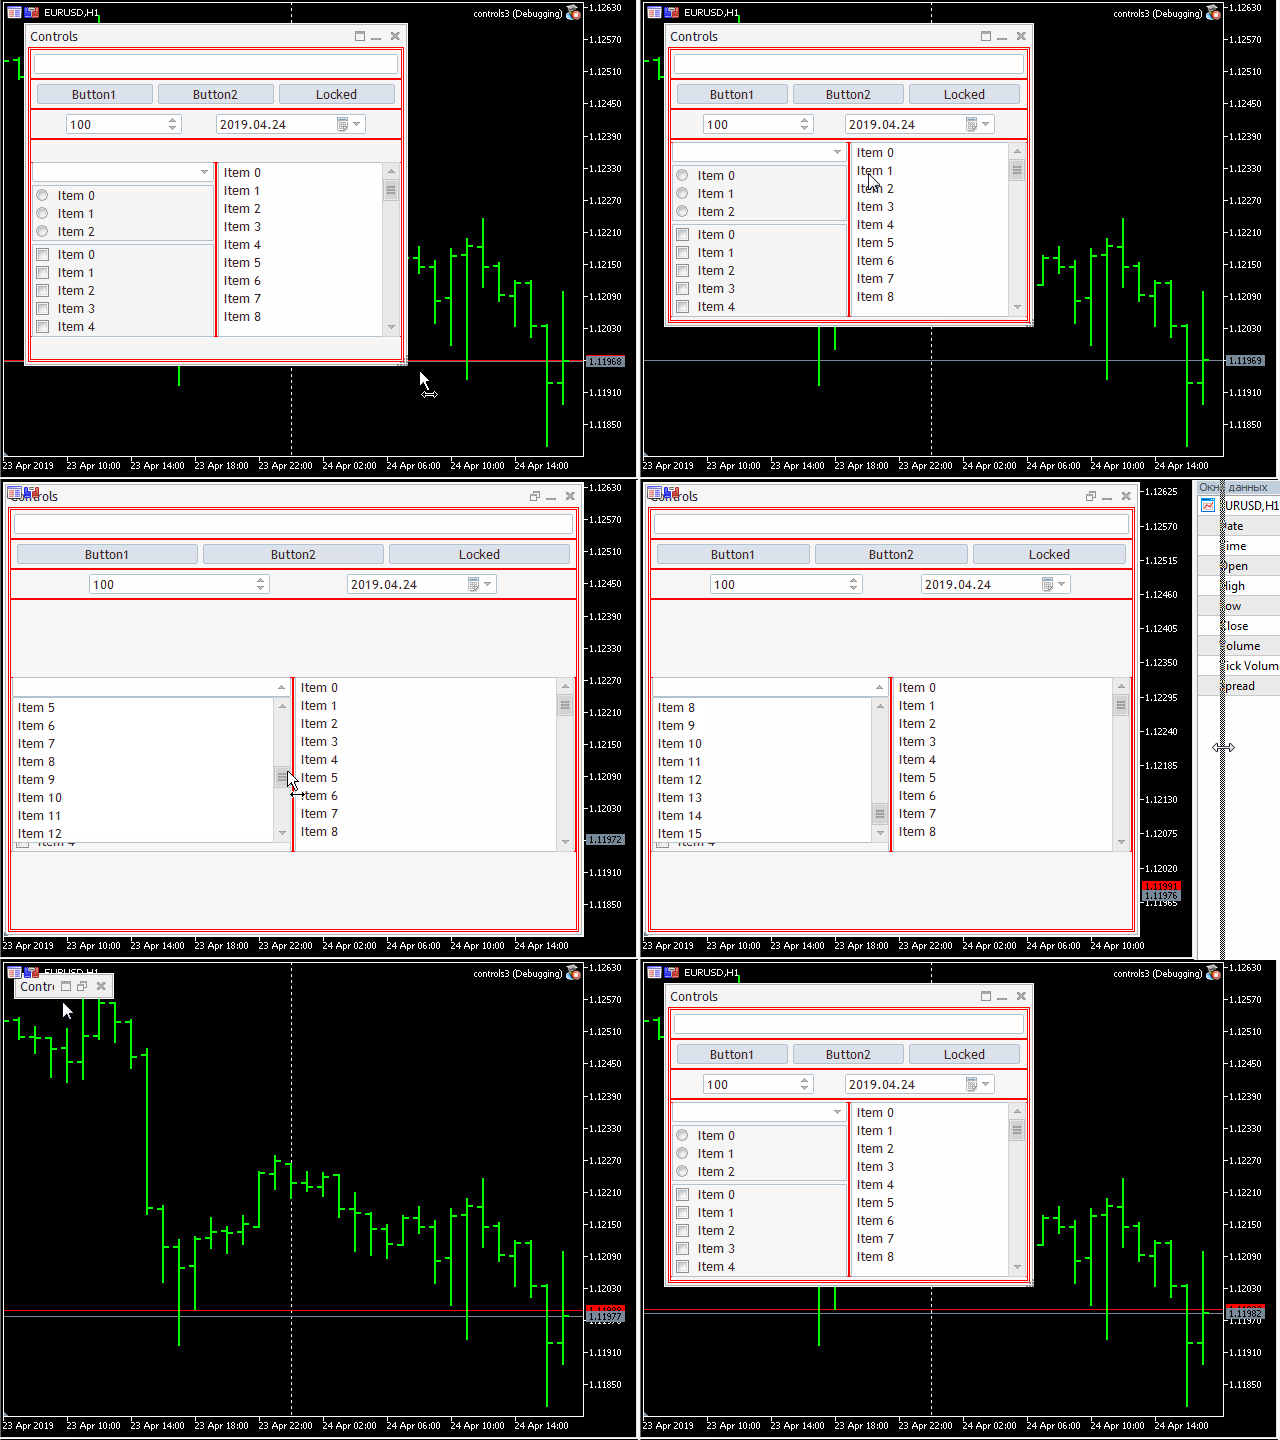
Demonstration of controls
The red boxes are shown for debugging purposes here and they can be disabled using the LAYOUT_BOX_DEBUG macro.
In addition to the above changes, I also slightly modified the control initialization principle. Starting with the main client area of the window, each block is entirely initialized in a dedicated method (for example, CreateMain, CreateEditRow, CreateButtonRow, etc.), which returns a reference to the created container type (CWnd *) if successful. The parent container adds a child by calling CWndContainer::Add. This is how the main dialog initialization dialog look like now:
  bool CControlsDialog::Create(const long chart, const string name, const int subwin, const int x1, const int y1, const int x2, const int y2)
  {
      if(MaximizableAppDialog::Create(chart, name, subwin, x1, y1, x2, y2)
      && Add(CreateMain(chart, name, subwin)))
      {
          return true;
      }
      return false;
  }

  CWnd *CControlsDialog::CreateMain(const long chart, const string name, const int subwin)
  {
      m_main.LayoutStyle(LAYOUT_STYLE_VERTICAL);
      if(m_main.Create(chart, name + "main", subwin, 0, 0, ClientAreaWidth(), ClientAreaHeight())
      && m_main.Add(CreateEditRow(chart, name, subwin))
      && m_main.Add(CreateButtonRow(chart, name, subwin))
      && m_main.Add(CreateSpinDateRow(chart, name, subwin))
      && m_main.Add(CreateListsRow(chart, name, subwin))
      && m_main.Pack())
      {
          SelfAdjustment();
          return &m_main;
      }
      return NULL;
  }
Here is the initialization of a line with buttons:
  CWnd *CControlsDialog::CreateButtonRow(const long chart, const string name, const int subwin)
  {
      if(m_button_row.Create(chart, name + "buttonrow", subwin, 0, 0, ClientAreaWidth(), BUTTON_HEIGHT * 1.5)
      && m_button_row.Add(CreateButton1())
      && m_button_row.Add(CreateButton2())
      && m_button_row.Add(CreateButton3()))
      {
        m_button_row.Alignment(WND_ALIGN_LEFT|WND_ALIGN_RIGHT, 2, 0, 2, 0);
        return &m_button_row;
      }
      return NULL;
  }
This syntax seems to be more logical and compact than the previously used one. However the context comparison of old and new projects can be difficult with such implementation.
There are still more things to do concerning the controls. Do not forget that the purpose of the project is to implement graphical interface for the OLAP. Therefore, the central control is the "chart". The problem is that there is no such control in the standard library. We need to create it.
The "chart" control (CPlot)
The MQL library provides several graphic primitives. These include the canvas (CCanvas), canvas-based graphics (CGraphic) and graphic objects for displaying ready-made images (CChartObjectBitmap, CPicture), which are however not related to required graphics. To insert any of the above primitives to a window interface, we need to wrap it to the child class of the appropriate control, which can plot. Fortunately, there is no need to solve this task from scratch. Please see the article PairPlot graph based on CGraphic for analyzing correlations between data arrays (time series), published in this site. It offers a ready-to-use control class, which includes a set of charts for analyzing correlations between symbols. Thus we only need to modify it for working with a single chart in the control and thus we will obtain the required result.
The files from the article are installed to the Include\PairPlot\ directory. The file in which the class of interest is contained is called PairPlot.mqh. Based on this file, we will create our variant under the name Plot.mqh. The main differences:
We do not need the CTimeserie class, so let us delete it. The CPairPlot control class, which is derived from CWndClient, is transformed to CPlot, while its operation with cross-symbol charts us replaced with one single chart. The charts in the above mentioned projects are plotted using special histogram class (CHistogram) and the scatter diagram class (CScatter), which are derived from the common CPlotBase class (which in turn is derived from CGraphic). We will convert CPlotBase to our own CGraphicInPlot class, which is also derived from CGraphic. We don't need any special diagrams or scatter charts. Instead, we will use standard drawing styles (CURVE_POINTS, CURVE_LINES, CURVE_POINTS_AND_LINES, CURVE_STEPS, CURVE_HISTOGRAM), which are provided by the CGraphic class (namely the adjacent CCurve class). The simplified diagram of relations between classes is provided below.
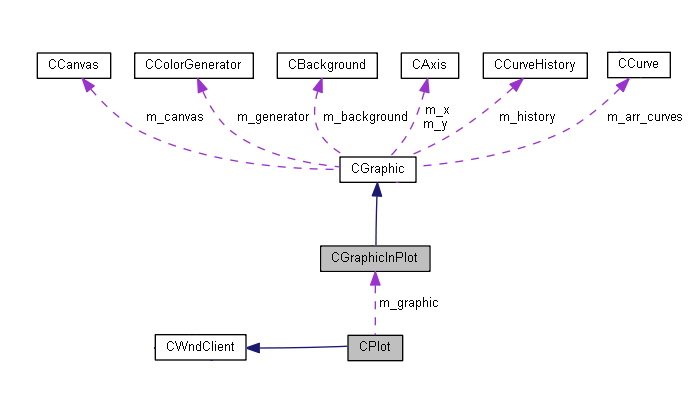
The diagram of relations between graphic classes
Gray color is used for newly added classes, while all other classes are standard.
Let us create the PlotDemo test Expert Advisor to check the new control. Initialization, binding to events and launch are implemented in the PlotDemo.mq5 file, while the dialog description is contained in PlotDemo.mqh (both files are attached).
The EA accepts the only input parameter, the drawing style.
  #include "PlotDemo.mqh"

  input ENUM_CURVE_TYPE PlotType = CURVE_POINTS;

  CPlotDemo *pPlotDemo;

  int OnInit()
  {
      pPlotDemo = new CPlotDemo;
      if(CheckPointer(pPlotDemo) == POINTER_INVALID) return INIT_FAILED;

      if(!pPlotDemo.Create(0, "Plot Demo", 0, 20, 20, 800, 600, PlotType)) return INIT_FAILED;
      if(!pPlotDemo.Run()) return INIT_FAILED;
      pPlotDemo.Refresh();

      return INIT_SUCCEEDED;
  }

  void OnChartEvent(const int id, const long &lparam, const double &dparam, const string &sparam)
  {
      pPlotDemo.ChartEvent(id, lparam, dparam, sparam);
  }

  ...
Create our control object in the header file of the dialog and add two test curves.
  #include <Controls\Dialog.mqh>
  #include <PairPlot/Plot.mqh>
  #include <Layouts/MaximizableAppDialog.mqh>

  class CPlotDemo: public MaximizableAppDialog // CAppDialog
  {
    private:
      CPlot m_plot;

    public:
      CPlotDemo() {}
      ~CPlotDemo() {}

      bool Create(const long chart, const string name, const int subwin, const int x1, const int y1, const int x2, const int y2, const ENUM_CURVE_TYPE curveType = CURVE_POINTS);
      virtual bool OnEvent(const int id, const long &lparam, const double &dparam, const string &sparam);
      bool Refresh(void);

      virtual void SelfAdjustment(const bool minimized = false) override
      {
        if(!minimized)
        {
          m_plot.Size(ClientAreaWidth(), ClientAreaHeight());
          m_plot.Resize(0, 0, ClientAreaWidth(), ClientAreaHeight());
        }
        m_plot.Refresh();
      }
  };

  EVENT_MAP_BEGIN(CPlotDemo)
  EVENT_MAP_END(MaximizableAppDialog)

  bool CPlotDemo::Create(const long chart, const string name, const int subwin, const int x1, const int y1, const int x2, const int y2, const ENUM_CURVE_TYPE curveType = CURVE_POINTS)
  {
      const int maxw = (int)ChartGetInteger(0, CHART_WIDTH_IN_PIXELS);
      const int maxh = (int)ChartGetInteger(0, CHART_HEIGHT_IN_PIXELS);
      int _x1 = x1;
      int _y1 = y1;
      int _x2 = x2;
      int _y2 = y2;
      if(x2 - x1 > maxw || x2 > maxw)
      {
        _x1 = 0;
        _x2 = _x1 + maxw - 0;
      }
      if(y2 - y1 > maxh || y2 > maxh)
      {
        _y1 = 0;
        _y2 = _y1 + maxh - 1;
      }

      if(!MaximizableAppDialog::Create(chart, name, subwin, _x1, _y1, _x2, _y2))
          return false;
      if(!m_plot.Create(m_chart_id, m_name + "Plot", m_subwin, 0, 0, ClientAreaWidth(), ClientAreaHeight(), curveType))
          return false;
      if(!Add(m_plot))
          return false;
      double x[] = {-10, -4, -1, 2, 3, 4, 5, 6, 7, 8};
      double y[] = {-5, 4, -10, 23, 17, 18, -9, 13, 17, 4};
      m_plot.CurveAdd(x, y, "Example 1");
      m_plot.CurveAdd(y, x, "Example 2");
      return true;
  }

  bool CPlotDemo::Refresh(void)
  {
      return m_plot.Refresh();
  }
The Expert Advisor operation is visualized below:
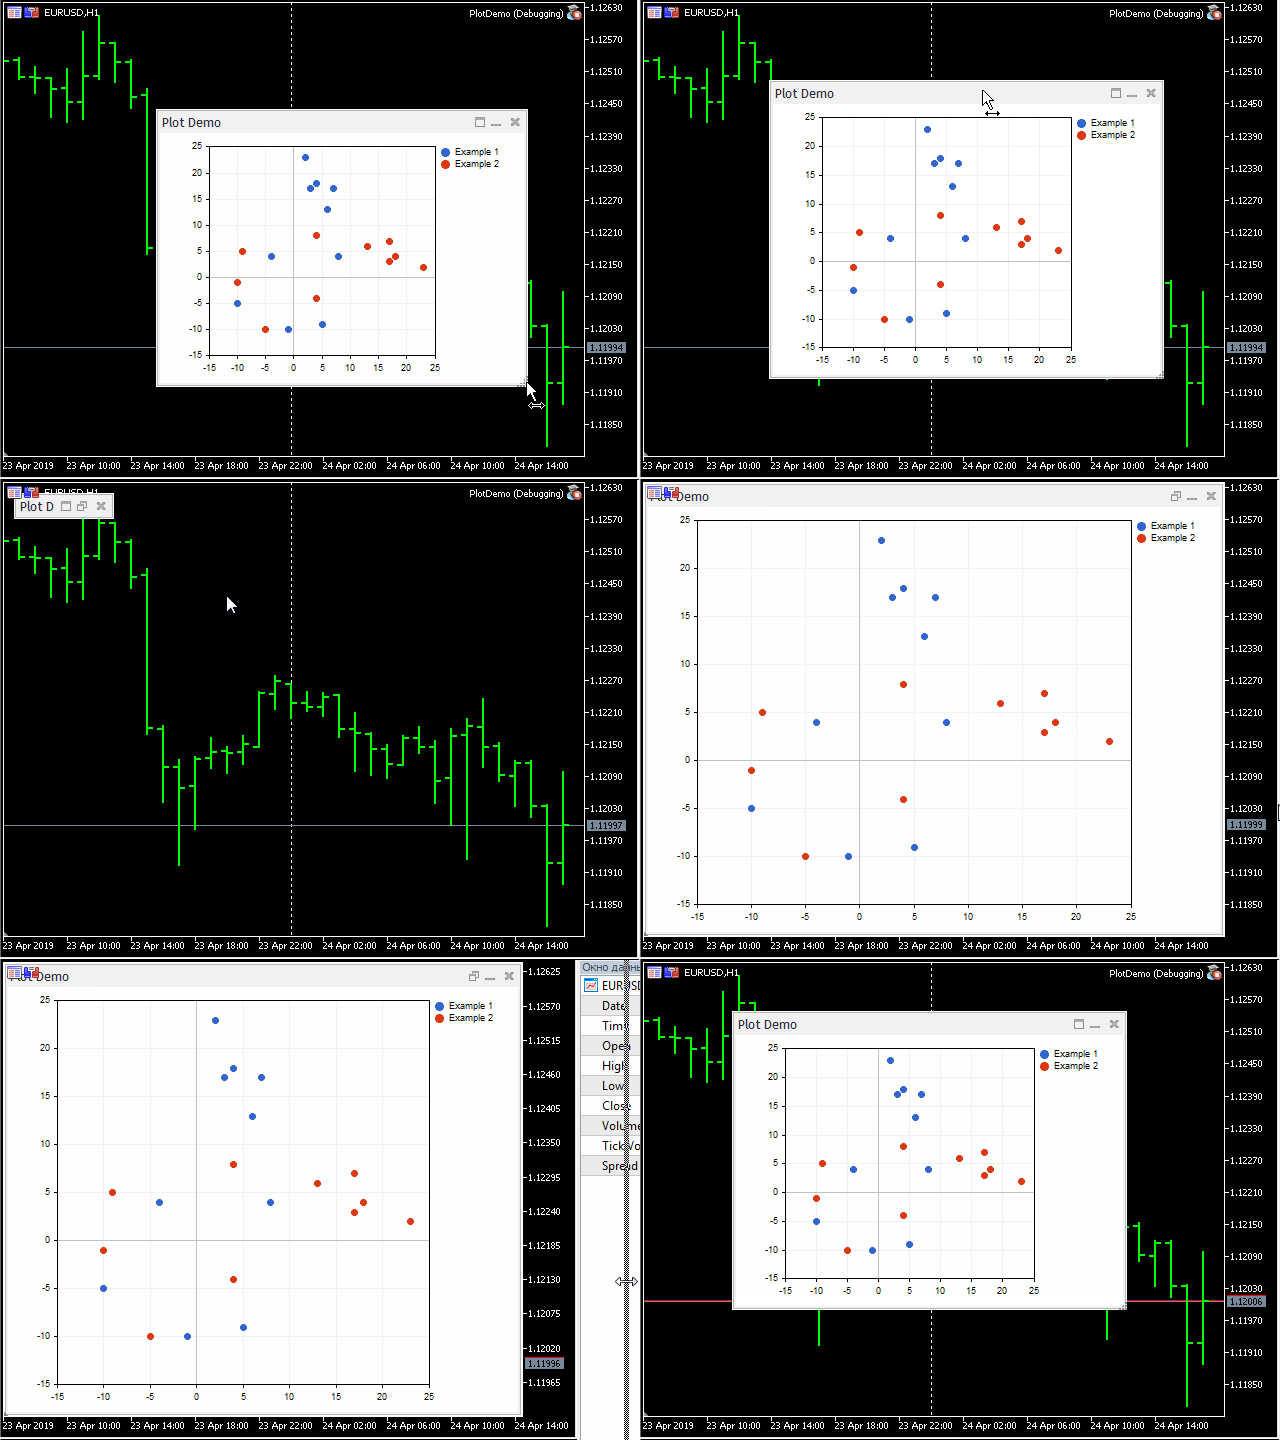
Demonstration of controls with the graphics
We have completed a large part of work and now the possibilities for creating an adaptive interface with graphics support are sufficient for the OLAP project. In order to summarize, I will present a diagram of the main classes related to the graphical user interface.
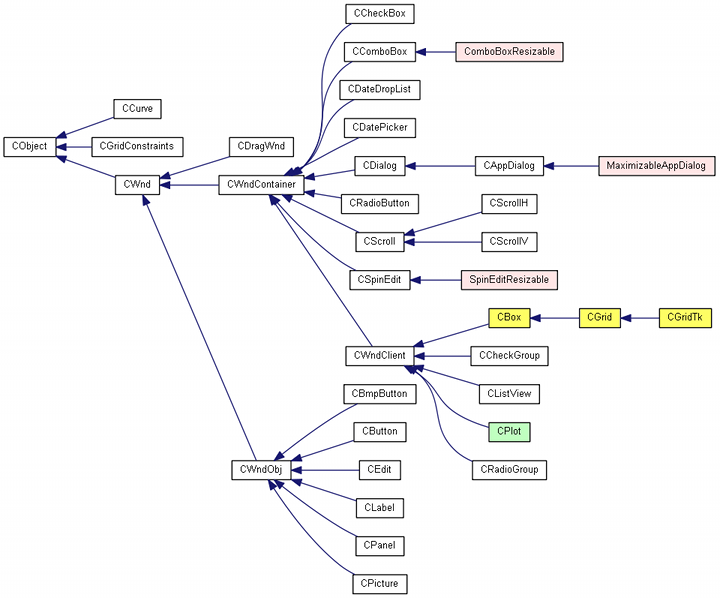
Diagram of control classes
White color is used for standard classes; yellow color is used for container classes; pink is used for classes of dialogs and customized elements, which support resizing; green is used for the controls with the built-in graphics.
GUI for OLAP
Let us create a new Expert Advisor, which will implement the interactive processing and visualization of trading history data: OLAPGUI. All operations concerning the creation of the window and controls, the response to the user action and OLAP function calls are contained in the OLAPGUI.mqh header file.
Let us leave only those EA inputs, which are related to data import from HTML or CSV. First of all, this concerns the ReportFile, Prefix, Suffix variables, which may already be familiar to you from the first OLAPDEMO project. If ReportFile is empty, the EA will analyze the current account's trading history.
Selector, aggregators and chart style will be selected using control elements. We will preserve the possibility to set 3 dimensions for the hypercube, i.e. 3 selectors for the conditional axes X, Y, Z. For this purpose, we will need 3 drop-down lists. Place them in the upper row of controls. Closer to the right edge of the same row, add the Process button, a click on which will launch the analysis.
Selection of the aggregator function and of the field, according to which aggregation will be performed, is implemented using two other drop-down lists in the second row of controls. Add there a drop-drown list for the sorting order and the chart style. Filtering will be eliminated to simplify the UI.
The remaining area will be occupied by a chart.
The drop-down lists with the selectors will contain the same set of options. It will combine the types of selectors and of directly output records. The next table shows the names of controls and corresponding fields and/or selector types.
- (selector/field), FIELD_NONE
- ordinal [SerialNumberSelector], FIELD_NUMBER
- symbol [SymbolSelector], FIELD_SYMBOL
- type [TypeSelector], FIELD_TYPE
- magic number [MagicSelector], FIELD_MAGIC
- day of week open [WeekDaySelector], FIELD_DATETIME1
- day of week close [WeekDaySelector], FIELD_DATETIME2
- hour of day open [DayHourSelector], FIELD_DATETIME1
- hour of day close [DayHourSelector], FIELD_DATETIME2
- duration [DaysRangeSelector], FIELD_DATETIME1 и FIELD_DATETIME2
- lot [TradeSelector/QuantizationSelector*], FIELD_LOT
- profit [TradeSelector/QuantizationSelector*], FIELD_PROFIT_AMOUNT
- profit percent [TradeSelector/QuantizationSelector*], FIELD_PROFIT_PERCENT
- profit points [TradeSelector/QuantizationSelector*], FIELD_PROFIT_POINT
- commission [TradeSelector/QuantizationSelector*], FIELD_COMMISSION
- swap [TradeSelector/QuantizationSelector*], FIELD_SWAP
- custom 1 [TradeSelector/QuantizationSelector*], FIELD_CUSTOM1
- custom 2 [TradeSelector/QuantizationSelector*], FIELD_CUSTOM2
The selection of selectors marked with * is determined by the aggregator type: TradeSelector is used for IdentityAggregator; otherwise QuantizationSelector is used.
The names of selectors (points 1 to 9) in the drop-down list are shown in quotes.
Selectors should be selected sequentially, from left to right, from X to Z. The combo boxes for the subsequent axes will be unhidden only after selecting the previous measurement selector.
Supported aggregate functions:
- sum
- average
- max
- min
- count
- profit factor
- progressive total
- identity
All functions (except the last one) require the specification of the aggregated record field using the drop-down list to the right of the aggregator.
The "progressive total" function means that the "ordinal" is chosen as the selector along the X axis (which means the sequential passing through records).
The combo box with sorting is available if the only selector (X) is chosen.
The X and Y axes are respectively located horizontally and vertically on the chart. For three-dimensional hypercubes with different coordinates along the Z axis, I applied the most primitive possible approach: multiple sections in the Z plane can be scrolled through using the Process button. If there are Z-coordinates, the button name changes to "i / n title >>", where 'i' is the number of the current Z-coordinate, 'n' is the total number of samples along the Z axis, 'title' shows what is plotted along the axis (for example, the day of the week or the deal type depending on the Z axis selector). If you change the hypercube construction condition, the button title will be set again to "Process" and will start working in normal mode. Please note that processing will differ for the "identity" aggregator: in this case the cube always has 2 dimensions, while all the three curves (for the X, Y and Z fields) are plotted on the chart together, without scrolling.
In addition to the graphical display, each cube is also displayed in a log as a text. This is especially important if aggregation is performed by simple fields, not selectors. Selectors provide output of labels along axes, while when quantizing a simple field, the system can only output the cell index. For example, in order to analyze profit broken down by lot size, select the "lot" field in the X selector and the "sum" aggregator across the "profit amount" field. The following values can appear along the X axis: 0, 0.5, 1, 1.0, 1.5 etc. up to the number of different traded volumes. However, these will be cell numbers, but not lot values, while the latter ones are reflected in the log. The log will contain the following message:
	Selectors: 1
	SumAggregator<TRADE_RECORD_FIELDS> FIELD_PROFIT_AMOUNT [6]
	X: QuantizationSelector(FIELD_LOT) [6]
	===== QuantizationSelector(FIELD_LOT) =====
	      [value] [title]
	[0] 365.96000 "0.01"
	[1]   0.00000 "0.0"
	[2]   4.65000 "0.03"
	[3]  15.98000 "0.06"
	[4]  34.23000 "0.02"
	[5]   0.00000 "1.0"
Here 'value' is the total profit, 'title' is the real lot value corresponding to this profit, while numbers on the left are the coordinates along the X axis. Note that fractional values appear on the chart along the axis, though only integer indexes make sense. This label display aspect among others can certainly be improved.
To link the GUI controls with the OLAP core (the idea presented in the first article is used as is) in the OLAPcube.mqh header file, the OLAPWrapper layer class needs to be implemented. It features the same preparatory operation with data, which was performed by the 'process' function in the first demo project OLAPDEMO. Now it is a class method.
  class OLAPWrapper
  {
    protected:
      Selector<TRADE_RECORD_FIELDS> *createSelector(const SELECTORS selector, const TRADE_RECORD_FIELDS field);

    public:
      void process(
          const SELECTORS &selectorArray[], const TRADE_RECORD_FIELDS &selectorField[],
          const AGGREGATORS AggregatorType, const TRADE_RECORD_FIELDS AggregatorField, Display &display,
          const SORT_BY SortBy = SORT_BY_NONE,
          const double Filter1value1 = 0, const double Filter1value2 = 0)
      {
        int selectorCount = 0;
        for(int i = 0; i < MathMin(ArraySize(selectorArray), 3); i++)
        {
          selectorCount += selectorArray[i] != SELECTOR_NONE;
        }
        ...
        HistoryDataAdapter<CustomTradeRecord> history;
        HTMLReportAdapter<CustomTradeRecord> report;
        CSVReportAdapter<CustomTradeRecord> external;

        DataAdapter *adapter = &history;

        if(ReportFile != "")
        {
          if(StringFind(ReportFile, ".htm") > 0 && report.load(ReportFile))
          {
            adapter = &report;
          }
          else
          if(StringFind(ReportFile, ".csv") > 0 && external.load(ReportFile))
          {
            adapter = &external;
          }
          else
          {
            Alert("Unknown file format: ", ReportFile);
            return;
          }
        }
        else
        {
          Print("Analyzing account history");
        }

        Selector<TRADE_RECORD_FIELDS> *selectors[];
        ArrayResize(selectors, selectorCount);

        for(int i = 0; i < selectorCount; i++)
        {
          selectors[i] = createSelector(selectorArray[i], selectorField[i]);
        }

        Aggregator<TRADE_RECORD_FIELDS> *aggregator;
        switch(AggregatorType)
        {
          case AGGREGATOR_SUM:
            aggregator = new SumAggregator<TRADE_RECORD_FIELDS>(AggregatorField, selectors, filters);
            break;
            ...
        }

        Analyst<TRADE_RECORD_FIELDS> *analyst;
        analyst = new Analyst<TRADE_RECORD_FIELDS>(adapter, aggregator, display);

        analyst.acquireData();
        ...
        analyst.build();
        analyst.display(SortBy, AggregatorType == AGGREGATOR_IDENTITY);
        ...
      }
The full source code is attached below. Note that all the settings, which in the OLAPDEMO project were received from the input variables, are now passed in as parameters of the 'process' method, and they should obviously be filled based on the state of controls.
Of particular interest is the 'display' parameter. The OLAP core declares this special 'Display' interface for the data visualization. Now we need to implement it in the graphical part of the program. By creating an object with this interface, we implement "dependency injection", which was discussed in the first article. This will enable the connection of the new results display method without changing the OLAP core.
In the OLAPGUI.mq5 file, create a dialog and pass the OLAPWrapper sample to it.
  #include "OLAPGUI.mqh"

  OLAPWrapper olapcore;
  OLAPDialog dialog(olapcore);

  int OnInit()
  {
      if(!dialog.Create(0, "OLAPGUI" + (ReportFile != "" ? " : " + ReportFile : ""), 0,  0, 0, 584, 456)) return INIT_FAILED;
      if(!dialog.Run()) return INIT_FAILED;
      return INIT_SUCCEEDED;
  }
  ...
The OLAPDialog dialog class is defined in OLAPGUI.mqh.
  class OLAPDialog;

  // since MQL5 does not support multiple inheritence we need this delegate object
  class OLAPDisplay: public Display
  {
    private:
      OLAPDialog *parent;

    public:
      OLAPDisplay(OLAPDialog *ptr): parent(ptr) {}
      virtual void display(MetaCube *metaData, const SORT_BY sortby = SORT_BY_NONE, const bool identity = false) override;
  };

  class OLAPDialog: public MaximizableAppDialog
  {
    private:
      CBox m_main;

      CBox m_row_1;
      ComboBoxResizable m_axis[AXES_NUMBER];
      CButton m_button_ok;

      CBox m_row_2;
      ComboBoxResizable m_algo[ALGO_NUMBER]; // aggregator, field, graph type, sort by

      CBox m_row_plot;
      CPlot m_plot;
      ...
      OLAPWrapper *olapcore;
      OLAPDisplay *olapdisplay;
      ...

    public:
      OLAPDialog(OLAPWrapper &olapimpl)
      {
        olapcore = &olapimpl;
        olapdisplay = new OLAPDisplay(&this);
      }

      ~OLAPDialog(void);
      ...
In response to the "Process" button click, a dialog fills in the necessary parameters for the OLAPWrapper::process method based on the position of the controls and calls this method while passing the olapdisplay object as a display:
  void OLAPDialog::OnClickButton(void)
  {
    SELECTORS Selectors[4];
    TRADE_RECORD_FIELDS Fields[4];
    AGGREGATORS at = (AGGREGATORS)m_algo[0].Value();
    TRADE_RECORD_FIELDS af = (TRADE_RECORD_FIELDS)(AGGREGATORS)m_algo[1].Value();
    SORT_BY sb = (SORT_BY)m_algo[2].Value();

    ArrayInitialize(Selectors, SELECTOR_NONE);
    ArrayInitialize(Fields, FIELD_NONE);
    ...

    olapcore.process(Selectors, Fields, at, af, olapdisplay, sb);
  }
The full code of all settings is attached below.
The auxiliary OLAPDisplay class is needed because MQL does not support multiple inheritance. The OLAPDialog class is derived from MaximizableAppDialog and it therefore cannot implement the Dialog interface directly. Instead, this task will be performed by the OLAPDisplay class: its object will be created inside the window and will be provided by a link to the developer via the constructor parameter.
After creating the cube, the OLAP core calls the OLAPDisplay::display method:
  void OLAPDisplay::display(MetaCube *metaData, const SORT_BY sortby = SORT_BY_NONE, const bool identity = false) override
  {
    int consts[];
    int selectorCount = metaData.getDimension();
    ArrayResize(consts, selectorCount);
    ArrayInitialize(consts, 0);

    Print(metaData.getMetaCubeTitle(), " [", metaData.getCubeSize(), "]");
    for(int i = 0; i < selectorCount; i++)
    {
      Print(CharToString((uchar)('X' + i)), ": ", metaData.getDimensionTitle(i), " [", metaData.getDimensionRange(i), "]");
    }

    if(selectorCount == 1)
    {
      PairArray *result;
      if(metaData.getVector(0, consts, result, sortby))
      {
        Print("===== " + metaData.getDimensionTitle(0) + " =====");
        ArrayPrint(result.array);
        parent.accept1D(result, metaData.getDimensionTitle(0));
      }
      parent.finalize();
      return;
    }
    ...
The purpose of this is to obtain the data to be displayed (getDimension(), getDimensionTitle(), getVector()) from the metaData object and to pass them to the window. The above fragment features processing of a case with a single selector. Special data receiving methods are reserved in the dialog class:
  void OLAPDialog::accept1D(const PairArray *data, const string title)
  {
    m_plot.CurveAdd(data, title);
  }

  void OLAPDialog::accept2D(const double &x[], const double &y[], const string title)
  {
    m_plot.CurveAdd(x, y, title);
  }

  void OLAPDialog::finalize()
  {
    m_plot.Refresh();
    m_button_ok.Text("Process");
  }
Here are examples of analytical profiles which can be presented graphically using OLAPGUI.
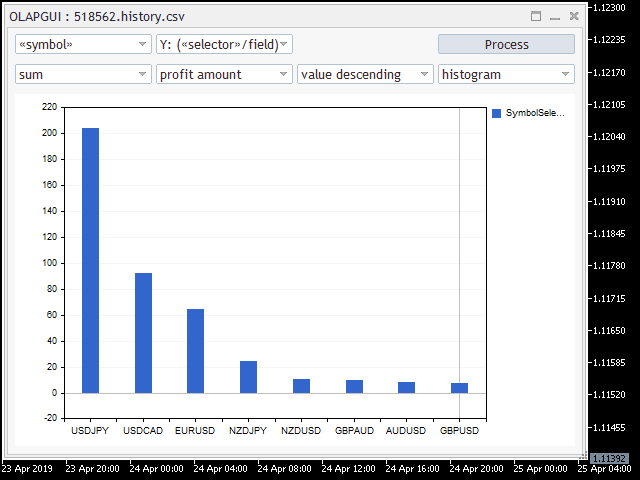
Profit by symbols, in descending order
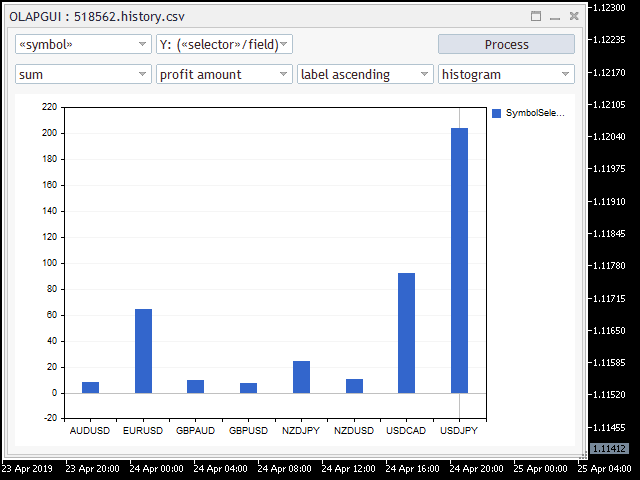
Profit by symbols, sorted alphabetically
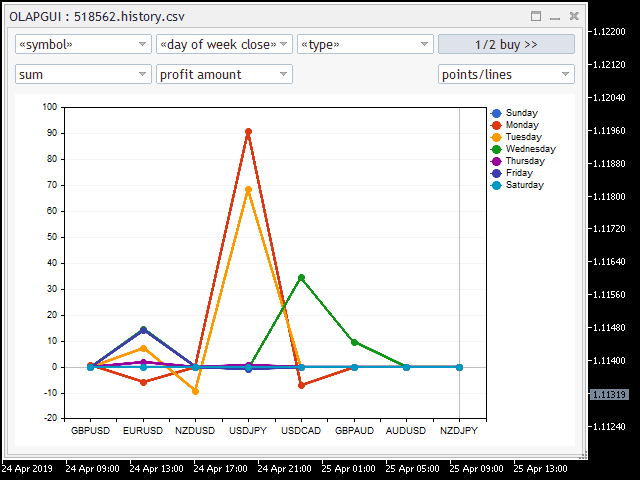
Profit by symbol, day of the week when position was closed, deal type "Buy"
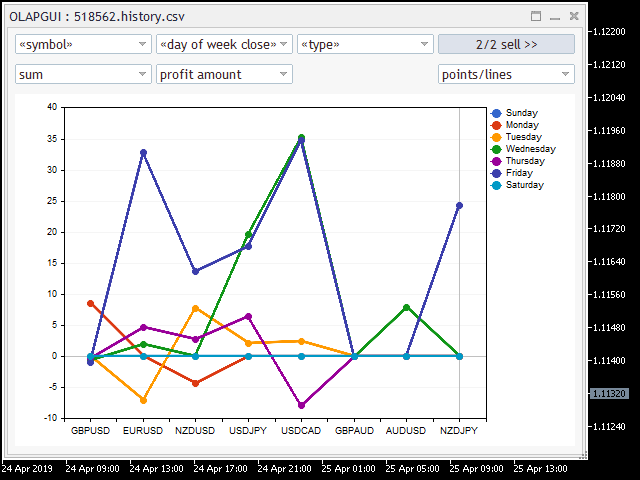
Profit by symbol, day of the week when position was closed, deal type "Sell"
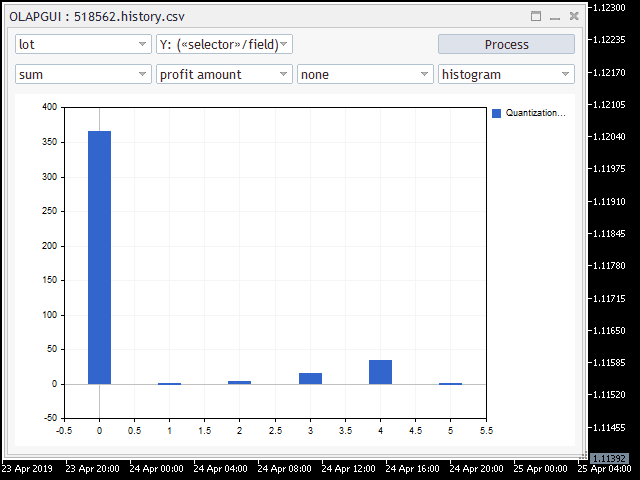
Profit by lot size (lots are indicated as cell indexes, the values are displayed in the log)
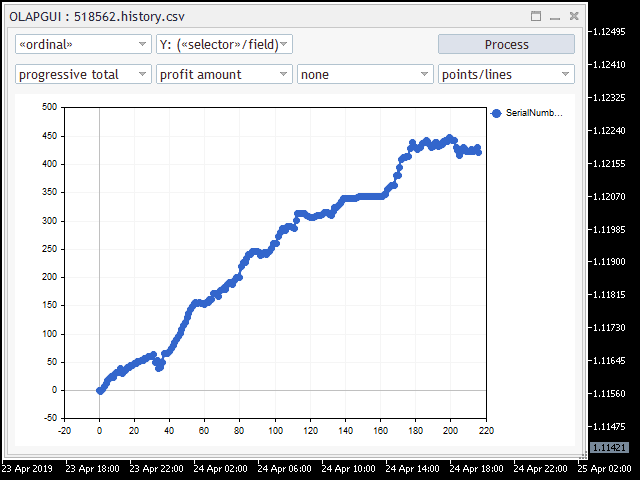
Total balance curve
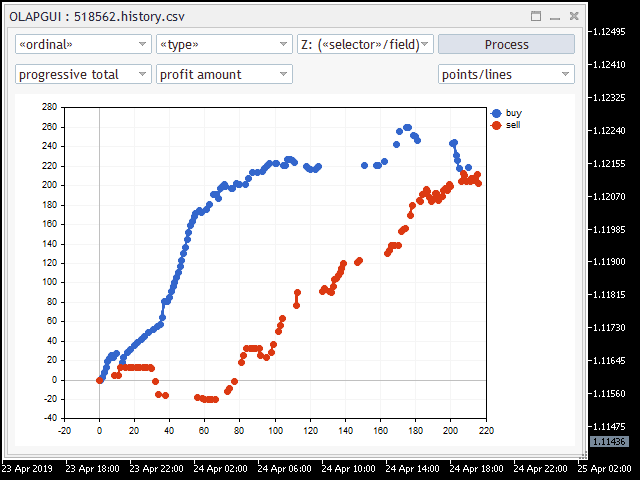
Balance by Buy and Sell operations
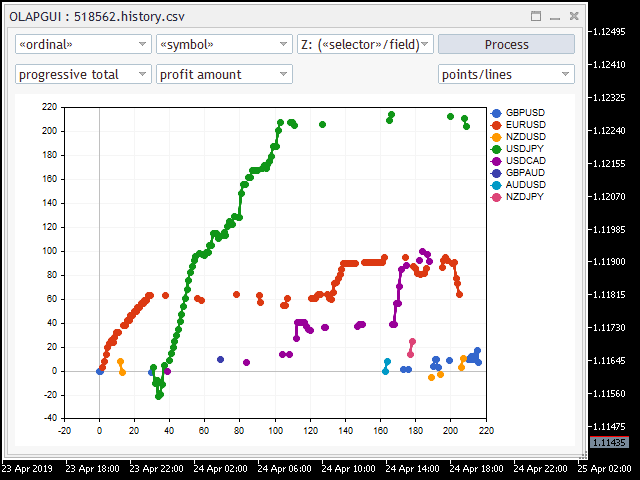
Balance curves for each symbol separately
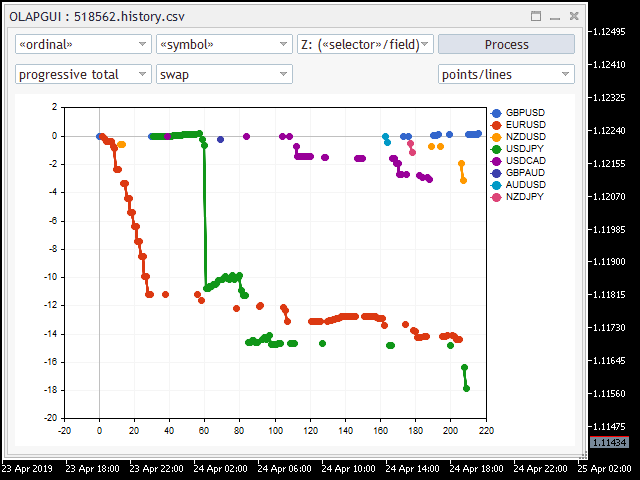
Swap curves for each symbol separately
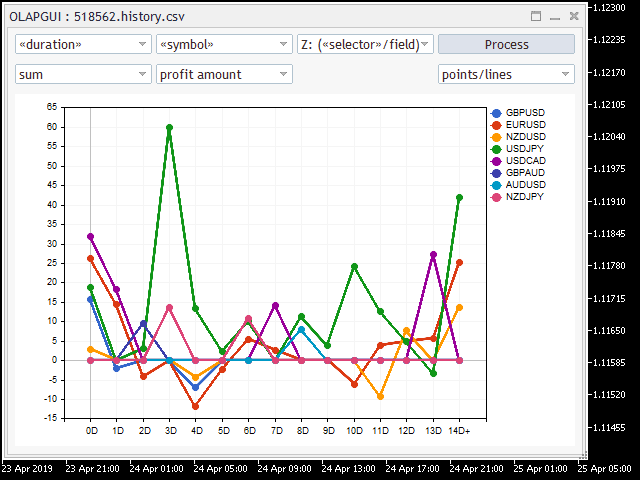
Profit dependence on the trade 'duration' for each symbol separately
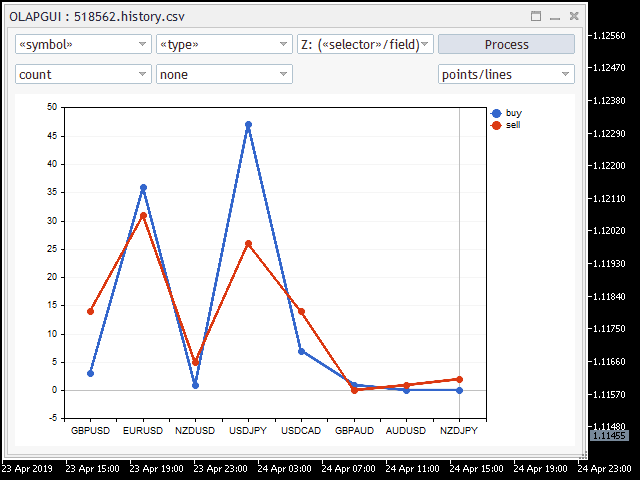
Number of deals by symbols and types
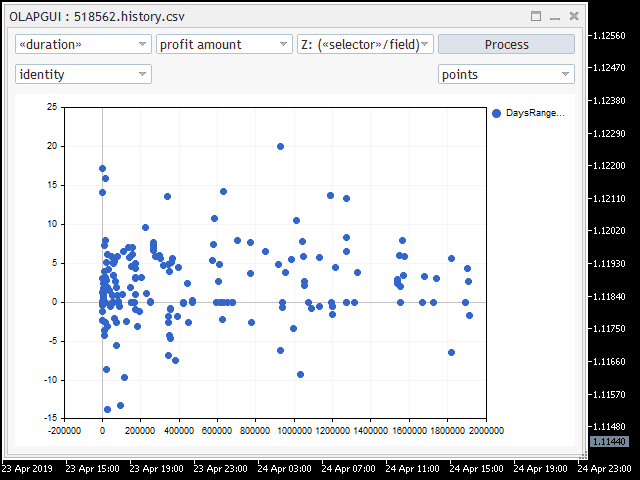
Dependence of 'Profit' and 'Duration' (in seconds) fields for each deal
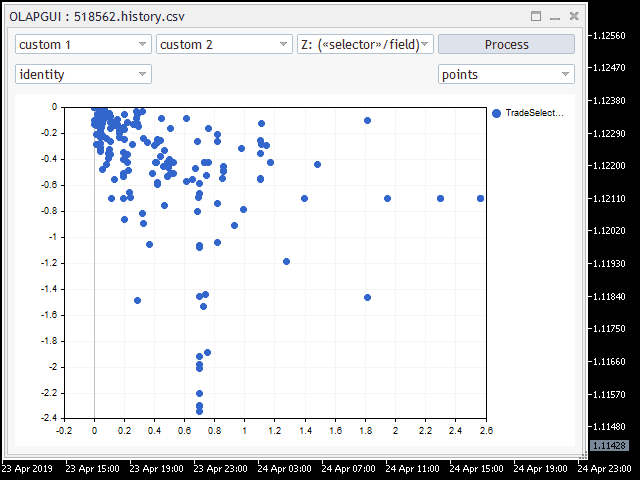
MFE (%) and MAE (%) dependencies for all deals
Unfortunately, the standard histogram drawing style does not provide for the display of several arrays with an offset of different arrays' columns having the same index. In other words, the values with the same coordinate can completely overlap each other. This problem can be solved by implementing a custom histogram visualization method (which can be done using the CGraphic class). But this solution is beyond the scope of this article.
Conclusions
In this article, we reviewed the general principles of GUI creation for MQL programs, which support resizing and universal layout of controls. On the basis of this technology, we have created an interactive application for the analysis of trading reports, which uses the developments from the first article in the OLAP series. The visualization of arbitrary combinations of various indicators helps in identifying hidden patterns and it simplifies multi-criteria analysis, which can be used for the optimization of trading systems.
See the below table for the description of the attached files.
The OLAPGUI project
- Experts/OLAP/OLAPGUI.mq5 — a demo Expert Advisor;
- Experts/OLAP/OLAPGUI.mqh — description of the graphical interface;
- Include/OLAP/OLAPcore.mqh — binding of the graphical interface with the OLAP core;
- Include/OLAP/OLAPcube.mqh — the main header file with the OLAP classes;
- Include/OLAP/PairArray.mqh — the array of [value;name] pairs with support for all sorting variants;
- Include/OLAP/HTMLcube.mqh — combining OLAP with data loaded from HTML reports;
- Include/OLAP/CSVcube.mqh — combining OLAP with data loaded from CSV files;
- Include/MT4orders.mqh — the MT4orders library for working with orders in a single style both in МТ4 and in МТ5;
- Include/Layouts/Box.mqh — the container of controls;
- Include/Layouts/ComboBoxResizable.mqh — the drop-down control, with the possibility of dynamic resizing;
- Include/Layouts/MaximizableAppDialog.mqh — the dialog window, with the possibility of dynamic resizing;
- Include/PairPlot/Plot.mqh — a control with chart graphics, with the support for dynamic resizing;
- Include/Marketeer/WebDataExtractor.mqh — the HTML parser;
- Include/Marketeer/empty_strings.h — the list of empty HTML tags;
- Include/Marketeer/HTMLcolumns.mqh — definition of column indexes in HTML reports;
- Include/Marketeer/CSVReader.mqh — the CSV parser;
- Include/Marketeer/CSVcolumns.mqh — definition of column indexes in CSV reports;
- Include/Marketeer/IndexMap.mqh — an auxiliary header file which implements an array with a key- and index-based combined access;
- Include/Marketeer/RubbArray.mqh — an auxiliary header file with the "rubber" array;
- Include/Marketeer/TimeMT4.mqh — an auxiliary header file which implements data processing functions in the MetaTrader 4 style;
- Include/Marketeer/Converter.mqh — an auxiliary header file for converting data types;
- Include/Marketeer/GroupSettings.mqh — an auxiliary header file which contains group settings of input parameters.
The SlidingPuzzle3 project
- Experts/Examples/Layouts/SlidingPuzzle3.mq5
- Experts/Examples/Layouts/SlidingPuzzle3.mqh
- Include/Layouts/GridTk.mqh
- Include/Layouts/Grid.mqh
- Include/Layouts/Box.mqh
Проект Controls3
- Experts/Examples/Layouts/Controls3.mq5
- Experts/Examples/Layouts/ControlsDialog3.mqh
- Include/Layouts/Box.mqh
- Include/Layouts/SpinEditResizable.mqh
- Include/Layouts/ComboBoxResizable.mqh
- Include/Layouts/MaximizableAppDialog.mqh
The PlotDemo project
- Experts/Examples/Layouts/PlotDemo.mq5
- Experts/Examples/Layouts/PlotDemo.mqh
- Include/OLAP/PairArray.mqh
- Include/Layouts/MaximizableAppDialog.mqh
Translated from Russian by MetaQuotes Ltd.
Original article: https://www.mql5.com/ru/articles/6603
Warning: All rights to these materials are reserved by MetaQuotes Ltd. Copying or reprinting of these materials in whole or in part is prohibited.
This article was written by a user of the site and reflects their personal views. MetaQuotes Ltd is not responsible for the accuracy of the information presented, nor for any consequences resulting from the use of the solutions, strategies or recommendations described.
 Applying OLAP in trading (part 1): Online analysis of multidimensional data
- Free trading apps
- Over 8,000 signals for copying
- Economic news for exploring financial markets
You agree to website policy and terms of use
The question in this wording is difficult for me to answer. The topic was OLAP. In this case GUI is a utilitarian necessity, so it is made in a minimal amount in the form of a standard library add-on. Something heavy and changeable (because of which the documentation - not unified, and in the form of a pile of patches) was decided not to use. Since the output interface is simple, those who want to can take their favourite GUI.
What's the difference from EasyAndFast?
Very good articles by the author. Unfortunately, the language has changed significantly since then, so it needs a decent refactoring for compilation.
I solve problems of broken compatibility on a point-by-point basis according to readers' requests. I don't have time to keep track of everything at once. So, if you have problems, write me.