

Market Microstructure in MQL5 (Part 9): Pullback Quality
 207
207
 0
0

This produced 514 valid sessions.Introduction
Part 1 built the defensive infrastructure. Parts 2 and 3 measured long memory. Part 4 measured volatility persistence. Part 5 decomposed noise. Part 6 measured order flow direction. Part 7 classified market regime. Part 8 measured bar-by-bar micro-trend strength with GetMicroTrendStrength() and its adaptive-threshold variant PopulateMicroTrendAnalysis().
Part 9 addresses the following failure mode: GetMicroTrendStrength() returns a positive value whenever price is above an upward-aligned EMA stack. It cannot distinguish between price near the move's leading edge (just above the lowest EMA and extended from consolidation) and price deep in a retracement near the original signal zone. Both bars carry a positive strength score. They do not carry the same expected value for a long entry.
Fibonacci retracement levels have been used in discretionary trading for decades not because markets "respect" magic ratios, but because they provide a shared vocabulary for describing where price is within a structured move. A retracement to 23.6% is objectively different from one to 61.8%: the former has given back little of the prior advance; the latter has surrendered most of it. Whether a particular retracement level constitutes support is a strategy-specific question. The depth measurement itself is strategy-neutral.
Part 9 adds seven functions to MicroStructure Foundation.mqh and introduces the PULLBACK QUALITY enum and the PullbackAnalysis struct. It also reports an empirical study on 514 NQ M1 NY sessions (May 2024–May 2026). The companion SSRN papers are cited in the references.
Deliverables: PULLBACK_QUALITY enum, PullbackAnalysis struct, GetPullbackDepth(), GetPullbackQuality(), GetH1RangeContext(), GetMomentumAutocorrelation(), GetPositiveAutocorrelation(), GetCompositePullbackScore(), and PopulatePullbackAnalysis(). No new include file is created; all code appends to MicroStructure_Foundation.mqh before the #endif.
Theory
Fibonacci Retracement as a Depth Metric
A Fibonacci retracement does not predict where price will reverse. It measures how far price has moved back toward its origin relative to a prior directional move. Given a swing high H and a swing low L, the retracement depth D at current close C is:
In an uptrend:  D = (H − C) / (H − L)
In a downtrend: D = (C − L) / (H − L)
When D = 0, price is at the full extension of the move (at or beyond the swing extreme). When D = 1, price has returned to the swing origin — the trend has fully retraced. When D > 1, price has moved beyond the origin: the prior directional structure is broken.
The implementation anchors the swing high and low on the most recent PB_SWING_BARS = 20 bars, recalculated on every bar. This rolling anchor means the depth measurement adapts to recent structure rather than locking to a fixed historical pivot. The trade-off is that the anchor can migrate during extended consolidation, compressing the denominator and amplifying small price moves into large apparent depth values. This limitation is discussed explicitly in the Limitations section.
Trend direction is determined by the alignment of EMA(5) and EMA(13) from Part 8, normalized by ATR(14). The normalization threshold PB_ALIGN_MIN = 0.05 requires that the EMA spread exceed 5% of ATR before a trend is asserted. Bars below this threshold return PBQ_NO_TREND.
The six PULLBACK_QUALITY levels are:
- PBQ_NO_TREND (0): EMA alignment below threshold; no trend to retrace into.
- PBQ_STRONG (1): D < 23.6%. Price is near the extension; the trend is intact and relatively uncontested.
- PBQ_HEALTHY (2): 23.6% ≤ D < 38.2%. Shallow retracement, commonly cited in discretionary practice as the highest-probability entry zone.
- PBQ_WARNING (3): 38.2% ≤ D < 61.8%. Meaningful retracement; trend is still present but has given back a substantial fraction of the prior move.
- PBQ_DEEP (4): 61.8% ≤ D ≤ 100%. Deep retracement approaching origin. Risk/reward has deteriorated relative to shallower entries.
- PBQ_BROKEN (5): D > 100%. Price has moved beyond the swing origin; the directional structure assumed by the trend signal is no longer valid.
H1 Session Range Context
The position of the current bar within the H1 session range provides a second dimension of context. A long setup at the bottom third of the daily range carries different structural meaning from one in the top third, even at the same Fibonacci depth. Combining both dimensions reduces false positives in mid-range chop.
Multi-timeframe access in MQL5 requires AddDataSeries() in custom indicators, which adds complexity and can introduce synchronization delays. Part 9 avoids this by using a 60-bar rolling maximum of M1 highs and a 60-bar rolling minimum of M1 lows as a proxy for the H1 range. At the NQ M1 session resolution (approximately 390 bars per NY session), 60 bars represents roughly one hour of clock time — the same window that a genuine H1 candle would span.
The approximation is imprecise. A 60-bar rolling window does not align to clock-hour boundaries, and the rolling high/low will migrate as the window slides. The result is a smooth, continuously-updated context measure rather than a step-function that resets at each hour boundary. This smoother behavior is arguably preferable for bar-by-bar scoring, but it is not the same as a genuine H1 open/high/low/close. This limitation is stated explicitly in the function header and in the Limitations section.
GetH1RangeContext() returns h1_position in [0, 1], where 0.0 = close at the 60-bar rolling low and 1.0 = close at the 60-bar rolling high.
Momentum Autocorrelation
The lag-1 autocorrelation of M1 close-to-close returns measures the serial dependence of consecutive bar moves. A positive autocorrelation indicates that an up-bar tends to be followed by another up-bar — momentum persistence, the microstructure signature of informed directional flow. A negative autocorrelation indicates that up-bars tend to be followed by down-bars — mean-reversion, the signature of bid-ask bounce and microstructure noise.
GetMomentumAutocorrelation() computes the Pearson correlation between adjacent returns r[t] and r[t-1] over a PB_AUTOCORR_WIN = 20-bar rolling window. The positive-only component GetPositiveAutocorrelation() = max(0, autocorrelation) is used as input to the composite score, because negative autocorrelation (mean-reversion) is an unfavorable entry environment that should reduce the composite score, not boost it. Clipping at zero achieves this.
As documented in Part 5, NQ M1 returns exhibit mild negative autocorrelation as a structural feature at one-minute resolution. The 20-bar window identifies periods where this structural tendency is temporarily overcome by stronger directional pressure. These windows coincide with periods of sustained momentum — the same environment where shallow pullback entries are most productive.
Composite Pullback Score
The composite score aggregates the three dimensions into a single entry-quality value in [0, 1]:
composite = 0.50 × fib_quality + 0.30 × h1_position + 0.20 × ac_positive
where fib_quality = clip(1 − D, 0, 1) for valid depth D ≤ 1.0, and fib_quality = 0 for PBQ_NO_TREND or PBQ_BROKEN. Higher composite values correspond to shallower pullbacks in favorable H1 position with momentum-persistent environments.
The weights (50/30/20) are engineering heuristics, not regression-derived coefficients. They reflect the relative informativeness of each component: Fibonacci depth is the primary signal, H1 context is secondary, and autocorrelation is a tertiary filter. Any calibration to a specific strategy or instrument should treat these weights as free parameters to be optimized on in-sample data and validated out-of-sample.
Implementation
All code appends to MicroStructure_Foundation.mqh before the #endif. No new include files are created. Functions use SafeCopyClose(), CopyHigh(), CopyLow(), ComputeEMAAt(), and ComputeATR() from Parts 1–8. CopyTickVolume() is not used in Part 9 (no volume-weighted components).
Constants and Enumerations
//--- Fibonacci retracement constants (inline documentation)
#define PB_FIBO_236  0.236  // Fibonacci 23.6% retracement level
#define PB_FIBO_382  0.382  // Fibonacci 38.2% retracement level
#define PB_FIBO_618  0.618  // Fibonacci 61.8% retracement level

//--- Pullback computation parameters
#define PB_SWING_BARS    20  // Bars to establish swing high/low anchor
#define PB_AUTOCORR_WIN  20  // lag-1 autocorrelation rolling window
#define PB_H1_PROXY_BARS 60  // 60 M1 bars ≈ 1 H1 bar (proxy for H1 range)
#define PB_ALIGN_MIN     0.05 // Minimum |EMA5-EMA13|/ATR to assert a trend

//--- Composite score weights (must sum to 1.0)
#define PB_W_FIB      0.50  // Fibonacci quality weight
#define PB_W_H1       0.30  // H1 range context weight
#define PB_W_AUTOCORR 0.20  // Momentum autocorrelation weight

//+------------------------------------------------------------------+
//| PULLBACK_QUALITY: Fibonacci-mapped retracement quality label.    |
//| Integers reflect ordinal depth: higher = deeper retracement.     |
//+------------------------------------------------------------------+
enum PULLBACK_QUALITY
  {
   PBQ_NO_TREND = 0,  // No trend signal — EMA alignment below threshold
   PBQ_STRONG   = 1,  // Depth < 23.6%  — price near extension, trend intact
   PBQ_HEALTHY  = 2,  // Depth 23.6–38.2% — shallow retracement, valid entry
   PBQ_WARNING  = 3,  // Depth 38.2–61.8% — retracement approaching midpoint
   PBQ_DEEP     = 4,  // Depth > 61.8%  — approaching trend origin
   PBQ_BROKEN   = 5,  // Depth > 100%   — price beyond swing origin
  };
PullbackAnalysis Struct
//+------------------------------------------------------------------+
//| PullbackAnalysis: pullback quality measurement result.           |
//| Populated by PopulatePullbackAnalysis().                         |
//| depth: Fibonacci retracement fraction [0,∞).                     |
//|   0.0 = price at full extension; 1.0 = price at swing origin.    |
//|   > 1.0 = structure broken.                                      |
//| h1_position: price location in 60-bar rolling range [0,1].       |
//| composite_score: weighted entry quality [0,1] (higher = better). |
//| momentum_autocorr: lag-1 return autocorrelation [-1,+1].         |
//|   Positive = momentum persistence; negative = mean-reversion.    |
//| persistent_dir: dominant direction from MicroTrendAnalysis (+1,  |
//|   -1, or 0).                                                     |
//+------------------------------------------------------------------+
struct PullbackAnalysis
  {
   double          depth;            // Fibonacci retracement depth [0,∞)
   PULLBACK_QUALITY quality;         // PBQ label mapped from depth
   double          h1_position;      // Price in 60-bar rolling range [0,1]
   double          composite_score;  // Weighted entry quality [0,1]
   double          momentum_autocorr;// lag-1 return autocorrelation [-1,+1]
   int             persistent_dir;   // Trend direction: +1, -1, or 0
  };
GetPullbackDepth()
//+------------------------------------------------------------------+
//| GetPullbackDepth: Fibonacci retracement depth from swing high/   |
//| low anchor.                                                      |
//|                                                                  |
//| Returns retracement fraction [0,∞) relative to the current bar:  |
//|   Uptrend:   (swing_high - close) / (swing_high - swing_low)     |
//|   Downtrend: (close - swing_low)  / (swing_high - swing_low)     |
//|                                                                  |
//| Trend direction determined by EMA5 vs EMA13 alignment,           |
//| normalized by ATR. If alignment < PB_ALIGN_MIN, returns -1.0     |
//| (no-trend sentinel).                                             |
//|                                                                  |
//| ComputeATR() and ComputeEMAAt() (Part 8) require chronological   |
//| arrays (index 0 = oldest bar). CopyHigh/CopyLow/SafeCopyClose    |
//| return newest-first, so the working arrays are reversed before   |
//| being passed to the Part 8 helpers.                              |
//|                                                                  |
//| is_uptrend_out: set to true if EMA alignment is bullish.         |
//+------------------------------------------------------------------+
double GetPullbackDepth(const string symbol, const int tf,
                        const int period, bool &is_uptrend_out)
  {
   is_uptrend_out = false;
   if(!ValidateSymbolV2(symbol) || period < PB_SWING_BARS + 13 + 14)
      return -1.0;
//--- Copy price arrays, newest-first (index 0 = current bar)
   double high[], low[], close[];
   ArraySetAsSeries(high,  true);
   ArraySetAsSeries(low,   true);
   int copy_n = period;
   if(CopyHigh(symbol, (ENUM_TIMEFRAMES)tf, 0, copy_n, high) < copy_n) return -1.0;
   if(CopyLow (symbol, (ENUM_TIMEFRAMES)tf, 0, copy_n, low)  < copy_n) return -1.0;
   if(SafeCopyClose(symbol, tf, 0, copy_n, close)            < copy_n) return -1.0;

//--- Build chronological arrays (index 0 = oldest) for ComputeATR/ComputeEMAAt
   double hi_chron[], lo_chron[], cl_chron[];
   ArrayResize(hi_chron, copy_n);
   ArrayResize(lo_chron, copy_n);
   ArrayResize(cl_chron, copy_n);
   for(int i = 0; i < copy_n; i++)
     {
      hi_chron[i] = high [copy_n - 1 - i];
      lo_chron[i] = low  [copy_n - 1 - i];
      cl_chron[i] = close[copy_n - 1 - i];
     }
   int last = copy_n - 1;   // current bar's index in chronological order

//--- ATR at the current bar (Part 8 helper: hi[], lo[], cl[], n, period)
   double cur_atr = ComputeATR(hi_chron, lo_chron, cl_chron, copy_n, 14);
   if(cur_atr < DBL_EPSILON) return -1.0;
//--- EMA5 and EMA13 at the current bar (Part 8 helper: arr[], n, period, idx)
   double ema_fast = ComputeEMAAt(cl_chron, copy_n, 5,  last);
   double ema_slow = ComputeEMAAt(cl_chron, copy_n, 13, last);
   if(ema_fast <= 0.0 || ema_slow <= 0.0) return -1.0;
//--- Trend direction: normalized alignment
   double align_norm = (ema_fast - ema_slow) / (cur_atr + DBL_EPSILON);
   if(MathAbs(align_norm) < PB_ALIGN_MIN) return -1.0; // no trend sentinel
   is_uptrend_out = (align_norm > 0.0);
//--- Swing high/low over PB_SWING_BARS bars ending at current bar
//--- (uses newest-first arrays — unaffected by the ordering fix above)
   double sw_high = high[0];
   double sw_low  = low[0];
   for(int i = 1; i < PB_SWING_BARS && i < copy_n; i++)
     {
      if(high[i] > sw_high) sw_high = high[i];
      if(low[i]  < sw_low ) sw_low  = low[i];
     }
   double sw_range = sw_high - sw_low;
   if(sw_range < DBL_EPSILON) return -1.0;
//--- Retracement depth
   double depth;
   if(is_uptrend_out)
      depth = (sw_high - close[0]) / sw_range;
   else
      depth = (close[0] - sw_low) / sw_range;
   return MathMax(0.0, depth); // negative depth (above swing high) floors at 0
  }
GetPullbackQuality()
//+------------------------------------------------------------------+
//| GetPullbackQuality: maps retracement depth to PULLBACK_QUALITY.  |
//| depth < 0 (no-trend sentinel) → PBQ_NO_TREND.                    |
//+------------------------------------------------------------------+
PULLBACK_QUALITY GetPullbackQuality(double depth)
  {
   if(depth < 0.0)            return PBQ_NO_TREND;
   if(depth < PB_FIBO_236)    return PBQ_STRONG;
   if(depth < PB_FIBO_382)    return PBQ_HEALTHY;
   if(depth < PB_FIBO_618)    return PBQ_WARNING;
   if(depth <= 1.0)           return PBQ_DEEP;
   return PBQ_BROKEN;
  }
GetH1RangeContext()
//+------------------------------------------------------------------+
//| GetH1RangeContext: price position in 60-bar rolling range.       |
//|                                                                  |
//| Uses the 60 most recent M1 bars as a proxy for the H1 candle     |
//| range. This avoids AddDataSeries() and multi-timeframe access.   |
//| The approximation overstates H1 range when sub-ranges do not     |
//| overlap cleanly across the hour boundary. See Limitations.       |
//|                                                                  |
//| Returns h1_position in [0,1]:                                    |
//|   0.0 = close at rolling low (bearish context)                   |
//|   1.0 = close at rolling high (bullish context)                  |
//+------------------------------------------------------------------+
double GetH1RangeContext(const string symbol, const int tf)
  {
   if(!ValidateSymbolV2(symbol)) return 0.5;
   double high[], low[], close[];
   ArraySetAsSeries(high,  true);
   ArraySetAsSeries(low,   true);
   int n = PB_H1_PROXY_BARS;
   if(CopyHigh(symbol, (ENUM_TIMEFRAMES)tf, 0, n, high) < n) return 0.5;
   if(CopyLow (symbol, (ENUM_TIMEFRAMES)tf, 0, n, low)  < n) return 0.5;
   if(SafeCopyClose(symbol, tf, 0, 1, close)            < 1) return 0.5;
//--- Rolling maximum high and minimum low
   double roll_high = high[0];
   double roll_low  = low[0];
   for(int i = 1; i < n; i++)
     {
      if(high[i] > roll_high) roll_high = high[i];
      if(low[i]  < roll_low ) roll_low  = low[i];
     }
   double roll_range = roll_high - roll_low;
   if(roll_range < DBL_EPSILON) return 0.5;
   return MathMax(0.0, MathMin(1.0, (close[0] - roll_low) / roll_range));
  }
GetMomentumAutocorrelation()
//+------------------------------------------------------------------+
//| GetMomentumAutocorrelation: lag-1 autocorrelation of M1 returns. |
//|                                                                  |
//| Computes Pearson correlation between r[t] and r[t-1] over a      |
//| PB_AUTOCORR_WIN bar rolling window.                              |
//|   +1 = perfect momentum (consecutive same-direction moves)       |
//|   -1 = perfect mean-reversion (alternating direction)            |
//|    0 = no serial correlation                                     |
//|                                                                  |
//| At M1 resolution, NQ returns are mildly mean-reverting           |
//| (negative autocorrelation) due to bid-ask bounce and microstruc- |
//| ture noise. Positive autocorrelation identifies momentum windows.|
//+------------------------------------------------------------------+
double GetMomentumAutocorrelation(const string symbol, const int tf,
                                   const int window)
  {
   if(!ValidateSymbolV2(symbol) || window < 4) return 0.0;
   double close[];
   ArraySetAsSeries(close, true);
   int need = window + 1;
   if(SafeCopyClose(symbol, tf, 0, need, close) < need) return 0.0;
//--- Build return array (index 0 = most recent)
   double ret[];
   ArrayResize(ret, window);
   for(int i = 0; i < window; i++)
     {
      if(close[i+1] <= DBL_EPSILON) { ret[i] = 0.0; continue; }
      ret[i] = (close[i] - close[i+1]) / close[i+1];
      //--- Discard gross outliers (> 5% per bar — data error guard)
      if(MathAbs(ret[i]) > 0.05) ret[i] = 0.0;
     }
//--- Two-pass Pearson correlation of lag-1 pairs
   int    pairs = window - 1;
   if(pairs < 3) return 0.0;
   double mean1 = 0.0, mean2 = 0.0;
   for(int i = 0; i < pairs; i++) { mean1 += ret[i]; mean2 += ret[i+1]; }
   mean1 /= pairs; mean2 /= pairs;
   double cov = 0.0, var1 = 0.0, var2 = 0.0;
   for(int i = 0; i < pairs; i++)
     {
      double d1 = ret[i]   - mean1;
      double d2 = ret[i+1] - mean2;
      cov  += d1 * d2;
      var1 += d1 * d1;
      var2 += d2 * d2;
     }
   double denom = MathSqrt(var1 * var2);
   if(denom < DBL_EPSILON) return 0.0;
   return MathMax(-1.0, MathMin(1.0, cov / denom));
  }
GetPositiveAutocorrelation()
//+------------------------------------------------------------------+
//| GetPositiveAutocorrelation: momentum persistence component.      |
//| Returns max(0, lag-1 autocorrelation) — clips mean-reversion to  |
//| zero. Used as the autocorrelation input to the composite score   |
//| because only positive (momentum) autocorrelation signals a       |
//| favorable pullback entry environment.                            |
//+------------------------------------------------------------------+
double GetPositiveAutocorrelation(const string symbol, const int tf,
                                   const int window)
  {
   return MathMax(0.0, GetMomentumAutocorrelation(symbol, tf, window));
  }
GetCompositePullbackScore()
//+------------------------------------------------------------------+
//| GetCompositePullbackScore: weighted entry quality [0,1].         |
//|                                                                  |
//| composite = 0.50 * fib_quality                                   |
//|           + 0.30 * h1_position                                   |
//|           + 0.20 * momentum_autocorr_positive                    |
//|                                                                  |
//| fib_quality = clip(1 - depth, 0, 1) for valid depth;             |
//|              = 0.0 for PBQ_NO_TREND or PBQ_BROKEN.               |
//|                                                                  |
//| Higher score indicates a structurally stronger entry setup:      |
//| shallow retracement + price in favorable H1 position +           |
//| momentum-persistent environment.                                 |
//|                                                                  |
//| Engineering heuristic. Weights are not derived from a regression.|
//| Recalibrate on your own instrument and strategy before use.      |
//+------------------------------------------------------------------+
double GetCompositePullbackScore(double depth, double h1_position,
                                  double momentum_autocorr_positive)
  {
   double fib_quality;
   if(depth < 0.0 || depth > 1.0)
      fib_quality = 0.0;  // no-trend or broken structure
   else
      fib_quality = MathMax(0.0, MathMin(1.0, 1.0 - depth));
   double score = PB_W_FIB      * fib_quality
                + PB_W_H1       * h1_position
                + PB_W_AUTOCORR * momentum_autocorr_positive;
   return MathMax(0.0, MathMin(1.0, score));
  }
PopulatePullbackAnalysis()
//+------------------------------------------------------------------+
//| PopulatePullbackAnalysis: single-call wrapper.                   |
//| Fills all fields of PullbackAnalysis for the current bar.        |
//| Uses MicroTrendAnalysis.persistent_dir for directional context.  |
//|                                                                  |
//| period: number of bars available (must be >= PB_SWING_BARS + 27).|
//| mta: populated MicroTrendAnalysis from Part 8 (read only).       |
//|                                                                  |
//| NaN guard: sets composite_score = 0 and quality = PBQ_NO_TREND   |
//| if any upstream input returns an invalid sentinel.               |
//+------------------------------------------------------------------+
void PopulatePullbackAnalysis(const string symbol, const int tf,
                               const int period,
                               PullbackAnalysis        &pba,
                               const MicroTrendAnalysis &mta)
  {
//--- Initialize to safe defaults
   pba.depth             = -1.0;
   pba.quality           = PBQ_NO_TREND;
   pba.h1_position       = 0.5;
   pba.composite_score   = 0.0;
   pba.momentum_autocorr = 0.0;
   pba.persistent_dir    = mta.persistent_dir;
//--- 1. Fibonacci retracement depth
   bool is_up = false;
   pba.depth   = GetPullbackDepth(symbol, tf, period, is_up);
   pba.quality = GetPullbackQuality(pba.depth);
//--- 2. H1 range context (60-bar rolling proxy)
   pba.h1_position = GetH1RangeContext(symbol, tf);
//--- 3. Momentum autocorrelation
   pba.momentum_autocorr = GetMomentumAutocorrelation(symbol, tf,
                                                       PB_AUTOCORR_WIN);
   double ac_pos = MathMax(0.0, pba.momentum_autocorr);
//--- 4. Composite score
   pba.composite_score = GetCompositePullbackScore(pba.depth,
                                                    pba.h1_position,
                                                    ac_pos);
//--- NaN guards
   if(!MathIsValidNumber(pba.depth))             pba.depth             = -1.0;
   if(!MathIsValidNumber(pba.h1_position))       pba.h1_position       = 0.5;
   if(!MathIsValidNumber(pba.momentum_autocorr)) pba.momentum_autocorr = 0.0;
   if(!MathIsValidNumber(pba.composite_score))   pba.composite_score   = 0.0;
   if(!MathIsValidNumber(pba.depth) || pba.depth < 0.0)
      pba.quality = PBQ_NO_TREND;
  }
Empirical Study: 514 NQ M1 NY Sessions
A study on the full 2-year NQ M1 dataset (May 2024–May 2026), filtered to NY sessions (14:30–21:00 UTC) with a minimum of 300 bars, which produced 514 valid sessions. Regime labels from Part 7 (nq_regime_metrics.csv) were merged by date. Results are reported bar-level averages aggregated into session means.
Overall Pullback Depth Distribution
Across all 514 sessions, the mean pullback depth — the average fraction of the 20-bar swing range that the current bar has retraced — was 0.234 (median 0.235, std 0.020, P25 0.221, P75 0.248). This places the typical NQ M1 bar just at the border of the PBQ_STRONG zone (depth < 0.236). The distribution is narrow: the interquartile range spans only 2.7 percentage points, indicating that session-mean depth is remarkably stable across time.
In terms of bar-level PBQ label frequency, 51.2% of all bars are classified PBQ_STRONG (depth < 23.6%), 24.2% PBQ_HEALTHY (23.6–38.2%), 16.6% PBQ_WARNING (38.2–61.8%), 1.1% PBQ_DEEP, 0.0% PBQ_BROKEN, and 6.9% PBQ_NO_TREND (EMA alignment below the PB_ALIGN_MIN threshold).
Pullback Quality Metrics by Regime
| Regime | N | Mean Depth | %Strong | %Healthy | %Warning | %Deep | Mean AC | Mean Score |
|---|---|---|---|---|---|---|---|---|
| Normal | 257 | 0.237 | 50.5% | 24.5% | 16.9% | 1.1% | −0.062 | 0.563 |
| Stressed | 110 | 0.225 | 54.0% | 23.3% | 15.4% | 0.9% | −0.072 | 0.554 |
| Noisy | 51 | 0.228 | 52.7% | 24.1% | 15.6% | 1.0% | −0.067 | 0.541 |
| Informed | 38 | 0.234 | 51.2% | 23.7% | 17.0% | 1.2% | −0.083 | 0.565 |
| Trending | 37 | 0.246 | 47.9% | 25.5% | 17.9% | 1.3% | −0.074 | 0.564 |
| Mean-Reverting | 21 | 0.246 | 48.2% | 24.4% | 18.1% | 1.4% | −0.069 | 0.549 |
The table above reports mean pullback depth, PBQ label frequency, and momentum autocorrelation for each of the six regimes from Part 7.
Hypothesis Test: Trending Regime Pullback Depth
The theoretical prediction entering this study was that Trending regime sessions — identified in Part 7 by high clustering index and below-median delta-alpha — would exhibit shallower mean pullback depth (< 38.2%) compared to Normal and Noisy sessions, because sustained directional momentum should prevent deep retracements.
The data do not support this prediction. Trending sessions produced a mean depth of 0.246, which is marginally deeper than the Normal+Noisy combined mean of 0.236 (Mann-Whitney U = 7,306, one-sided p = 0.998). The hypothesis is not supported at any conventional significance level.
A plausible interpretation is that Part 7 flags Trending sessions via clustering and memory structure, but the 20-bar rolling swing anchor here is too short to capture the directional structure separating trending from choppy markets. A 20-bar window in a strongly trending session will frequently have both its high and its low moving upward together, causing the depth measurement to reflect local consolidation rather than the primary trend's retracement. The choice of swing lookback is a parameter that practitioners should calibrate to their own strategy's timeframe.
The Stressed regime produced the shallowest mean depth (0.225), which is more structurally interpretable: impulsive gap-and-run sessions driven by macro events (the Fed December 2024 episode at mean depth 0.215, and the Tariff April 2025 episode at 0.218) tend to not retrace because the regime transition itself is the directional event.
Momentum Autocorrelation Results
All six regimes exhibit negative mean lag-1 autocorrelation, ranging from −0.062 (Normal) to −0.083 (Informed). This finding is consistent with the bid-ask bounce and microstructure noise results from Part 5. At one-minute resolution, NQ returns are structurally mean-reverting: consecutive bars are more likely to alternate direction than to continue. This is not a signal of market inefficiency — it is a predictable consequence of aggregating thousands of individual trades into fixed-time bars, where the noise in close prices dominates the autocorrelation structure.
The implication for the composite score is that the autocorrelation component (weight PB_W_AUTOCORR = 0.20) will contribute zero in the majority of bars, since negative autocorrelation is clipped to zero by GetPositiveAutocorrelation(). The composite score therefore reduces in practice to approximately 0.50 × fib_quality + 0.30 × h1_position in most sessions. The autocorrelation component contributes positively only during brief momentum windows. Practitioners should factor this into their interpretation of composite score values.
Stress Episode Results
Four stress episodes are identifiable in the dataset. The BoJ shock (August 2024, n = 22) produced a mean depth of 0.235 in NORMAL regime, near the sample average. The Fed December 2024 episode (n = 5) produced the shallowest stress episode mean at 0.215 in STRESSED regime, consistent with the theory that impulsive post-FOMC moves do not retrace. The Tariff April 2025 shock (n = 11, STRESSED) produced mean depth 0.218, the sharpest directional move in the sample. The Tariff April 2026 episode (n = 21, NORMAL) showed mean depth 0.237, suggesting that market participants had adapted to tariff risk by April 2026 and the vol response was more contained.
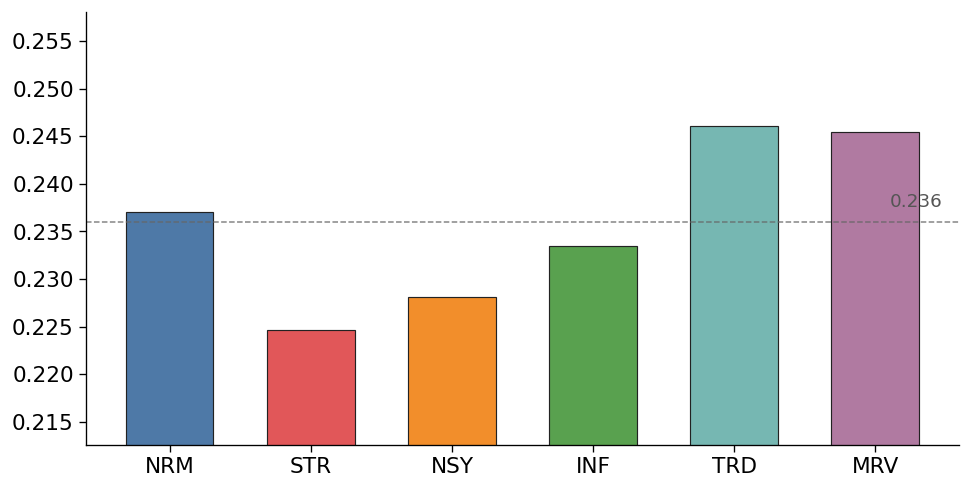
Figure 1 — Mean session pullback depth by regime. A dashed line marks the 0.236 Fibonacci level. All regimes cluster near the 0.236 boundary. STR sessions are shallowest (0.225); TRD and MRV sessions are deepest (0.246).
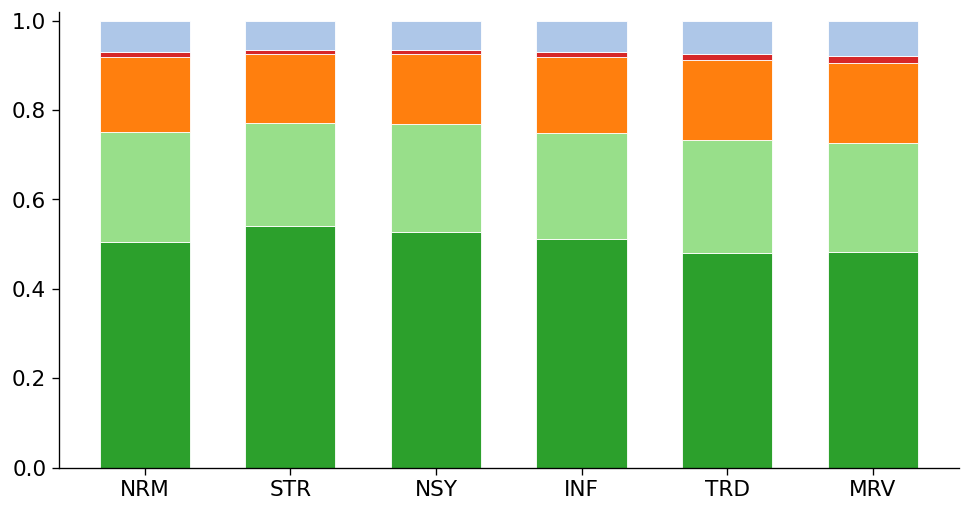
Figure 2 — Bar-level PBQ label frequency by regime (stacked). From bottom: PBQ_STRONG (dark green), PBQ_HEALTHY (light green), PBQ_WARNING (orange), PBQ_DEEP (red), PBQ_BROKEN (purple), PBQ_NO_TREND (blue). PBQ_STRONG dominates in all regimes (47.9%–54.0%); PBQ_BROKEN never occurs.
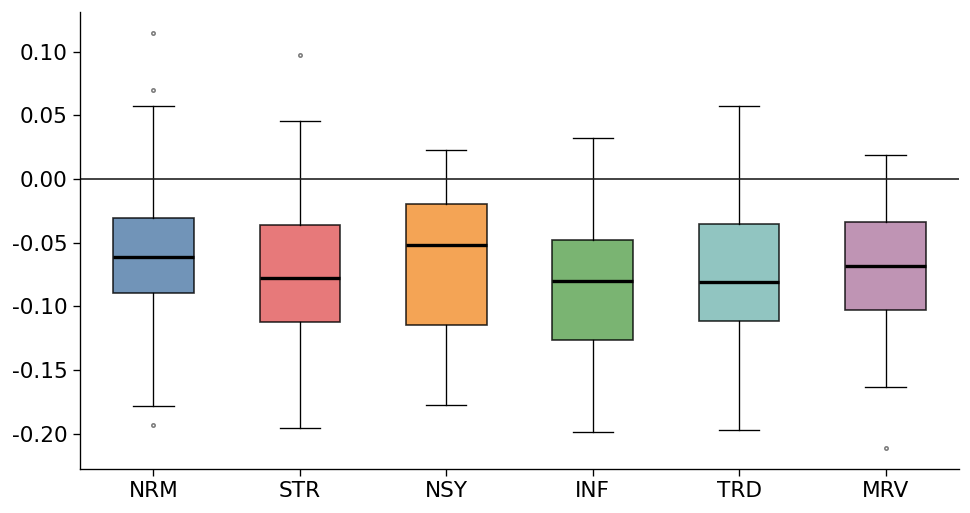
Figure 3 — Session-mean lag-1 return autocorrelation by regime (boxplots). The solid horizontal line marks zero. All six regimes center below zero, confirming that NQ M1 returns are structurally mean-reverting at one-minute resolution across the full sample.
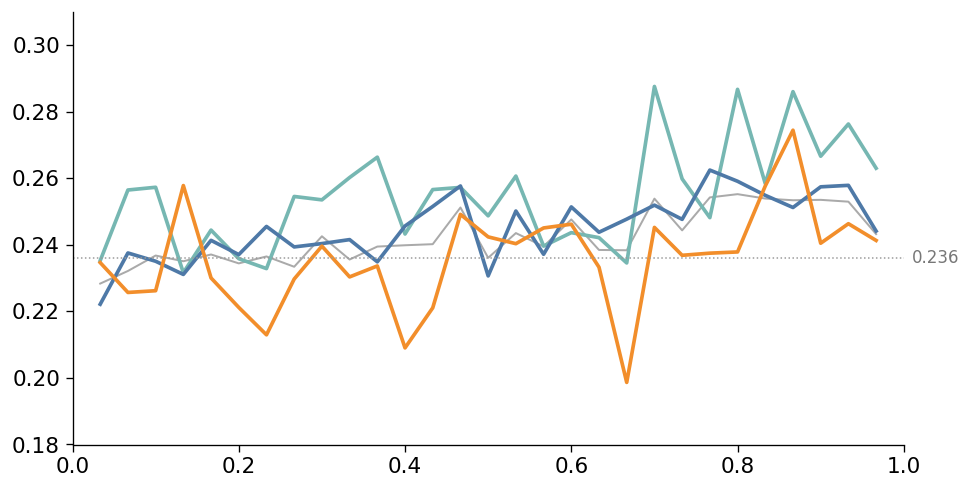
Figure 4 — Mean pullback depth by relative session position (0 = open, 1 = close). Grey line: all sessions. Colored lines: TRD (teal), NRM (blue), NSY (orange). Dotted horizontals mark 0.236 and 0.382. Depth profiles are nearly identical across regimes, confirming that the 20-bar rolling anchor does not distinguish regime structure.
Limitations
Rolling swing anchor migration. The 20-bar rolling high/low anchor for the swing range migrates on every bar. During low-volatility consolidation, the swing range compresses, and small price moves produce large apparent depth values. During expansive trending sessions, the rolling anchor follows price, keeping depth values artificially low regardless of the actual retracement structure. The PB_SWING_BARS = 20 default is an engineering heuristic — it should be calibrated to the strategy's lookback before use.
H1 proxy approximation. The 60-bar rolling maximum and minimum are used as a proxy for the H1 session high and low to avoid AddDataSeries(). This proxy does not align to clock-hour boundaries and does not represent the actual H1 OHLC candle. The rolling window will span parts of two H1 bars near the hour boundary, producing a high/low that overstates the true single-hour range. This is the same approximation posture adopted for the FIGARCH parameter in Part 4 and the VPIN bucket approximation in Part 6 — disclosed explicitly and retained as the best OHLCV-only estimate.
Negative autocorrelation dominance. At M1 resolution, NQ lag-1 autocorrelation is structurally negative across all regimes. The GetPositiveAutocorrelation() component of the composite score therefore contributes zero in the majority of bars. The composite score is effectively a two-factor model (Fibonacci quality + H1 context) for most sessions, with the autocorrelation component serving as a booster only during brief momentum windows.
Composite score weights are engineering heuristics. The 50/30/20 weighting for Fibonacci quality, H1 context, and momentum autocorrelation is not derived from a regression or optimization. These weights encode the author's prior about relative informativeness. They have not been validated against out-of-sample return predictability. Practitioners should treat them as a starting point and recalibrate on their own instrument, strategy, and sample period.
No forward-return validation. The empirical study reports pullback depth distribution and autocorrelation statistics. It does not test whether higher composite scores predict better forward returns. That validation requires a defined entry/exit rule, slippage assumptions, and an out-of-sample period — all of which are strategy-specific and outside the scope of a measurement-layer article.
Practical Usage
Standalone Usage
#include "Includes\MicroStructure_Foundation.mqh"

//--- In OnTick() or OnCalculate():
MicroTrendAnalysis mta;
PopulateMicroTrendAnalysis(Symbol(), PERIOD_M1, 390, mta, /*regime*/ ra);

PullbackAnalysis pba;
PopulatePullbackAnalysis(Symbol(), PERIOD_M1, 390, pba, mta);

if(mta.binary_signal == 1 && pba.quality == PBQ_HEALTHY)
  {
   //--- Trend up, healthy pullback — this is the condition to evaluate
   //--- Entry logic is strategy-specific; this is not a trade signal
   double entry_size = pba.composite_score;  // scale by quality [0,1]
  }
Full Chain Usage (Parts 2–9)
#include "Includes\MicroStructure_Foundation.mqh"

RobustFractalAnalysis  rfa;
VolatilityAnalysis     va;
MicrostructureAnalysis msa;
OrderFlowAnalysis      ofa;
RegimeAnalysis         ra;
MicroTrendAnalysis     mta;
PullbackAnalysis       pba;

//--- Step 1: Populate regime (calls Parts 2-6 internally)
PopulateRegimeAnalysis(Symbol(), PERIOD_M1, 390, ra, rfa, va, msa, ofa,
                       vol_baseline);
//--- Step 2: Populate micro-trend (Part 8, adaptive overload)
PopulateMicroTrendAnalysis(Symbol(), PERIOD_M1, 390, mta, ra);
//--- Step 3: Populate pullback quality (Part 9)
PopulatePullbackAnalysis(Symbol(), PERIOD_M1, 390, pba, mta);

//--- Three-gate filter: regime + trend + pullback
bool long_setup = (ra.regime  != REGIME_STRESSED)
               && (mta.binary_signal == 1)
               && (pba.quality == PBQ_STRONG || pba.quality == PBQ_HEALTHY)
               && (pba.composite_score > 0.55);
Include Path
#include "Includes\MicroStructure_Foundation.mqh"
Conclusion
Part 9 adds a second measurement dimension to the micro-trend signal from Part 8. The GetPullbackDepth() function measures how far the current bar has retraced from its 20-bar swing extreme, normalized to Fibonacci levels. GetH1RangeContext() provides price location within the 60-bar rolling range as an H1 proxy. GetMomentumAutocorrelation() measures lag-1 return serial dependence over a 20-bar rolling window. The composite score in GetCompositePullbackScore() combines these three inputs (50/30/20 weights) into a single entry-quality measure in [0, 1].
The empirical study on 514 NQ M1 NY sessions produced three actionable findings. First, the average NQ M1 bar sits at approximately 23.4% retracement depth — at the border of PBQ_STRONG and PBQ_HEALTHY — with very low cross-session variance (std = 0.020). Second, the theoretical hypothesis that Trending sessions produce shallower pullbacks was not supported; Stressed sessions produced the shallowest depths, driven by impulsive macro-event moves that did not retrace. Third, lag-1 return autocorrelation is negative across all regimes at M1 resolution, confirming the microstructure noise results from Part 5. The autocorrelation component of the composite score is therefore inactive in most sessions.
To use PopulatePullbackAnalysis(): call it after PopulateMicroTrendAnalysis() on every new bar. Apply the three-gate filter (regime from Part 7, binary signal from Part 8, PBQ label from Part 9) before evaluating entry quality. Apply the composite score as a position-sizing scalar, not a binary entry trigger. Part 10 will add intraday seasonality and wavelet decomposition as the tenth measurement layer.
Getting the Source Code via MQL5 Algo Forge
The full source for Part 9 — including the updated header MicroStructure_Foundation.mqh (v9.00), and the empirical output files — is available in the Algo Forge repository: MQL5 Algo Forge.
References
- Previous publications
- Brown, Max (2026). Measuring the Memory Structure of Intraday Returns (April 01, 2026). Available at SSRN: https://ssrn.com/abstract=6809080.
- Brown, Max (2026). Intraday Microstructure Dynamics of E-mini S&P 500 Futures (May 29, 2026). Available at SSRN: https://ssrn.com/abstract=6847024.
- Easley, D., López de Prado, M. M., & O'Hara, M. (2012). Flow Toxicity and Liquidity in a High-Frequency World. Review of Financial Studies, 25(5), 1457–1493.
- Kyle, A. S. (1985). Continuous Auctions and Insider Trading. Econometrica, 53(6), 1315–1335.
- Lee, C. M. C., & Ready, M. J. (1991). Inferring Trade Direction from Intraday Data. Journal of Finance, 46(2), 733–746.
Warning: All rights to these materials are reserved by MetaQuotes Ltd. Copying or reprinting of these materials in whole or in part is prohibited.
This article was written by a user of the site and reflects their personal views. MetaQuotes Ltd is not responsible for the accuracy of the information presented, nor for any consequences resulting from the use of the solutions, strategies or recommendations described.

 From Novice to Expert: Trading Multi-Symbol Basket
 Intrinsic Time: From the Directional-Change Scaling Laws to the Alpha Engine
 Building a Market Behavior Analyzer in MQL5
 Implementing and Comparing Five Historical Volatility Estimators in MQL5

- Free trading apps
- Over 8,000 signals for copying
- Economic news for exploring financial markets
You agree to website policy and terms of use