

How To Debug MQL5 Code in MetaEditor
 1 630
1 630
 2
2

Introduction
In the previous article I put a small indicator under the MetaEditor profiler and let two columns of numbers tell me where its time was going. The profiler answers one question well: where is this program slow? It has nothing to say about a different and often costlier question, the one where the program is fast enough but simply wrong. A line draws smoothly, the terminal reports no error, and yet the values it plots are quietly incorrect. For that class of problem MetaEditor ships a separate tool, the debugger, and this article is a practical walk-through of it, in the same spirit as the profiler piece: the focus is the tool, not the strategy.
To keep that focus, I use the same small example as before, a rolling z-score, but this time I write it with two deliberate bugs planted in it. I put them there on purpose, so that there is something concrete to find and so each bug exercises a different part of the debugger. The first is an off-by-one in a window loop, the kind of index mistake that reads one element past the edge of an array. The second is quieter and more instructive: a wrong denominator in the variance that never crashes anything, plots a perfectly plausible line, and is wrong on every bar by an amount too small to see on a chart. One bug you can trigger by accident; the other you can only find by reading the number itself.
The goal is not this indicator and it is not a tour of every menu item. It is the working method: how to set a breakpoint, how to step through code one line at a time, how to read variable values in the Watch window at the exact moment they go wrong, and how to follow the call stack back to the caller. Once you can drive the debugger, you can point it at your own indicators, libraries, and Expert Advisors and find out, instead of guessing, why they behave the way they do.
What the debugger does, and how you start it
A debugger runs your program under supervision. Instead of executing straight through, it pauses at points you choose, freezes the whole program in place, and lets you inspect the state of every variable that is alive at that instant. From a pause you can advance one line at a time and watch values change as each statement runs. That is the entire idea: pause execution, inspect the state, then advance one line at a time. Where the profiler samples a program that runs to completion, the debugger stops a program mid-execution so you can inspect it.
You launch it from the Debug menu, which offers two ways to start, exactly parallel to the profiler's two modes. The documentation names them:
- "Start on Real Data command in the Debug menu or F5" runs the program on a special chart in the trading platform with live server data.
- "Start on History Data command in the Debug menu or Ctrl+F5" executes in the Strategy Tester on historical data without waiting for market conditions.
For an indicator, Start on Real Data (F5) is the natural choice: the indicator loads onto a fresh chart, calculates across the history that is there, and then keeps recalculating as ticks arrive, which is exactly how it runs in normal use. Start on History Data (Ctrl+F5) comes into its own for Expert Advisors, where you want the Strategy Tester to feed the program historical ticks and let you pause on the bar that opens a trade. Either way, the terminal builds a special debug version of your program. It includes the symbol information the debugger needs to map machine state back to your variable names and source lines. That is why you should never judge speed from a debug run, and it is the build you want when the goal is to watch state rather than measure time.
There is one thing about the debugger worth stating plainly before I use it, because it shapes the whole method: the debugger gives you an inspectable pause only at points you mark in advance. It stops at a breakpoint you place on a line, or at a DebugBreak() call written into the code, and those are the places where you can look around and step. A critical runtime fault is not swallowed. If the program does something illegal (for example, reads past the end of an array), the terminal logs the line number and stops the program. But that report arrives after the fact, once execution has stopped, so it tells you the line where the program failed far more than how the state got there. In practice that makes it much less useful than a breakpoint set before the fault, where the program is still alive and you can watch the state go wrong.
That is what flips the workflow around. You do not run the program and wait for a fault to hand you the answer. You decide where the suspect code is, set a breakpoint before it, pause there while the state is still valid, and then step forward one line at a time, watching the variables, until you see the moment the state goes wrong. The debugger does not find the bug for you; it gives you a controlled way to observe the fault as it occurs. That distinction is the core of the method, and both bugs below are found exactly that way.
The example: a rolling z-score with two planted bugs
The indicator is the same rolling z-score from the profiler article, reduced to its simplest, most literal form. For each bar it takes the closing price, subtracts the mean of the last N closes, and divides by their standard deviation; the result says how many standard deviations the current close sits from its recent average, and two flat lines mark a threshold. Written as a formula, the value on bar t is:
z_t = (close_t - mean_t) / stddev_t
Where the mean and standard deviation are taken over the window of period closes ending at bar t. I split the work into two small helpers, one for the mean and one for the variance, for the same reason the profiler article did: that is how the definition reads, and separate functions give the debugger's call stack something to show. A single monolithic OnCalculate would still hold both bugs, but its call stack would be one frame deep and teach nothing; splitting the arithmetic into named helpers is what lets the debugger show you OnCalculate called WindowMean called the faulty line, which is the shape of a real codebase.
Three assumptions matter before the code. Each one, if silently violated, turns a correct-looking indicator into a wrong one. First, and to avoid any ambiguity about bar order, price[] is the close series copied into a local array whose direction I set myself: ArraySetAsSeries(price, false) puts the oldest bar at index 0, so price[pos - k] steps k bars back into history. I set that order rather than relying on any assumed default, because a flipped series order is one of the most common reasons an MQL5 indicator compiles cleanly and still draws the wrong thing. Second, InpPeriod is validated in OnInit (it must be at least 2), so the window arithmetic is never handed a degenerate period. Third, the handler recomputes the whole history on every call and rebuilds each window's mean and variance from scratch, which is O(N * period) work and deliberately the simplest thing that can be stepped through, not how a production indicator should be written.
The three versions of the indicator are attached below in full; the listings in the article show only the parts that matter for each bug.
Here is the mean helper, and it contains the first planted bug. Read the loop bound carefully.
//+------------------------------------------------------------------+
//| Compute the mean of a window ending at bar `pos`                 |
//+------------------------------------------------------------------+
double WindowMean(const double &price[], const int pos, const int period)
  {
   double sum = 0.0;
//--- BUG 1: the loop runs k from 0 to period INCLUSIVE (k <= period),
//--- so the last iteration reads price[pos - period], one element
//--- before the window's first bar. On the first computed bar
//--- (pos == period - 1) that index is -1.
   for(int k = 0; k <= period; k++)
      sum += price[pos - k];
   return(sum / period);
  }
Listing 1. WindowMean, with the off-by-one loop bound
The window is meant to be period bars wide, indices pos down to pos - (period - 1). Written correctly the loop runs k from 0 up to but not including period. Here it runs k <= period, one iteration too many, so on the last pass it reads price[pos - period], one slot before the window even begins. On the very first bar the indicator computes, pos equals period - 1, and that final read asks for index -1. This bug goes unnoticed almost all of the time. On every interior bar the loop simply sums one value too many and returns a slightly wrong mean, which is bad but invisible. Only on the very first computed bar does the index actually fall off the front of the array. It is subtle precisely because <= looks so innocent next to <.
The second helper computes the variance, and it contains the second planted bug, which does not crash anything.
//+------------------------------------------------------------------+
//| Compute the variance of a window ending at bar `pos`             |
//+------------------------------------------------------------------+
double WindowVariance(const double &price[], const int pos, const int period, const double mean)
  {
   double sumSq = 0.0;
   for(int k = 0; k < period; k++)
     {
      double diff = price[pos - k] - mean;
      sumSq += diff * diff;
     }
//--- BUG 2: dividing by (period + 1) instead of period. No crash,
//--- but every variance (and therefore every z-score) is biased low.
   return(sumSq / (period + 1));
  }
Listing 2. WindowVariance, dividing by the wrong denominator
The variance is the mean of the squared deviations, so the sum of squares should be divided by period. This version divides by period + 1. There is no crash and no error; the sum is real, the division is valid, the result is just slightly too small on every bar. A denominator of 101 instead of 100 makes the variance about one percent low, the standard deviation about half a percent low, and the z-score about half a percent high. On a scale running from about -2.5 to +2.5, a half-percent error moves the line by roughly 0.01, far below anything the eye can resolve. This is the essence of a silent bug: nothing is wrong except the answer. A denominator of period - 1 would at least be the defensible sample-variance choice; period + 1 is not any recognized estimator, it is simply a mistake, and it is exactly the kind of thing that survives every clean compile.
The handler ties them together in the plainest possible way, copying the closes into a local buffer and computing every bar from the definition.
//--- Copy the closes into a local working buffer, oldest bar at index 0.
//--- ArraySetAsSeries(price, false) sets non-series (chronological) order,
//--- so price[pos - k] steps k bars back into history.
   double price[];
   ArrayResize(price, rates_total);
   ArraySetAsSeries(price, false);
   for(int i = 0; i < rates_total; i++)
      price[i] = close[i];

//--- Recompute every bar on every call.
   for(int i = 0; i < rates_total; i++)
     {
      if(i < InpPeriod - 1)
        {
         ZScoreBuffer[i] = EMPTY_VALUE;
         UpperBuffer[i]  = EMPTY_VALUE;
         LowerBuffer[i]  = EMPTY_VALUE;
         continue;
        }

      double mean     = WindowMean(price, i, InpPeriod);
      double variance = WindowVariance(price, i, InpPeriod, mean);
      double stddev   = MathSqrt(variance);

      double z = 0.0;
      if(stddev > 1e-12)
         z = (price[i] - mean) / stddev;

      ZScoreBuffer[i] = z;
      UpperBuffer[i]  = InpThreshold;
      LowerBuffer[i]  = -InpThreshold;
     }
Listing 3. The handler: copy the closes, then compute every bar
The warm-up region below the first full window is filled with EMPTY_VALUE, so the plot leaves a genuine gap there instead of drawing a flat line at zero, and from the first computable bar onward each bar calls the two helpers and writes the three buffers. The final guard is written stddev > 1e-12 rather than stddev > 0.0: on flat or synthetic data the standard deviation can collapse to essentially zero, and dividing by a tiny nonzero denominator would blow the z-score up into numerical nonsense, so below that threshold the code leaves z at 0. The guard i < InpPeriod - 1 is what places the first computed bar at i == InpPeriod - 1, which is pos == period - 1, the exact bar where Bug 1's index reaches -1. It compiles cleanly, with no warnings, and nothing about it looks dangerous. That is the point of the exercise: a clean compile tells you the code is well-formed, not that it is right. Everything from here is about the debugger telling you what the compiler cannot.
Production note: recomputing the whole history on every tick is fine for a debugging demonstration but wrong as a habit. A real indicator uses prev_calculated to recompute only the bars that changed, starting from an index like int start = (prev_calculated > 0 ? prev_calculated - 1 : InpPeriod - 1) and looping from start to rates_total. The full recompute here keeps the demonstration simple and keeps a breakpoint inside OnCalculate easy to reason about; treat it as a teaching scaffold, not a template to copy into production.
Finding the off-by-one: a breakpoint, then stepping
Because the debugger pauses only where I tell it to, I have to stop it just before the code I suspect. The suspect is the array read inside WindowMean, so that is where I place a breakpoint. In MetaEditor you set one by clicking the gray margin to the left of a line, by putting the cursor on the line and pressing F9, or by right-clicking the line and choosing Toggle Breakpoint from the context menu; a breakpoint dot appears in the margin. The documentation describes the mechanism: "a breakpoint is a command triggered when a program execution reaches a specified string," set by "double-click on the gray field to the left of the code line" or with "Toggle Breakpoint in the Debug menu or F9."
I put the breakpoint on the sum += price[pos - k] line, the exact statement that does the array read.
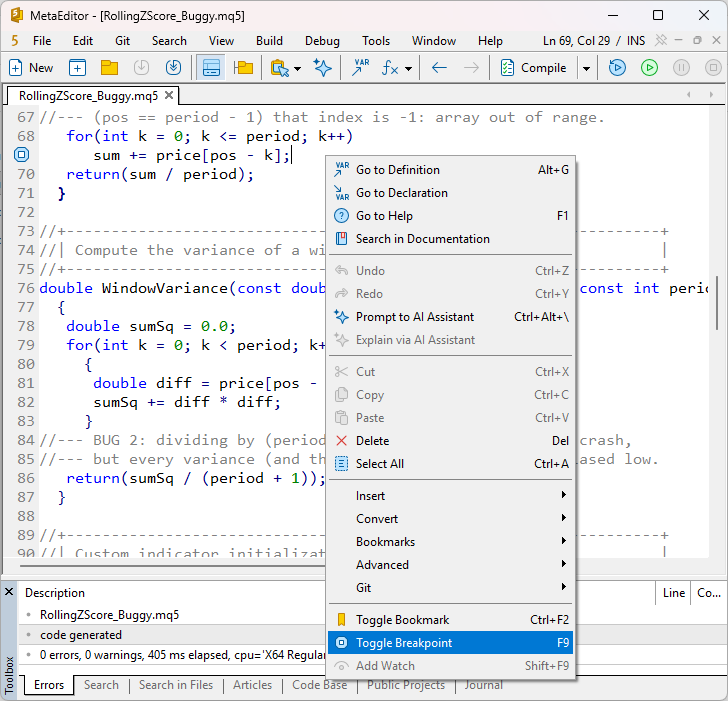
Fig. 1. Setting the breakpoint on the sum += price[pos - k] line from the context menu
With the breakpoint in place I pressed F5 to start on real data. The indicator loaded, and the moment execution reached that line the debugger froze the program and highlighted it with a yellow arrow in the margin. The title bar now reads MetaEditor (Debugging), the confirmation that the debug build is running and the program is paused and open to inspection. The Debug tab appears at the bottom of the Toolbox, split into two halves that are the heart of the tool.
The left half is the call stack: the chain of function calls that led to this exact point. The documentation describes it as showing "the entire sequence of an event occurrence up to calling a specific function," with filename, function name, and line number for each frame. Here it showed two entries, WindowMean on top with OnCalculate beneath it, which reads bottom to top as a sentence: OnCalculate called WindowMean, and execution is now inside WindowMean. The call stack answers "how did I get here," and on a real bug where a helper is called from twenty places, it is often the fastest way to see which caller is responsible. Double-clicking a frame jumps the editor to that line and re-scopes the Watch window to that frame's variables, which is how you walk back up a deep call chain one level at a time.
The right half is the Watch window, where you inspect values. You add an expression by right-clicking a variable and choosing Add Watch, or by typing it into the expression field.
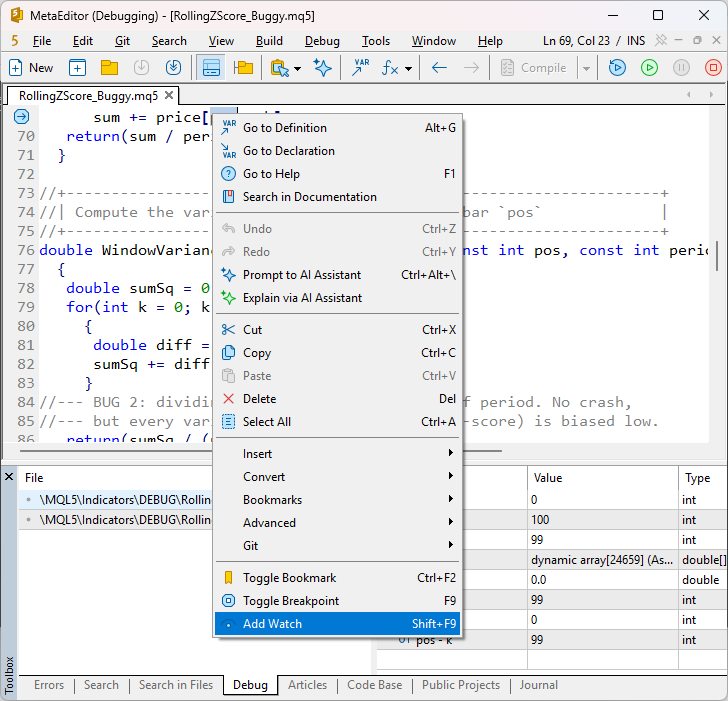
Fig. 2. Adding a watch expression from the context menu
The crucial rule, and the one that trips people at first, is about scope: an expression only evaluates when the program is paused inside the function where those variables are alive. Paused inside WindowMean, I can watch its parameters and locals; the same names asked for while paused in OnCalculate come back as "unknown identifier," because there they do not exist. So, stopped inside WindowMean, I added the expressions that matter for this bug: k, pos, period, and, because the Watch window can evaluate simple arithmetic, the index itself, pos - k.
On this first pause the numbers were exactly what a healthy first bar should show: pos was 99, which is period - 1 for the default window of 100, and k was 0, so pos - k was 99, a valid index. The running sum was still 0.0 because the line had not yet executed once. Nothing wrong yet.
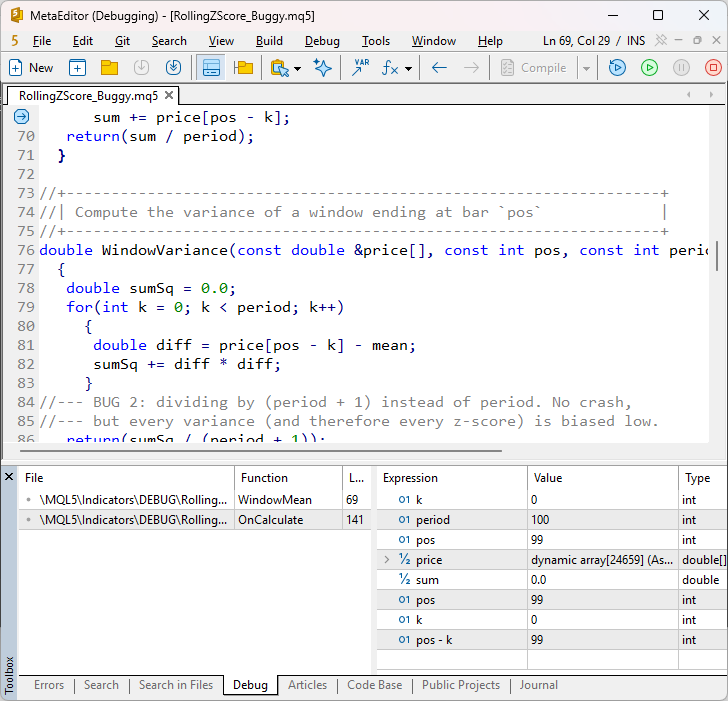
Fig. 3. The healthy first pause: k is 0, pos is 99, and pos - k is a valid 99
The bug is not in any single iteration; it is in the last one, so I let the loop run and watched the index descend. Pressing F10, Step Over, advances execution one line without diving into any function that line calls. Each F10 ran one more pass of the loop, and with each pass k climbed by one and pos - k fell by one: 99, 98, 97, and on down, moving toward the edge of the array.
The moment arrived when k reached 100, equal to period. The loop condition k <= period was still true, so the body ran one more time, and now pos - k read -1 in the Watch window while sum had already accumulated to about 182988 from the hundred valid reads before it. The Watch window showed it directly: the next thing this line would do is read price[-1], with the exact values that caused the fault on screen before any bad read happened. The window is 100 wide, the loop takes 101 steps, and on the last step the index falls off the front of the array. That is not harmless in MQL5: indexing outside an array's bounds is a runtime error, not a quiet read of whatever memory sits next to the array, so if I let this line execute with pos - k at -1 the terminal aborts the calculation with an array-out-of-range fault. Evaluating pos - k in the Watch window is safe because that only does arithmetic; the whole reason to stop here is to catch the index before the line that dereferences it ever runs.

Fig. 4. The off-by-one caught in the act: k is 100 and the index pos - k is -1
This is the method the earlier caveat pointed at. I did not run the program and wait for something to break; I reasoned about where the fault probably was, stopped the program short of it, and stepped forward watching the one value that mattered until it turned negative. Stepping through the loop one pass at a time is what makes an off-by-one, normally hard to catch by reading, easy to see.
The fix is a single character. The loop must run k < period, not k <= period, so it takes exactly period steps and never reaches the slot before the window.
double WindowMean(const double &price[], const int pos, const int period)
  {
   double sum = 0.0;
//--- FIX 1: strictly less than period, so the window stays in bounds.
   for(int k = 0; k < period; k++)
      sum += price[pos - k];
   return(sum / period);
  }
Listing 4. WindowMean after Fix 1 (excerpt from RollingZScore_Fix1.mq5)
With the array read back in bounds, the indicator runs to completion across its history and draws its line. If the story were only about index bugs, it would end here. But a program that runs is not the same as a program that is correct, and the second bug is still present, producing a wrong value on every bar while the plot looks normal.
Finding the silent bug: when the chart looks fine but the number is wrong
This is the harder and more valuable case, because there is nothing to break and nothing on the chart to raise suspicion. The z-score line looks exactly like a correct z-score line. Plot the buggy-variance version and a correct version in the same subwindow, on the same symbol and timeframe, and at any normal chart scale the two curves lie on top of each other, indistinguishable. The difference is not literally zero, but it is small enough that the line cannot show it and, at the indicator's two-digit Data Window setting, the two values usually round to the same number there too. That is not a failure of the test; it is the whole point. A half-percent error in the z-score is far below what any eye can resolve on a chart, so no amount of staring at the plot will ever reveal it.
The chart cannot resolve a difference this small; the debugger can, because it reads the computed value directly, at full precision, at the moment it is produced.
The strategy for a silent numerical bug is different from the index bug. I am not waiting for something to go out of bounds; I am checking a value against what it should be. So I worked on the index-fixed file, RollingZScore_Fix1.mq5, which still carries Bug 2, set a breakpoint on the return line of WindowVariance, the line that produces the number I suspect, and pressed F5. The program paused there with the full window already summed, and I added the expressions that would let me judge the result. The Watch window's ability to evaluate simple arithmetic is what makes this decisive: alongside the raw sumSq and period, I can type the two candidate answers side by side and let the debugger compute both.
I watched four things: sumSq, period, the value the correct code should return, sumSq / period, and the value this code actually returns, sumSq / (period + 1). On the bar where it paused, sumSq was about 19701.92 and period was 100. The correct expression, sumSq / period, evaluated to about 197.0193. The expression the code actually uses, sumSq / (period + 1), evaluated to about 195.0685. Two numbers, computed from the same live state, differing in a way no chart would ever show.
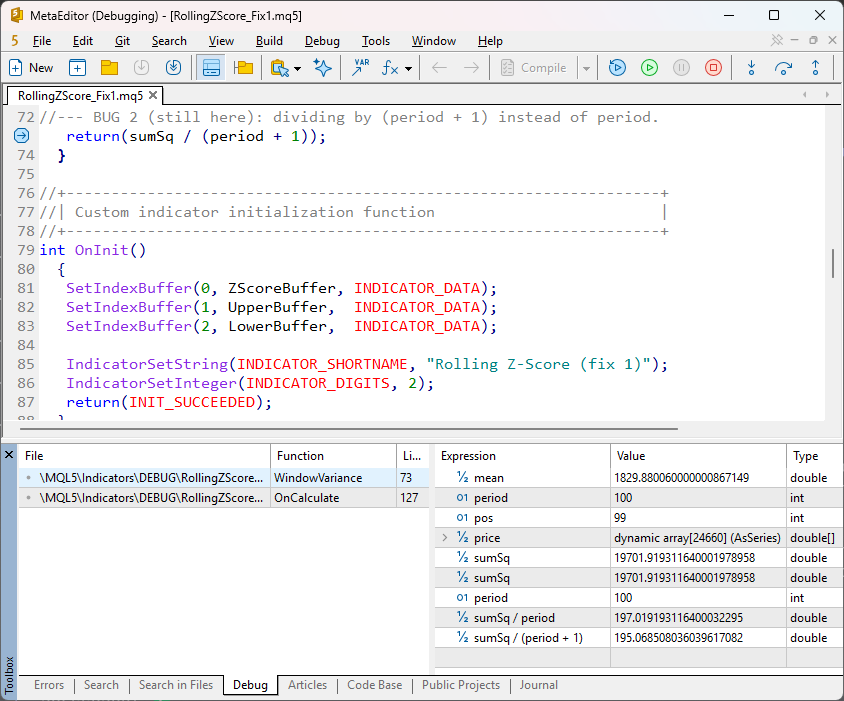
Fig. 5. The silent bug, made visible: 197.0193 (correct) against 195.0685 (what the code returns)
That gap, 197.0193 against 195.0685, is the bug measured directly. It is the difference between dividing by 100 and dividing by 101, and it confirms that the denominator is wrong. There was no fault to lead me here and no visual clue on the chart; the only way to see it was to stop on the line and have the debugger show both the value the code produced and the value it should have produced, together. Both watched expressions read sumSq, a live local, and combine it with a literal, and the debugger evaluates each on demand from the frozen state. You are not limited to the variables the code happens to store; you can evaluate new expressions against the same paused state, which turns an invisible bias into two numbers you can compare.
The debugger is not the only way to expose a silent numerical bug, and the strongest check pairs it with an outside reference: work one bar out independently, by hand or in Excel or Python, and compare that value against what the indicator actually computed. A single correct reference for a single bar is usually enough to settle whether the math is right, and the debugger is how you read the indicator's own number at full precision so the comparison is exact rather than eyeballed off a chart. Validating the formula against something external, not just watching the code run, is what separates "the number looks reasonable" from "the number is right."
The fix follows directly. The denominator must be period.
double WindowVariance(const double &price[], const int pos, const int period, const double mean)
  {
   double sumSq = 0.0;
   for(int k = 0; k < period; k++)
     {
      double diff = price[pos - k] - mean;
      sumSq += diff * diff;
     }
   return(sumSq / period);   // FIX 2: divide by period, not period + 1
  }
Listing 5. WindowVariance after Fix 2 (excerpt from RollingZScore_Fixed.mq5)
With both fixes in place the indicator computes the value it always claimed to. At chart scale the line looks the same as the buggy one did, which is the unsettling part: the only proof that it is now correct is the same debugger check, run again, this time showing the returned value equal to sumSq / period. That is the discipline a silent bug forces on you. An index fault announces itself and you cannot ship past it; a wrong number ships without complaint, so the only defense is to verify the value directly, at the source, rather than trusting a chart that cannot show the difference.
Landing on the exact iteration with DebugBreak()
Stepping the loop by hand with F10 worked because the bad iteration was only a hundred passes in and I knew roughly where to look. On a longer loop, or a bug that only appears on the ten-thousandth bar, tapping F10 ten thousand times is not a plan. Some debuggers solve this with conditional breakpoints, which pause only when a condition you specify is true, so you could say "stop here only when pos - k < 0" and skip straight to the bad iteration. MetaEditor does not support that; its breakpoints are unconditional and pause on every pass.
What MetaEditor gives you instead is DebugBreak(), a function that acts as a breakpoint from inside the code. You write it into the source, guarded by whatever condition you like, and it pauses the program the moment that condition holds. The documentation is explicit that it is inert outside a debug session: "it is a program breakpoint in debugging. Execution of an MQL5 program is interrupted only if a program is started in a debugging mode."
Because it does nothing in a normal run, a guarded DebugBreak() is the closest thing MetaEditor offers to a conditional breakpoint. For the off-by-one, I would guard it on the index going negative, so the program runs full speed through every healthy iteration and freezes on the precise pass where the read is about to go out of bounds:
double WindowMean(const double &price[], const int pos, const int period)
  {
   double sum = 0.0;
   for(int k = 0; k <= period; k++)
     {
//--- Freeze the instant the index would go negative, and only then.
      if(pos - k < 0)
         DebugBreak();
      sum += price[pos - k];
     }
   return(sum / period);
  }
Listing 6. A guarded DebugBreak() that stops only on the faulty iteration
Run this under the debugger and it runs through the first hundred passes without stopping, then pauses with the yellow arrow on the DebugBreak() line at the exact moment pos - k is -1, with k, pos, and the whole frame already laid out for inspection, no hundred taps of F10 required. Run the same file normally, outside a debug session, and the DebugBreak() does nothing at all, so you can leave such a guard in place during development without disturbing ordinary use. The one discipline it demands is that you remember to remove or disable these guards before you ship, the same way you would strip temporary Print() calls, because a stray DebugBreak() that some future condition trips is a surprise you do not want in production.
The step commands, and reading the Watch window well
Two bugs, two techniques, and between them they use the whole core of the debugger. It is worth pinning down the pieces so you can apply them deliberately rather than by trial and error.
The three step commands differ only in how they treat a function call on the current line, and choosing the right one is most of what makes stepping efficient. The documentation defines them:
- "Step Into" moves "one step of program execution accessing the called functions." (F11)
- "Step Over" moves "one step of program execution without accessing the called functions." (F10)
- "Step Out" executes "a single step of a program one level higher." (Shift+F11)
In practice the choice is simple. Use Step Over (F10) to advance through the current function without descending into every helper it calls, which is what I did to run the loop inside WindowMean pass by pass. Use Step Into (F11) when the current line calls a function you suspect and want to enter, which is how you would move from the WindowMean call in the handler down into the helper itself. Use Step Out (Shift+F11) when you have seen enough inside a function and want to return to its caller in one move rather than stepping through the rest of it, which is invaluable when F11 has dropped you into a long library function you did not mean to enter. And F5, which starts debugging, also means continue: from a pause it runs until the next breakpoint, or to the end. The everyday rhythm is simple: F11 to enter a function, F10 to step through it, Shift+F11 to return to the caller, and F5 to continue to the next breakpoint.
The Watch window rewards a little discipline. Three habits made it far more useful:
- Watch the derived quantity, not just the raw ones. The bug in WindowMean was in pos - k, not in pos or k alone, so watching the expression pos - k put the answer directly in front of me instead of making me subtract in my head on every step.
- Put the expected value next to the actual value. For the variance I watched both sumSq / period and sumSq / (period + 1), so the correct answer and the wrong answer sat side by side and the bug was the gap between them. Comparing against what should be there is often faster than reasoning about what is.
- Mind the scope. An expression evaluates only while the program is paused inside the function where its variables live. "Unknown identifier" or "cannot be evaluated" almost always means you are paused somewhere those names do not exist, not that anything is broken. Step into the right function, or double-click the right call-stack frame, and the same expression comes alive.
One last practical caveat about debugging indicators specifically. An indicator recalculates on every incoming tick, so a breakpoint on a per-bar line will pause again on the next tick, and the next, which can feel like the debugger is stuck. It is not; it is doing exactly what you asked, stopping every time execution reaches the line. When you have seen what you need for one bar, F5 continues to the next hit, and if you are done, remove the breakpoint before continuing so the program runs free. This is a place where a guarded DebugBreak(), tied to the specific bar or condition you care about, saves a great deal of pressing F5. It also helps to shrink the case before you start: debugging on a short history, or on a single symbol and timeframe where the bug reliably shows, means far fewer bars to step through and far fewer pauses to clear.
Those techniques cover the mechanics. The last thing worth having is a short field guide to the symptoms that waste the most time, because in MetaEditor a handful of them recur with the same handful of causes:
- A breakpoint that never pauses. Usually the running program is not the file you are editing: a stale compile, or the chart is holding an older build. Recompile and reattach before suspecting the breakpoint itself.
- A Watch that reads "unknown identifier". Almost always scope, not a broken expression: you are paused where those names do not live. Double-click the right call-stack frame, or step into the function that owns them.
- An indicator that seems to stop every second. A breakpoint sitting inside the per-tick recalculation, firing on every incoming tick. Guard it with a condition, or remove it once you have seen the bar you wanted.
- A chart that draws nothing after a change. Usually a buffer problem, not the debugger: an unset SetIndexBuffer, values left at EMPTY_VALUE where you meant to write a number, or an indexing or OnInit mistake.
When to reach for the debugger, and when a Print() will do
Every developer reaches for Print() first, and a good deal of the time that is the right call. Dropping a line into the code to log a value is instant, it needs no debug session, and the output survives in the Experts log where you can scroll back through it later. If I want to confirm that a branch ran, or check a single value at a single point, or capture the whole trace of a short loop and read it afterward, a Print() is faster than setting up a breakpoint and stepping. It also reaches places the interactive debugger struggles with: a fault that only appears after hours of live ticks is far easier to catch by sprinkling a few logs and reading them the next morning than by sitting on a paused program waiting for the condition to occur.
So the debugger is not a replacement for Print(); it earns its place where logging starts to fight you. The first case is when you do not know which iteration matters. Printing inside a loop over thousands of bars floods the log, and then you are searching the output for the one line that counts, when a guarded DebugBreak() or a single watched expression would have landed you on exactly that iteration. PrintFormat() helps here, when you want the values aligned in fixed columns so a drift between bars jumps out, but it does not solve the volume problem. The second case is the one the variance bug showed. With Print() you only ever see what you decided to log before the run; if the value you need was not one you printed, you edit the code, recompile, and run again. Paused in the debugger, I typed sumSq / period and sumSq / (period + 1) as fresh expressions against the frozen state and read the gap between them without touching the source at all. Asking a new question of the same instant, rather than re-instrumenting and re-running, is the thing the debugger does that logging cannot.
There is a quieter reason too. A Print() changes the program you are debugging: you recompile a slightly different binary, and in a tight loop the logging itself can shift timing and behavior enough to matter. The debugger reads the state without editing the source, so what you inspect is the program you actually ship. The honest split is that the two tools are complementary. Reach for Print() when you know exactly what to inspect and where, or when the bug will not sit still long enough to catch under a debug session. Reach for the debugger when you need to explore: when the question is not "what is this value" but "which of these bars, and what else was true when it happened."
What the debugger will not tell you
Everything above is the debugger at its best, so it is worth being equally clear about where it stops and your own judgment has to take over. The debugger shows you what the code does; it has nothing to say about what the code should do. It will happily show you that the variance divides by period + 1, but it will never tell you that period was the denominator you meant. That decision is mathematics, not machinery.
The variance bug points at a subtler version of the same limit. Before you can call a numerical result wrong, you have to fix the convention it is measured against. A window variance divided by N is the population variance; divided by N - 1 it is the unbiased sample estimate. Both are legitimate depending on what you are computing, and the debugger will not choose between them for you; it only shows what the code did once you have decided what you intended. The period + 1 here is wrong under either convention, which is what makes it a clean teaching case, but the general lesson holds: a bug can live in an ambiguous specification as readily as in a line of code, and no amount of stepping will resolve a specification you never pinned down.
Two further limits are worth naming. The debugger will not save you from an index-order mistake: if you assume an array runs oldest to newest and it actually runs newest to oldest, every value you watch will look plausible and every one will be wrong, which is exactly why the array order in this example is stated outright rather than left to assumption. And it is an awkward tool for a bug that only surfaces after hours of live ticks or thousands of bars into history; sitting on a paused program waiting for a rare condition is a poor use of an afternoon, which is where a guarded DebugBreak() or a few well-placed logs do the job the interactive debugger cannot.
The workflow in five steps
Stripped to its essentials, everything above is the same short loop, worth keeping in one place to reach for on the next bug:
- Identify the suspicious line, the one you think produces the wrong value or the illegal access.
- Set a breakpoint on it, or just before it, while the state is still healthy.
- Start debugging: F5 on real data for an indicator, Ctrl+F5 in the tester for an EA.
- Add watches for the variables that matter, and for the derived expressions and expected values you want to compare against.
- Step with F10 and F11, reading the watches, until the state first turns wrong. That step is the bug.
Final Thoughts
The rolling z-score made a good example for the same reason it did under the profiler: it is small enough to read at a glance, which is exactly why the bugs hid so well. An off-by-one in a loop bound and a plus-one in a denominator are the kind of mistakes that pass every casual reading and every clean compile, and one of them does not even disturb the picture on the chart. The debugger found both, not by detecting the faults automatically, but because it let me stop the program at a chosen point, read the exact values live there, and step forward one line at a time until each fault appeared in the values.
The single most important idea to carry away is the one stated at the start: the debugger gives you an inspectable pause where you tell it to, at a breakpoint or a DebugBreak(). A crash may point you at the line it died on, but only a breakpoint set before the fault lets you watch the state turn wrong. So the method is always to reason about where the suspect code is, stop before it, and step into the failure yourself. Once that clicks, the rest is mechanical: the call stack tells you how you arrived, the Watch window tells you the state you are in, and F10 and F11 move you through the code at whatever grain you need.
The same method scales straight up to Expert Advisors, where it matters more because the bugs are more expensive. An EA that opens a position of the wrong size, or reads a stale indicator value, or miscounts its own orders, rarely announces the mistake; it just loses money quietly, exactly like a silent z-score plotting the wrong number.
You debug it the same way: Start on History Data (Ctrl+F5) to run it in the tester without waiting on the market, a breakpoint on the line that decides the trade, and a Watch on the values that feed the decision, checked against what they ought to be. One caveat is specific to Expert Advisors: the Strategy Tester is a model of the market, not the market itself, so tick timing, order responses, requotes, and data synchronization do not always reproduce a live problem exactly, and when a trade bug refuses to show itself in the tester, the order and deal history in the journal is the other record worth reading alongside the debugger. The tool does not change with the size of the program. I attached the buggy indicator, the index-fixed version, and the fully corrected version so you can set the same breakpoints and watch the same numbers turn wrong and then right, and I would encourage you to point the debugger at a program of your own next, especially one that runs without error but that you have never stepped through.
| # | File | Description |
|---|---|---|
| 1 | RollingZScore_Buggy.mq5 | The starting point: the off-by-one in WindowMean and the wrong variance denominator, both present. |
| 2 | RollingZScore_Fix1.mq5 | Fix 1: the window bound is corrected (k < period); the silent variance bug is still present so it can be found next. |
| 3 | RollingZScore_Fixed.mq5 | Both bugs fixed: correct window bound and correct variance denominator. |
| 4 | MQL5.zip | Archive containing all three indicators above. |
Warning: All rights to these materials are reserved by MetaQuotes Ltd. Copying or reprinting of these materials in whole or in part is prohibited.
This article was written by a user of the site and reflects their personal views. MetaQuotes Ltd is not responsible for the accuracy of the information presented, nor for any consequences resulting from the use of the solutions, strategies or recommendations described.

 Designing a Partial Close Engine in MQL5 with Configurable Profit Ladders
 Developing Smart Chart Objects in MQL5 (Part 1): Building a Stateful Trendline Management Framework
 Online Machine Learning for Trade Signal Filtering in MQL5 (Part 1)
 Building a Hidden Risk of Ruin Auditor in MQL5

- Free trading apps
- Over 8,000 signals for copying
- Economic news for exploring financial markets
You agree to website policy and terms of use
Good Write up !