

Feature Engineering for ML (Part 12): Fractal Features in MQL5
 2 333
2 333
 2
2

Table of Contents
- Introduction
- What the Confirmation Lag Means Inside OnCalculate
- Class Architecture and the iCustom Contract
- The Detection Window and Strength Measurement
- Support and Resistance: A Ring of Events, Not Bars
- Breakouts, the Trend Block, and Signals
- The Indicator: Two Buffer Classes With Different Rules
- Three Defects Found During the Port
- Results: Feature Output and Python Parity
- Reading the Features From an EA
- Conclusion
- References
- Attached Files
Introduction
Part 11 audited the Python fractal module and found a look-ahead leak: the detector used rolling(2n+1, center=True), so the fractal, strength, validity, and level columns at bar c could not be computed until bar c+n had closed. The correction was a single leak_safe flag at the get_fractal_features() boundary, which shifts every centered column forward by n and leaves the unshifted columns reachable for the one context where hindsight is legitimate: label construction.
In Python that fix is one call to Series.shift. In MQL5 there is no shift operation, because indicators write to per-bar buffers rather than columns. The key questions are (1) which bar receives the detection and (2) when writing is allowed. The two are not the same question, and answering only the first is what reintroduces the leak in a port that otherwise reproduces the Python numbers exactly.
This article implements the corrected feature set as CFractalFeatures.mqh, an event-driven engine that consumes one bar at a time and publishes eighteen features, all causal at the bar that carries them. It also delivers FractalViewer.mq5, which separates display markers from feature buffers because the two obey different timing rules, and FractalValidation.mq5, which exports the engine output for numerical comparison against the Python reference. Three defects surfaced during the port; each is documented with the measurement that exposed it.
What the Confirmation Lag Means Inside OnCalculate
A Williams fractal is a local extremum of a window of 2n+1 bars, with the candidate at the center (Williams, 1998). The pattern is symmetric: it needs n bars before the candidate and n bars after it. The bars after the candidate are the problem. At the moment bar c closes, the window [c-n, c+n] is still open, and the earliest moment the pattern can be evaluated is the close of bar c+n.
This produces two defensible conventions and one indefensible one. A chart annotation may be drawn on bar c, because a marker is a statement about where the extremum occurred, and every trader reading the chart in real time knows the marker appeared n bars later. A feature buffer may not be written at bar c, because a consumer that reads buffer[c] has no way to know that the value arrived late. The indefensible convention is the one that makes both writes to the same buffer.
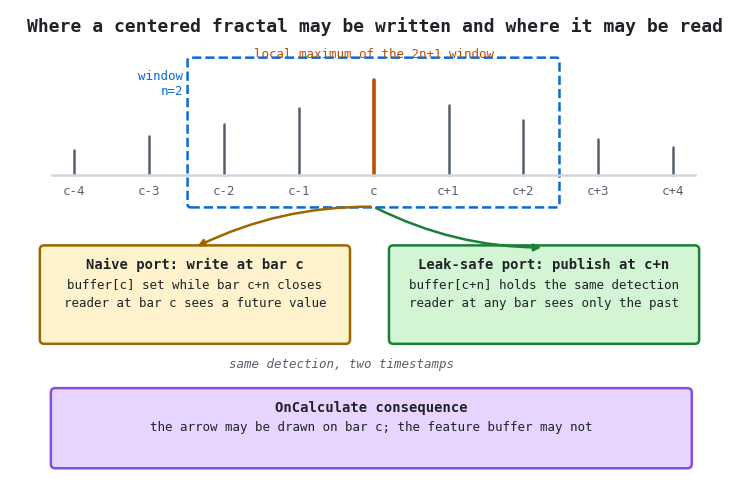
Figure 1. Single-panel illustration of the two publication conventions for a centered fractal
- Top: the five-bar window at n=2, with the center bar carrying the local maximum.
- Left: the naive port writes the detection at bar c, so a reader at bar c sees a value that did not exist yet.
- Right: the leak-safe port publishes the same detection at bar c+n, where every input to it has closed.
The engine adopts the right-hand convention throughout. Every value it returns for bar t refers to the fractal centered at t-n, which makes the Python contract explicit rather than implicit:
fractal_high[t]  = 1 if high[t-n] == max(high[t-2n : t+1])
high_strength[t] = high[t-n] / mean(high[t-2n : t+1]) - 1
breakout_up[t]   = close[t] > high[t-n] and fractal_low[t] == 1
The slice bound follows Python convention, so t+1 as the upper bound means the window includes bar t. Written this way, the window closes at t and never extends past it. The same three lines in the Python module are a centered rolling call followed by a shift, which is equivalent but hides the lag inside a pandas argument.
Class Architecture and the iCustom Contract
The engine is stateful by necessity. Two of the feature families depend on history that cannot be recovered from the current window: the support and resistance levels depend on the last lookback_period confirmed fractals, which may lie hundreds of bars back, and the trend block depends on the last ma_period breakout flags. Both are held as internal rings, which is what makes a per-bar ProcessBar call possible without rescanning history on every tick.
class CFractalFeatures
{
private:
   int               m_n;                 // half-window; pattern length is 2n+1
   int               m_lookback;          // confirmed fractal events kept per side
   int               m_ma_period;         // trend average and breakout density
   double            m_threshold;         // strength floor, or volatility multiplier
   bool              m_dynamic;           // scale the floor by center-bar volatility

   //--- level state: the last m_lookback confirmed extremes per side
   double            m_res_events[];
   double            m_sup_events[];
   double            m_resistance;
   double            m_support;

   //--- breakout history ring, length m_ma_period
   double            m_bo_up[];
   double            m_bo_down[];
   int               m_bo_cursor;
   int               m_bo_filled;

   int               m_last_bar;          // last index passed to ProcessBar

public:
   bool              Init(const int n = 2,
                          const int lookback_period = 20,
                          const int ma_period = 20,
                          const double threshold = 0.001,
                          const bool dynamic_threshold = false);
   void              Reset(void);
   bool              ProcessBar(const double &high[], const double &low[],
                                const double &close[], const double &volatility[],
                                const int t, FractalRow &row);
   bool              Compute(const double &high[], const double &low[],
                             const double &close[], const double &volatility[],
                             const int total, FractalBuffers &out);
ProcessBar is the primitive; Compute is a loop over it that resets the state first. Both paths produce identical numbers by construction. This prevents the common failure mode where incremental updates drift from full recalculation after a history resync.
The sentinel convention follows Part 8: an unavailable value is written as FRAC_EMPTY, defined as -1e38, and validity is tested with FRAC_IS_VALID rather than by equality, so accumulated floating-point error in a copied buffer cannot make a sentinel read as data.
Eighteen features are published, all addressable through iCustom. Two of them, resistance and support, are also drawn as lines; together with the two arrow markers, which are display-only and not among the eighteen, that puts four buffers on the chart and leaves sixteen as calculation-only:
Buffer | Name | Meaning at bar t |
|---|---|---|
| 0, 1 | Fractal high/low arrow | Display only, written at bar t-n |
| 2, 3 | Resistance, Support | Level from the last confirmed fractals |
| 4, 5 | Fractal high/low | Detection flag for the fractal at t-n |
| 6, 7 | High/low strength | Excursion of the extremum above the window mean |
| 8, 9 | Valid high/low | Detection surviving the strength floor |
| 10, 11 | Breakout up/down | Close beyond the confirmed extremum |
| 12, 13 | Distance to resistance/support | Level relative to the bar midpoint |
| 14, 15 | Trend strength, direction | Breakout density and its signed balance |
| 16 | MA ratio | Close relative to the trend average |
| 17, 18, 19 | Buy, sell, signal strength | Trend-filtered breakout entries and their size |
The Detection Window and Strength Measurement
One pass over the closed window produces the four quantities the rest of the bar depends on: the window maximum, the window minimum, and the two sums that give the window means. Computing them together keeps the per-bar cost at 2n+1 comparisons regardless of how many features are requested.
   //--- window [t-2n, t] is closed; its center is the candidate fractal
   const int start  = t - 2 * m_n;
   const int center = t - m_n;
   const int width  = 2 * m_n + 1;

   double win_high_max = high[start];
   double win_low_min  = low[start];
   double sum_high     = high[start];
   double sum_low      = low[start];

   for(int i = start + 1; i <= t; i++)
     {
      if(high[i] > win_high_max)
         win_high_max = high[i];
      if(low[i] < win_low_min)
         win_low_min = low[i];
      sum_high += high[i];
      sum_low  += low[i];
     }

   const double is_fractal_high = (high[center] == win_high_max) ? 1.0 : 0.0;
   const double is_fractal_low  = (low[center] == win_low_min) ? 1.0 : 0.0;
The equality test reproduces the Python detector exactly, including its behavior on plateaus: when several bars in the window share the extreme value, each of them registers as a fractal when it becomes the center. This matters more on a broker feed than in a simulation, because quoted prices are discrete and repeated highs are common on quiet instruments.
Strength measures how far the extremum sits from the window mean, which is what separates a structural turning point from a bar that happened to be marginally higher than its neighbors:
   if(is_fractal_high == 1.0)
      high_strength = high[center] / (sum_high / width) - 1.0;
   if(is_fractal_low == 1.0)
      low_strength = 1.0 - low[center] / (sum_low / width);

   //--- the floor is either fixed or a multiple of volatility at the center bar
   const double floor_value = m_dynamic ? m_threshold * volatility[center]
                              : m_threshold;
The m_dynamic branch is the correction to the second defect documented in Part 11. The Python module described the threshold as dynamic but never read volatility. As a result, the same fixed value was applied to both low- and high-range sessions. Here the choice is an explicit input: with InpDynamicThreshold set, InpThreshold becomes a multiplier on ATR expressed as a fraction of price, evaluated at the center bar rather than at the confirmation bar, because the strength being tested is a property of the center bar.
Support and Resistance: A Ring of Events, Not Bars
The Python implementation subsets the price series to bars carrying a valid fractal, applies a rolling maximum of length lookback_period to that subset, and reindexes the result back onto the full bar index with forward fill. The consequence is easy to misread: lookback_period counts fractal events, not bars. With a quiet instrument producing one confirmed fractal every forty bars, a lookback of twenty spans roughly eight hundred bars.
The engine keeps that same semantics and makes it visible, holding the last m_lookback confirmed extremes per side in a small array and recomputing the level whenever a new event arrives:
   if(valid_high == 1.0)
     {
      PushEvent(m_res_events, m_res_count, high[center]);
      m_resistance = MaxOf(m_res_events, m_res_count);
     }
   if(valid_low == 1.0)
     {
      PushEvent(m_sup_events, m_sup_count, low[center]);
      m_support = MinOf(m_sup_events, m_sup_count);
     }
Between events the level is unchanged, which is what forward fill does on the Python side. The distances are then computed against the current bar's midpoint, so they update every bar even when the level does not:
   const double mid = 0.5 * (high[t] + low[t]);

   if(FRAC_IS_VALID(m_resistance))
      row.distance_to_resistance = (m_resistance - mid) / mid;
   if(FRAC_IS_VALID(m_support))
      row.distance_to_support = (mid - m_support) / mid;
Note the asymmetry this creates for a model consumer. The level series is piecewise constant and changes only on confirmed fractals, while the distance series is continuous in price. A tree-based model given both will find most of its signal in the distances; the raw levels are close to useless as features and are published because an EA drawing stop-loss or take-profit levels needs the price, not the ratio.
Breakouts, the Trend Block, and Signals
The breakout definition is the one place where the Python module was already causal. It compares the current close against the extremum of the confirmed fractal, both taken at t-n, which is why the original code applies shift(n) there and nowhere else. That inconsistency is what made the leak elsewhere in the module easy to miss on a first read.
   const double breakout_up   = (close[t] > high[center] && is_fractal_low == 1.0)
                                ? 1.0 : 0.0;
   const double breakout_down = (close[t] < low[center] && is_fractal_high == 1.0)
                                ? 1.0 : 0.0;
The pairing is deliberate and is worth stating because it reads as a transcription error: an upward breakout requires the close to clear the window's high at the center bar while a bullish (low) fractal sits there. The condition therefore fires when price rejects a swing low and then pushes through the same bar's high, not when it clears a prior resistance. The port preserves it so that the two implementations remain comparable; a reader who prefers the resistance-clearing definition should change both sides together.
The trend block consumes the breakout ring rather than rescanning history:
   double density = 0.0;
   double balance = 0.0;

   for(int i = 0; i < m_ma_period; i++)
     {
      density += m_bo_up[i] + m_bo_down[i];
      balance += m_bo_up[i] - m_bo_down[i];
     }

   row.trend_strength  = density / m_ma_period;
   row.trend_direction = Sign(balance);
Signals are breakouts filtered by direction, sized by the strength of the fractal that produced them and normalized by volatility. In Python the sizing term reads fractal_low_strength.shift(2), a hardcoded lag that coincides with the default n=2 and silently misaligns for any other setting. The port has no equivalent expression to get wrong, because the strength it holds is already the strength of the fractal at t-n:
   double strength = 0.0;
   if(buy == 1.0)
      strength = low_strength / (volatility[t] + 1e-8);
   else
      if(sell == 1.0)
         strength = high_strength / (volatility[t] + 1e-8);
The Indicator: Two Buffer Classes With Different Rules
FractalViewer.mq5 holds 20 buffers: 2 display buffers and 18 feature buffers, split across two classes. The arrow buffers are display objects and are written at the center bar, because that is where the extremum belongs on a chart. The feature buffers are written at the confirmation bar and are the only buffers an EA may read.
   //--- markers are display only: the value is known at t, drawn at t-n
   const int center = t - g_engine.HalfWindow();
   if(center >= 0)
     {
      if(row.valid_high == 1.0)
         ArrowHighBuffer[center] = high[center];
      if(row.valid_low == 1.0)
         ArrowLowBuffer[center] = low[center];
     }
The second rule concerns which bars reach the engine at all. ProcessBar maintains internal rings, so consuming a bar twice would push the same fractal into the level ring twice and shift the breakout history by one slot. On a live chart OnCalculate runs on every tick with the forming bar in the last slot, and that bar's high, low, and close all change until it closes. The loop therefore stops one bar short of the array end:
   //--- only closed bars are fed: the forming bar would be reprocessed on
   //--- every tick, and the engine consumes each bar exactly once
   const int last_closed = rates_total - 2;
   FractalRow row;

   for(int t = g_processed; t <= last_closed; t++)
     {
      ClearBar(t);
      if(!g_engine.ProcessBar(high, low, close, g_volatility, t, row))
         return(0);
      StoreRow(t, row, high, low);
      g_processed = t + 1;
     }
The engine enforces the same rule from its own side. ProcessBar rejects any index that is not exactly one past the previous one and prints the expected value, which converts a silent state corruption into a log line during the first test run.
Three Defects Found During the Port
A series-indexed feed inverts the lag without changing anything visible
Indicator buffers are chronological by default while the direction of the arrays delivered to OnCalculate depends on the caller. Feeding the engine a series-indexed copy, with index zero holding the newest bar, produces output that survives every casual check. Running the shipped engine over a reversed copy of the same 1,200-bar series returned 180 detections against 180 for the correct feed, an identical count, because a window maximum does not care which way the window is traversed.
The alignment is what changes. Comparing both outputs against the centered detector shows the correct feed matching it shifted forward by n on 100% of bars, and the reversed feed matching it shifted backward by n on 100% of bars: a look-ahead of 2n bars. The two outputs agree with each other on 76.3% of bars, so the defect is neither a crash nor a no-op. The indicator calls ArraySetAsSeries(..., false) on every input array and every buffer for this reason.
One column failed parity, and the engine was not the cause
The first full parity run passed on seventeen of eighteen columns and failed on signal_strength at a deviation of 2.5e-9 against a tolerance of 1e-9. The engine was correct: the direct comparison, with no file in between, agreed to 4.4e-16. The export was the cause. Writing the volatility column with DoubleToString(value, 12) gives twelve digits after the decimal point, which for an ATR ratio near 1e-3 is nine significant digits. Dividing by that value in the sizing term multiplies the truncation error by roughly a thousand, and only that one column crosses the threshold.
The fix is the negative-digits form, DoubleToString(value, -16), which writes sixteen significant digits in scientific notation instead of a fixed number of decimal places. After the change all eighteen columns pass at 1e-10. The general lesson is that a tolerance test on exported data measures the export format as well as the code, and a single failing column is more likely to indicate an issue in the serializer than in the algorithm.
A stateful engine and a tick-driven loop are a bad default pairing
The level ring is the component that made this visible. An engine holding only window-local state can be called repeatedly on the same bar with no consequence, which is the usual assumption behind an OnCalculate body that recomputes the last bar on every tick. Here the same call pushes a duplicate event into the ring, so a level built from twenty confirmed fractals can end up built from one fractal counted twenty times. The engine could have been written to accept re-entry by keeping a shadow copy of the state, at the cost of duplicating every ring on every bar. A cheaper contract is to reject out-of-order input and process only closed bars. This also makes failures explicit.
Results: Feature Output and Python Parity
The engine was run over 1,200 synthetic hourly bars generated by a variance recursion with volatility clustering, which produces local extrema at rates comparable to a traded instrument. Figure 2 shows a 160-bar section of that run.
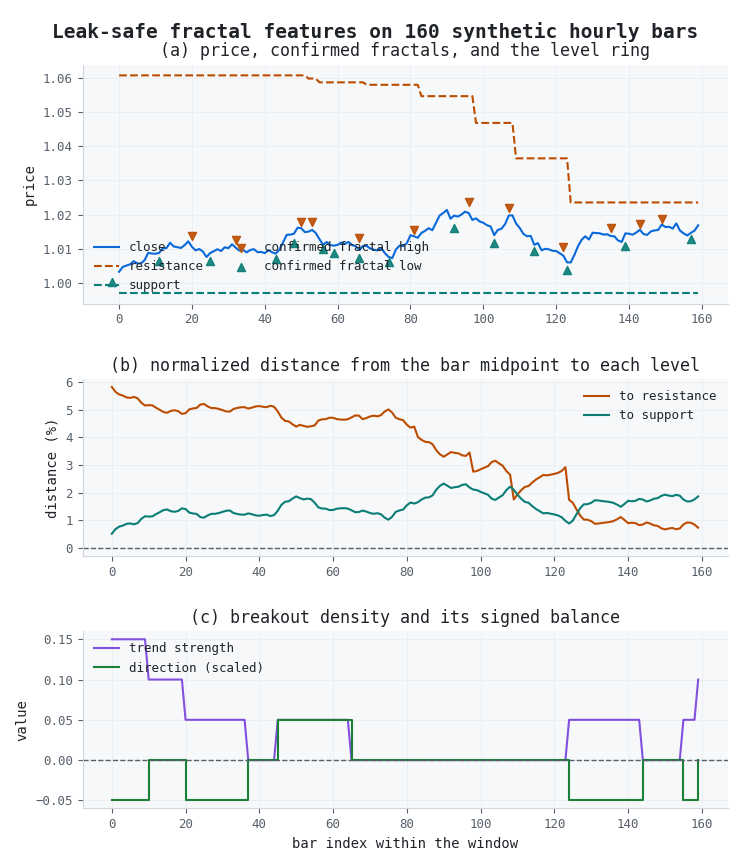
Figure 2. Three-panel illustration of the engine output over a 160-bar window
- Panel (a): close price with confirmed fractal markers drawn at the center bar and the two level series, which step only when a new confirmed fractal enters the ring.
- Panel (b): distances from the bar midpoint to each level, the continuous features a model would consume.
- Panel (c): breakout density over the trailing 20 bars and its signed balance, which gates the entry signals.
Panel (a) shows the level behavior described in Section 5. Resistance holds flat across long stretches and steps only when a confirmed bearish (high) fractal enters the ring, while the distance in panel (b) moves on every bar. The trend direction in panel (c) spends most of the window at zero, which is the correct reading of a balance that is exactly zero when upward and downward breakouts cancel.
Numerical agreement was checked by executing the shipped engine against the Python reference across five parameter sets, covering n from 1 to 4, both threshold modes, and level rings from 5 to 20 events. All eighteen columns matched in every set, with a maximum relative deviation of 1.1e-13.
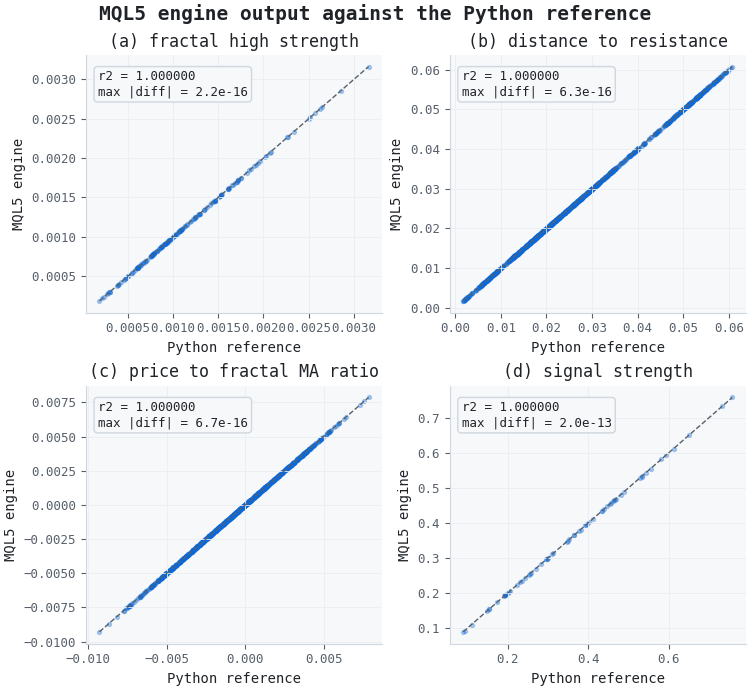
Figure 3. Four-panel illustration of numerical agreement between the two implementations
- Panel (a): fractal high strength, restricted to bars carrying a bearish fractal.
- Panel (b): distance to resistance, the densest of the continuous features.
- Panel (c): price to fractal moving-average ratio.
- Panel (d): signal strength, restricted to bars carrying a signal.
The comparison after a file round trip, which is the check a reader can reproduce with the attached scripts, gives the following:
Column | Max absolute deviation | r² |
|---|---|---|
| Detection and validity flags | 0.0 | 1.000000 |
| Strength columns | 8.9e-16 | 1.000000 |
| Levels | 0.0 | 1.000000 |
| Distances | 1.1e-15 | 1.000000 |
| Trend block | 1.1e-15 | 1.000000 |
| Signal strength | 2.3e-13 | 1.000000 |
What this does and does not establish. It establishes that a model trained on the Python features and deployed against the MQL5 features consumes the same numbers, which is the only property that makes the ONNX pipeline from the Blueprint series meaningful. It establishes nothing about whether these features predict anything. The synthetic series has no structure to find, and a parity test cannot distinguish a correct feature from a useless one computed identically in two languages.
Reading the Features From an EA
The indicator is loaded once and read by buffer index. Only the confirmation-bar buffers are safe to read; buffers 0 and 1 are the display markers and carry values written n bars after the index they occupy.
   int handle = iCustom(_Symbol, _Period, "FractalViewer",
                        2, 20, 20, 0.001, false, 14);
   if(handle == INVALID_HANDLE)
      return(INIT_FAILED);

   double buy[];
   double size[];
   double distance[];

   //--- shift 1 is the most recent closed bar
   if(CopyBuffer(handle, 17, 1, 1, buy) < 1)
      return;
   if(CopyBuffer(handle, 19, 1, 1, size) < 1)
      return;
   if(CopyBuffer(handle, 12, 1, 1, distance) < 1)
      return;

   if(buy[0] == 1.0 && distance[0] > 0.0)
      OpenLong(size[0]);
Reading at shift 1 rather than shift 0 is the second half of the leak-safe contract. Shift 0 is the forming bar, which the indicator leaves empty by design, and a backtest that reads it on a broker feed with partial bar data will produce results that cannot be reproduced live. The same convention applies to the feature export used for model training: the row timestamped at bar t holds only information available at the close of bar t.
Conclusion
The centered-window leak that Part 11 documented in Python does not translate to MQL5 as a shift, because the language has no column to shift. It translates to a decision about which bar index receives a detection and when the write may occur, and the two conventions that follow from that decision are both defensible for chart annotation but only one of them is defensible for a feature buffer. CFractalFeatures.mqh publishes every feature at the confirmation bar and keeps the display markers in separate buffers that no consumer should read.
The port surfaced three problems that the Python implementation could not have. A series-indexed feed flips the confirmation lag into look-ahead bias, even though the detection count remains unchanged. An export format with too few significant digits fails a tolerance test in the one column that divides by a small number, which points at the serializer rather than the algorithm. A stateful engine driven by a tick-level callback consumes bars more than once unless the loop and the engine both refuse it.
Numerical agreement with the Python reference holds to 1.1e-13 across five parameter sets and all eighteen columns, which is the precondition for training on one side of the pipeline and trading on the other. It is not evidence that the features carry signal. That question belongs to the feature importance work in the Blueprint series, and the next article in this series assembles the five feature families built so far into a single panel indicator so that they can be inspected together on one chart.
References
- Lopez de Prado, M. (2018). Advances in Financial Machine Learning. Wiley.
- Williams, B. (1998). Trading Chaos: Maximize Profits with Proven Technical Techniques. Wiley.
- Mandelbrot, B. (2004). The (Mis)Behavior of Markets: A Fractal View of Financial Turbulence. Basic Books.
- Murphy, J. J. (1999). Technical Analysis of the Financial Markets. New York Institute of Finance.
Attached Files
File | Location | Description | |
|---|---|---|---|
| 1. | CFractalFeatures.mqh | MQL5\Include\Features | Feature engine. Init, Reset, ProcessBar for bar-by-bar use, and Compute for a full series. |
| 2. | FractalViewer.mq5 | MQL5\Indicators\Features | Chart indicator with four plotted buffers (two arrow markers, two level lines) and sixteen calculation-only buffers; eighteen of the twenty are addressable through iCustom. |
| 3. | FractalValidation.mq5 | MQL5\Scripts\Features | Exports bars and all eighteen features to CSV at sixteen significant digits. |
| 4. | fractals_reference.py | Python | Bar-indexed statement of the leak-safe contract, and the synthetic series generator used in Figures 2 and 3. |
| 5. | validate_fractals.py | Python | Parity checker. Reports maximum absolute deviation and r² per column against a chosen tolerance. |
Warning: All rights to these materials are reserved by MetaQuotes Ltd. Copying or reprinting of these materials in whole or in part is prohibited.
This article was written by a user of the site and reflects their personal views. MetaQuotes Ltd is not responsible for the accuracy of the information presented, nor for any consequences resulting from the use of the solutions, strategies or recommendations described.

 Elite Crystal Evolution Algorithm (CEO-inspired): Practical Implementation
 Price Action Analysis Toolkit Development (Part 78): Extending the Indicator Search Panel with Symbol Selection in MQL5
 Building Volatility Models in MQL5 (Part V): Implementing EGARCH as an Alternate Asymmetric Volatility Process
 Measuring What Matters (Part 3): The Reconstruction Engine — Validating Risk Footprints with Matrix Algebra

- Free trading apps
- Over 8,000 signals for copying
- Economic news for exploring financial markets
You agree to website policy and terms of use
i took my time reading this,all i can say is thanks for this masterpiece