Association Rules and Probability Theory in Forex: A Signal Filter Without Neural Networks or Magic
 204
 0

Introduction
In previous versions, we enhanced the trading system with a neural network filter: the network analyzed market features and determined whether its forecast matched the direction of the proposed entry. But there is another way — one that is simpler, more transparent, and very convenient for MQL5. This approach uses association rules and basic probability theory.
Here is the idea: instead of forcing the model to "think" like a neural network, we collect statistics on recurring market conditions. If the market frequently behaves in a certain way after a combination of features occurs, the system records this as a rule. For example: if the RSI is in the oversold zone, the price is below the EMA, volatility is high, and it is during the European trading session, then after N bars, the price is more likely to rise than to fall. This is not a prediction of the future in a mystical sense. This is a careful statistical estimate of what typically happened under similar conditions in historical data.
This approach works well for trading bots because it doesn't require Python, weight files, external libraries, or extensive training. Everything can be done right inside the Expert Advisor: collect features, discretize them into events, calculate frequencies, estimate probabilities, and use the result as a final filter before entry.
What Is an Association Rule in Trading?
In classical data analysis, an association rule looks like this:
A => B
Here, A is a set of conditions and B is the consequent. In a store, there may be a rule: if someone buys bread and cheese, they often buy butter as well. In Forex, the structure is the same, except that market events are used instead of products:
RSI_LOW + PRICE_BELOW_EMA + ATR_HIGH => FUTURE_UP
This means that, based on historical data, there were bars where the conditions RSI_LOW, PRICE_BELOW_EMA, and ATR_HIGH were all met at the same time. For some of these bars, the price was higher at the end of the specified time horizon. We are not interested in the rule itself as a nice-sounding phrase, but rather in its quantitative characteristics: support, confidence, probability gain, and stability over held-out historical data.
| Concept | Formula | Meaning for Forex |
|---|---|---|
| Support | count(A and B) / N | How often the rule occurs in historical data |
| Confidence | count(A and B) / count(A) | The probability of event B given event A |
| Base rate | count(B) / N | The base probability of a price rise or price decline, without conditions |
| Lift | confidence(A => B) / base_rate(B) | How much better the rule performs relative to the market's base rate |
| Edge | confidence - base_rate | The net probabilistic edge of the rule |
The biggest mistake a beginner makes is to focus only on confidence. If the rule has worked 3 out of 3 times, the confidence will be 100%, but that does not prove anything: the sample size is too small. Therefore, the rule must meet a minimum support threshold: for example, at least 30, 50, or 100 historical instances. Otherwise, the robot will start believing in random coincidences.
Why This Is Not Just an Ordinary Indicator
A standard indicator returns a single value: RSI, EMA, ATR, slope, signal, or color. An association rule system works differently. It looks at a combination of events. A single event may be weak on its own, but when combined with others, it becomes informative.
For example, an RSI oversold condition does not in itself guarantee a reversal. The price can remain oversold for a long time during a strong trend. However, if oversold conditions coincide with rising volatility, a move away from the EMA, slowing momentum, and a specific trading session, such a combination may reveal a statistical pattern. Association rules look for stable relationships, not just a single indicator.
In this sense, the approach is similar to the manual reasoning of an experienced trader. A trader rarely thinks in terms of a single number. He says, "The RSI is low, the price is far from the moving average, the ATR has increased, and pullbacks are common in the European session." Association rules translate this logic into formal frequencies and probabilities.
How to Turn the Market into a Set of Events
To use association rules, continuous values must be converted into discrete events. An RSI of 31.7, an ATR of 0.00124, and an EMA slope of 0.00018 are awkward to use in rules. But it is convenient to say: RSI_LOW, ATR_HIGH, EMA_UP. This is called discretization.
| # | Source | Event | Condition | Meaning |
|---|---|---|---|---|
| 0 | RSI | RSI_LOW | RSI < 35 | The market is close to being oversold |
| 1 | RSI | RSI_HIGH | RSI > 65 | The market is nearing overbought territory |
| 2 | EMA | PRICE_ABOVE_EMA | Close > EMA(50) | The price is above the moving average |
| 3 | EMA | PRICE_BELOW_EMA | Close < EMA(50) | The price is below the moving average |
| 4 | ATR | ATR_HIGH | ATR / Close > threshold | High-volatility regime |
| 5 | Momentum | MOM_UP | Close[shift] > Close[shift+6] | Upward momentum |
| 6 | Momentum | MOM_DOWN | Close[shift] < Close[shift+6] | Downward momentum |
| 7 | Time | SESSION_EU | 8 <= hour < 17 | European Session |
Important: Events must be sufficiently coarse-grained. If the market is broken down into hundreds of rare conditions, each rule will occur too infrequently. Then the statistics will look good, but they will be useless. For the first version, it is best to use 8–20 stable events and rule lengths of 2–4 events.
Label: What Counts as a Successful Outcome
The consequent of a rule must be measurable. The simplest option is the direction of future price movement after InpRuleHorizon bars:
FUTURE_UP   = Close[shift - Horizon] > Close[shift]
FUTURE_DOWN = Close[shift - Horizon] < Close[shift]
In MQL5 series indexing, a newer bar has a smaller shift. Therefore, the future bar for a historical example is at shift − Horizon. If `shift` is greater than `Horizon`, the corresponding future bar has already closed and is available in the historical data. During training, the outcome is known; in live trading, only the closed bar at shift=1 is used, ruling out access to future data.
It is better to add a minimum price movement threshold in points. If the price has changed by 1–2 points over the time horizon, that is not a useful signal — it is noise. The InpRuleMinMovePts parameter allows you to filter out such cases.
//+------------------------------------------------------------------------------------+
//| Future direction label for the historical bar at shift.                            |
//| Returns 1 for a price rise, 0 for a price decline. Minor noise is filtered out.    |
//+------------------------------------------------------------------------------------+
bool RuleLabel(int shift, int &label)
  {
   if(shift < InpRuleHorizon+1) return(false);

   double nowClose[], futureClose[];
   ArraySetAsSeries(nowClose,true);
   ArraySetAsSeries(futureClose,true);

   if(CopyClose(_Symbol,_Period,shift,1,nowClose)<1) return(false);
   if(CopyClose(_Symbol,_Period,shift-InpRuleHorizon,1,futureClose)<1) return(false);

   double movePts = (futureClose[0]-nowClose[0])/_Point;
   if(MathAbs(movePts) < InpRuleMinMovePts) return(false);

   label = (movePts > 0.0) ? 1 : 0;
   return(true);
  }
Event Encoding in MQL5
For simplicity, each event can be represented by a bit in an integer mask. If an event's condition is met, the corresponding bit is set. Then the combination of conditions is converted into a single number. It is convenient, fast, and does not require complex data structures.
enum ENUM_RULE_EVENT
  {
   EV_RSI_LOW         = 0,
   EV_RSI_HIGH        = 1,
   EV_PRICE_ABOVE_EMA  = 2,
   EV_PRICE_BELOW_EMA  = 3,
   EV_ATR_HIGH        = 4,
   EV_MOM_UP          = 5,
   EV_MOM_DOWN        = 6,
   EV_SESSION_EU      = 7,
   EV_SESSION_US      = 8
  };

int EventBit(int eventId)
  {
   return(1 << eventId);
  }
The event collection function must work at any shift because training iterates over historical data, while model inference in live trading uses the most recent closed bar. Features are calculated using the same function during training and live trading — this is essential to prevent discrepancies between calculations on historical data and live execution.
//+------------------------------------------------------------------+
//| Collects market events at bar index shift.                       |
//| Returns a bit mask: each set bit represents an event.            |
//+------------------------------------------------------------------+
bool BuildMarketEvents(int shift, int &mask)
  {
   mask = 0;

   double rsi[]; ArraySetAsSeries(rsi,true);
   double atr[]; ArraySetAsSeries(atr,true);
   double ema[]; ArraySetAsSeries(ema,true);
   double cl[];  ArraySetAsSeries(cl,true);

   if(CopyBuffer(g_rsiHandle,0,shift,1,rsi)<1) return(false);
   if(CopyBuffer(g_atrHandle,0,shift,1,atr)<1) return(false);
   if(CopyBuffer(g_emaHandle,0,shift,1,ema)<1) return(false);
   if(CopyClose(_Symbol,_Period,shift,7,cl)<7) return(false);

   if(rsi[0] < InpRsiLow)  mask |= EventBit(EV_RSI_LOW);
   if(rsi[0] > InpRsiHigh) mask |= EventBit(EV_RSI_HIGH);

   if(cl[0] > ema[0]) mask |= EventBit(EV_PRICE_ABOVE_EMA);
   if(cl[0] < ema[0]) mask |= EventBit(EV_PRICE_BELOW_EMA);

   double atrNorm = atr[0] / cl[0];
   if(atrNorm > InpAtrHighNorm) mask |= EventBit(EV_ATR_HIGH);

   if(cl[0] > cl[6]) mask |= EventBit(EV_MOM_UP);
   if(cl[0] < cl[6]) mask |= EventBit(EV_MOM_DOWN);

   datetime bt = iTime(_Symbol,_Period,shift);
   MqlDateTime mt; TimeToStruct(bt,mt);
   if(mt.hour >= 8  && mt.hour < 17) mask |= EventBit(EV_SESSION_EU);
   if(mt.hour >= 13 && mt.hour < 22) mask |= EventBit(EV_SESSION_US);

   return(true);
  }
From Events to Rules
If multiple events are active on a bar, you can build combinations of events from them. For example, the mask contains RSI_LOW, PRICE_BELOW_EMA, ATR_HIGH, and SESSION_EU. In that case, the system can check rules of length 2 and 3:
RSI_LOW + PRICE_BELOW_EMA
RSI_LOW + ATR_HIGH
PRICE_BELOW_EMA + ATR_HIGH
RSI_LOW + PRICE_BELOW_EMA + ATR_HIGH
RSI_LOW + ATR_HIGH + SESSION_EU
The longer the rule, the more precise the description of the state, but the fewer historical examples there are. Therefore, rules of length 2–3 are often sufficient for an Expert Advisor used in live trading. Rules of length 4 can be used cautiously and only when a large amount of historical data is available.
In MQL5, it is convenient to store a rule's statistics in a structure: the condition mask, the number of times the condition occurred, the number of times it was followed by a price rise, and the number of times it was followed by a price decline. Then, probabilities are calculated based on these counts.
struct SRuleStat
  {
   int mask;
   int total;
   int up;
   int down;
  };

SRuleStat g_rules[];
int      g_ruleCount = 0;
int      g_baseUp = 0;
int      g_baseDown = 0;
A linear search can be used to find a rule. For a small number of events, this is sufficient. If there are a lot of rules, you can add sorting by mask or a simple hash table, but that isn't necessary for the first version.
//+------------------------------------------------------------------+
//| Find a rule by its mask or create a new one.                     |
//+------------------------------------------------------------------+
int FindOrAddRule(int ruleMask)
  {
   for(int i=0;i<g_ruleCount;i++)
     if(g_rules[i].mask == ruleMask)
       return(i);

   ArrayResize(g_rules,g_ruleCount+1);
   g_rules[g_ruleCount].mask  = ruleMask;
   g_rules[g_ruleCount].total = 0;
   g_rules[g_ruleCount].up    = 0;
   g_rules[g_ruleCount].down  = 0;

   g_ruleCount++;
   return(g_ruleCount-1);
  }

//+------------------------------------------------------------------+
//| Add an observation: condition ruleMask and future label label.   |
//+------------------------------------------------------------------+
void AddRuleObservation(int ruleMask, int label)
  {
   if(ruleMask == 0) return;

   int id = FindOrAddRule(ruleMask);
   g_rules[id].total++;

   if(label == 1) g_rules[id].up++;
   else          g_rules[id].down++;
  }
Generating Combinations
You can start with rules of length 1, 2, and 3. Rules of length 1 provide basic diagnostics. Rules of length 2–3 already describe combinations of market conditions. Below is a simple implementation for generating combinations from the active events.
//+------------------------------------------------------------------+
//| Break down the event mask into a list of active eventId values.  |
//+------------------------------------------------------------------+
int ExtractEvents(int mask, int &events[])
  {
   ArrayResize(events,0);
   int n=0;

   for(int e=0;e<16;e++)
     {
       if((mask & EventBit(e)) != 0)
         {
           ArrayResize(events,n+1);
           events[n]=e;
           n++;
       }
     }
   return(n);
  }

//+------------------------------------------------------------------+
//| Add all rules of length 1, 2, and 3 for a single bar.            |
//+------------------------------------------------------------------+
void AddCombinations(int eventMask, int label)
  {
   int ev[];
   int n = ExtractEvents(eventMask,ev);

   //--- Rules consisting of one event
   for(int a=0;a<n;a++)
     AddRuleObservation(EventBit(ev[a]),label);

   //--- Rules consisting of two events
   for(int a=0;a<n;a++)
     for(int b=a+1;b<n;b++)
       {
         int m = EventBit(ev[a]) | EventBit(ev[b]);
         AddRuleObservation(m,label);
       }

   //--- Rules consisting of three events
   for(int a=0;a<n;a++)
     for(int b=a+1;b<n;b++)
       for(int c=b+1;c<n;c++)
         {
           int m = EventBit(ev[a]) | EventBit(ev[b]) | EventBit(ev[c]);
           AddRuleObservation(m,label);
         }
  }
Training Rules on Historical Data
Training here is not about gradient descent or weight tuning. We simply iterate through the historical data, construct events for each bar, generate a label for the future price direction, and update the rule counters. This makes the system very transparent: any probability can be explained by the number of historical instances.
//+------------------------------------------------------------------+
//| Training association rules using historical data.                |
//+------------------------------------------------------------------+
void TrainRules()
  {
   ArrayResize(g_rules,0);
   g_ruleCount = 0;
   g_baseUp    = 0;
   g_baseDown  = 0;

   int fromShift = InpRuleHorizon + 1;
   int maxBars   = Bars(_Symbol,_Period);
   int toShift   = MathMin(maxBars-60, InpRuleHorizon + InpRuleLookback);

   if(toShift <= fromShift+50)
     {
       Print("RULES: insufficient history for training");
       return;
     }

   int used = 0;

   for(int shift=fromShift; shift<=toShift; shift++)
     {
       int label;
       if(!RuleLabel(shift,label)) continue;

       int eventMask;
       if(!BuildMarketEvents(shift,eventMask)) continue;
       if(eventMask == 0) continue;

       if(label == 1) g_baseUp++;
       else         g_baseDown++;

       AddCombinations(eventMask,label);
       used++;
   }

   Print("RULES: examples=",used," rules=",g_ruleCount,
       " baseUp=",g_baseUp," baseDown=",g_baseDown);
  }
After this training, a table of rules is stored in the Expert Advisor's memory. Each rule can be evaluated based on the probability of a price rise, the probability of a price decline, support, lift, and edge. These are the numbers used in the trading filter.
Probability Theory: How Not to Deceive Yourself
In trading, it's dangerous to focus solely on raw percentages. If a rule has occurred 5 times and was followed by a price rise 4 times, the probability of a price rise is 80%. But statistically, that's a weak basis. If a rule occurred 200 times and was followed by a price rise 120 times, the probability is only 60%, but such a rule may be more reliable because it has more observations.
Therefore, the filter needs three safeguards:
- Minimum support. A rule is not used until it has been encountered at least InpMinRuleCount times.
- Probability smoothing. Instead of using the raw up/total ratio, it is better to use a smoothed estimate so that rare rules do not receive extreme probability estimates.
- Comparison with the baseline probability. The rule must outperform the baseline frequency of a price rise or price decline in the market.
The Laplace estimate is a convenient tool for smoothing:
P(up | A) = (up + alpha) / (total + 2 * alpha)
If alpha = 1, even a rule with 0/1 will no longer yield 0% or 100%. Its estimate will be more conservative. This is important because the Forex market is noisy, and random extreme estimates quickly lead to overfitting.
//+------------------------------------------------------------------+
//| Smoothed probability of a price rise under the rule.             |
//+------------------------------------------------------------------+
double RuleProbUp(const SRuleStat &r)
  {
   double a = InpLaplaceAlpha;
   return((r.up + a) / (r.total + 2.0*a));
  }

//+-------------------------------------------------------------------------------------+
//| Baseline probability of a price rise across all historical data used for training.  |
//+-------------------------------------------------------------------------------------+
double BaseProbUp()
  {
   double a = InpLaplaceAlpha;
   return((g_baseUp + a) / (g_baseUp + g_baseDown + 2.0*a));
  }
Choosing the Best Rule for the Current Market
On the current closed bar, the Expert Advisor builds an event mask. It then searches for all rules whose conditions are contained in the current mask. For example, if RSI_LOW, PRICE_BELOW_EMA, and ATR_HIGH are currently active, then rules such as RSI_LOW, PRICE_BELOW_EMA, and RSI_LOW+ATR_HIGH apply.
The best matching rule can be selected based on its score. A simple scoring formula:
scoreUp = (P(up | A) - BaseP(up)) * log(1 + total)
The probabilistic edge is multiplied by the logarithm of the number of observations. This prevents a rare rule with an attractive probability estimate from outranking a more robust rule with adequate support.
//+------------------------------------------------------------------+
//| Checks whether ruleMask is a subset of currentMask.              |
//+------------------------------------------------------------------+
bool IsSubMask(int ruleMask, int currentMask)
  {
   return((ruleMask & currentMask) == ruleMask);
  }

//+------------------------------------------------------------------+
//| Find the best probabilistic estimate of the current state.       |
//| Returns confidence: + for up, - for down.                        |
//+------------------------------------------------------------------+
bool GetRuleConfidence(int currentMask, double &confidence)
  {
   confidence = 0.0;

   double baseUp = BaseProbUp();
   double bestScore = 0.0;
   bool found = false;

   for(int i=0;i<g_ruleCount;i++)
     {
       SRuleStat r = g_rules[i];
       if(r.total < InpMinRuleCount) continue;
       if(!IsSubMask(r.mask,currentMask)) continue;

       double pUp = RuleProbUp(r);
       double edgeUp = pUp - baseUp;
       double score = MathAbs(edgeUp) * MathLog(1.0 + r.total);

       if(score > bestScore)
         {
           bestScore = score;
           confidence = edgeUp;
           found = true;
       }
   }

   return(found);
  }
Here, confidence is not the probability itself, but the edge relative to the baseline frequency. If confidence is positive, the matching rule favors a price rise. If it is negative, it favors a price decline. This format is useful for a trading filter: a BUY signal passes when confidence is sufficiently positive, and a SELL signal passes when confidence is sufficiently negative.
Integration into a Trading Filter
Association rules are best used as a gating filter rather than as a standalone entry trigger. The primary signal may come from an RSI divergence, an SMC zone, a breakout, a pullback to the EMA, or any other trading logic. Rules do not open a trade on their own. They simply answer the question: do the statistics support the direction of the candidate signal?
//+------------------------------------------------------------------+
//| Association rule filter.                                         |
//| dir = +1 for BUY, dir = -1 for SELL.                             |
//+------------------------------------------------------------------+
bool RulesAccept(int dir)
  {
   if(!InpUseRules) return(true);
   if(g_ruleCount <= 0) return(InpRulesFailOpen);

   int mask;
   if(!BuildMarketEvents(1,mask)) return(InpRulesFailOpen);

   double conf;
   if(!GetRuleConfidence(mask,conf)) return(InpRulesFailOpen);

   bool ok = (dir == 1) ? (conf >=  InpRuleThreshold)
               : (conf <= -InpRuleThreshold);
   return(ok);
  }
That results in double confirmation. First, formal trading logic identifies a candidate. Then the probabilistic layer checks whether similar states occurred in the historical data and which direction they most often led to. If the candidate's direction aligns with the statistical edge, the signal passes. If not, it is rejected.
System Parameters
| Parameter | Default | Comment |
|---|---|---|
| InpUseRules | true | Enable the association rule filter |
| InpRuleLookback | 3,000 | Number of historical data bars used to calculate rule statistics |
| InpRuleHorizon | 12 | Number of bars ahead at which to measure the outcome |
| InpRuleMinMovePts | 20 | Minimum price movement required to assign a label and filter out noise |
| InpMinRuleCount | 50 | Minimum support for the rule |
| InpRuleThreshold | 0.08 | Minimum probabilistic edge over the baseline |
| InpLaplaceAlpha | 1.0 | Probability smoothing to guard against rare rules with extreme probability estimates |
| InpRetrainRulesBars | 250 | How often should rule statistics be recalculated? |
| InpRulesFailOpen | false | false = do not trade if the rules are not ready |
input group "=== Association rules ==="
input bool   InpUseRules         = true;   // Enable the rule filter
input int    InpRuleLookback     = 3000;   // Number of historical data bars for rules
input int    InpRuleHorizon      = 12;     // Future outcome horizon
input double InpRuleMinMovePts   = 20.0;   // Minimum movement for a label
input int    InpMinRuleCount    = 50;      // Minimum support for the rule
input double InpRuleThreshold   = 0.08;    // Probabilistic edge threshold
input double InpLaplaceAlpha    = 1.0;     // Laplace Smoothing
input int    InpRetrainRulesBars= 250;     // Retrain every N bars
input bool   InpRulesFailOpen   = false;   // Trade if there are no rules

input group "=== Discretization of events ==="
input double InpRsiLow        = 35.0;
input double InpRsiHigh       = 65.0;
input double InpAtrHighNorm    = 0.0012;
Validation: Where Self-Deception Most Often Occurs
Association rules are very easy to overfit. Simply adding too many events, using overly long combinations of events, or setting the minimum rule support too low is enough for the system to find attractive rules even in random noise. That's why we need honest validation.
The correct approach for a time series:
- The older 70–80% of the historical data is used to build rules.
- The newer 20–30% of the historical data is used only for validation.
- During validation, rules are not recalculated or adjusted.
- The comparison covers not only directional accuracy but also the trading system's performance: profit, drawdown, expectancy per trade, and losing streaks.
Bars must not be shuffled randomly as they would be in standard tabular-data tasks. The chronological order is important. Randomly mixing older and newer bars can cause market regime leakage: a rule appears to be tested on future data, but it has actually already seen similar periods during training.
For diagnostic purposes, it is helpful to log the best rules. Not for manual tuning, but as a sanity check. If the best rule occurred 51 times and indicates a 98% probability of a price rise, that is suspicious. If a rule has occurred 400 times and yields a 58% success rate compared to a baseline of 50%, that seems more realistic.
//+------------------------------------------------------------------+
//| Print the best rules for diagnostic purposes.                    |
//+------------------------------------------------------------------+
void PrintTopRules()
  {
   double baseUp = BaseProbUp();

   for(int i=0;i<g_ruleCount;i++)
     {
       if(g_rules[i].total < InpMinRuleCount) continue;

       double pUp = RuleProbUp(g_rules[i]);
       double edge = pUp - baseUp;
       double lift = (baseUp > 0.0) ? pUp/baseUp : 0.0;

       if(MathAbs(edge) >= InpRuleThreshold)
         Print("RULE mask=",g_rules[i].mask,
             " total=",g_rules[i].total,
             " pUp=",DoubleToString(pUp,3),
             " edge=",DoubleToString(edge,3),
             " lift=",DoubleToString(lift,3));
   }
  }
How Association Rules Differ from a Markov Model and an MLP
A Markov model typically estimates transitions between states: the market transitions more frequently from state A to state B or C. An MLP attempts to learn the nonlinear relationship between features and a future label. Association rules fall somewhere in between: they do not construct a complex function, but they can identify stable combinations of conditions.
| Method | What it stores | Pros | Cons |
|---|---|---|---|
| Markov model | The state transition matrix | Simple, fast, easy to understand | It depends heavily on the quality of the state encoding |
| MLP | Neural network weights | Detects nonlinear relationships | Less transparent; requires training and measures to control overfitting |
| Association rules | Frequencies of combinations of events and outcomes | Transparent probabilities; every decision is easy to explain | Works poorly when combinations are too rare |
The strength of the rules lies in their explainability. You can open the log and see that the BUY signal passed the filter because the current combination of events had occurred 184 times, a price rise followed in 61% of those cases, the baseline probability of a price rise was 51%, and the edge was 10 percentage points. This is very valuable for a trading bot: the filter does not seem like a black box.
Practical Entry Logic
In a real-world system, the order of the filters might be as follows:
- The basic trading logic identifies a candidate: BUY or SELL.
- The risk manager checks the limits, drawdown, spread, number of positions, and trading hours.
- The HTF filter checks the direction on the higher timeframe.
- Association rules check whether the current combination of events has a statistical edge.
- If all filters approve the entry, the Expert Advisor opens a trade or adds a grid level.
It is best to place rules toward the end of the chain, because their purpose is to confirm a setup that has already been identified, rather than to look for trades on every bar. Using rules as the primary entry generator produces too many weak statistical indications. If used as a final filter, they remove some of the poor entries and make the system more conservative.
bool CheckSignal(int &dir)
  {
   if(!FindBaseSetup(dir))      return(false);
   if(!RiskManagerAllows())    return(false);
   if(!HtfFilterAllows(dir))   return(false);
   if(!RulesAccept(dir))       return(false);

   return(true);
  }
Backtest: Actual Results on Historical Data
Theory and beautiful equations are only half the story. The rules must prove themselves in the strategy tester, and it is best to look honestly at the numbers from the outset, rather than just at the fact that the Expert Advisor trades at all. Below are the results of a one-month backtest (June 1, 2026–July 1, 2026) on the EURUSD pair (H1 timeframe) using the MetaTrader 5 Strategy Tester with RoboForex-Pro as the broker.
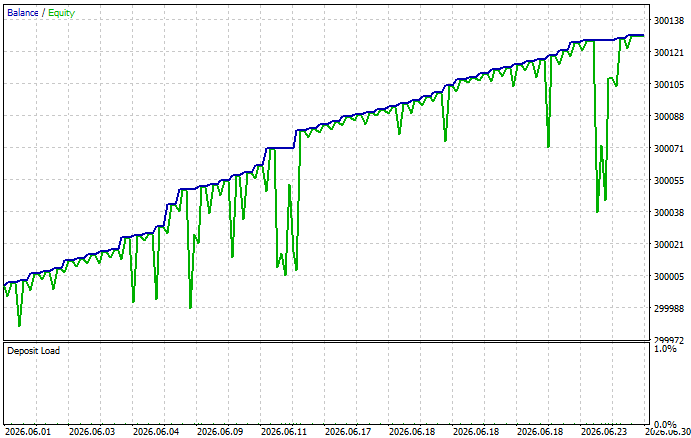
| Backtest parameter | Value |
|---|---|
| Symbol / timeframe | EURUSD, H1 |
| Test period | June 1, 2026 – July 1, 2026 |
| InpRuleLookback / InpRuleHorizon | 5,000 / 24 |
| InpRuleMinMovePts | 240 |
| InpMinRuleCount / InpRuleThreshold | 50 / 0.08 |
| InpRetrainRulesBars | 20 |
| Lot size / profit target | 0.1 / 1.0 USD per position |
| InpOneTradeAtATime | true |
| Deposit / leverage | 300,000 USD / 1:500 |
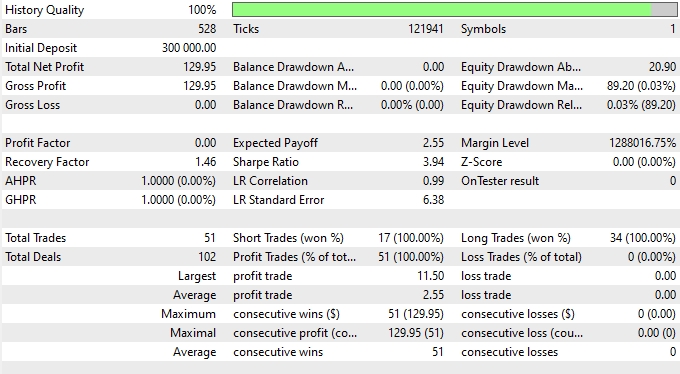
Final tester metrics:
| Metric | Value |
|---|---|
| Total trades / entries (Total Trades / Deals) | 51 positions, 102 deals |
| Short / long positions (won %) | 17 sell (100%), 34 buy (100%) |
| Profitable / losing | 51 out of 51 (100%) profitable, 0 losing |
| Net profit | 129.95 USD |
| Gross profit / Gross loss | 129.95 USD / 0.00 USD |
| Profit factor | Undefined (0.00 in the report — Gross Loss is zero) |
| Expected payoff | 2.55 USD per trade |
| Recovery factor / Sharpe ratio | 1.46 / 3.94 |
| Maximum equity drawdown | 89.20 USD (0.03% of a 300,000 deposit) |
| Maximum balance drawdown | 0.00 USD (0.00%) |
| Largest winning / losing trade | 11.50 USD / 0.00 USD |
| Position holding time (min / avg. / max.) | 0:00:40 / 5:48:47 / 84:00:40 |
At first glance, the numbers look even more impressive than in the previous backtest: 51 closed positions instead of nine, a net profit of nearly 130 USD, and a Sharpe ratio of about 3.94. But this is precisely where the same critical scrutiny discussed in the section on rule validation is particularly important: it exposes the problem even more clearly than before.
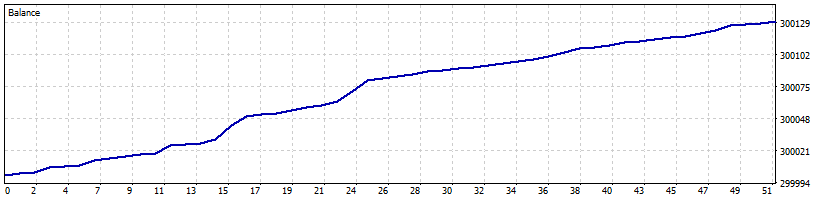
First: the sample is larger, but still covers only a short period. 51 closed positions in a single calendar month is a step up from nine trades and provides a statistically more representative basis for preliminary conclusions. However, this period still covers only one month, rather than a full annual cycle with different market regimes, so it is too early to conclude that the edge is sustainable.
Second: The Profit Factor is undefined because the Gross Loss is zero — not a single losing trade out of 51 positions. This is a direct consequence of the exit mechanics: positions are still closed only upon reaching a fixed target of 1 USD (the target in this run has been lowered from 2 to 1 USD), and there is still no protective stop. A position that moves against the system is not forcibly closed — it simply remains open until the price reverses in the desired direction or the test ends. The formal result of "0% losing trades" is not proof of an edge, but rather a design feature: in such a system, losses are almost never realized; they are simply deferred.
Third: The range of holding times has increased sharply, indicating a hidden risk. The minimum holding time is 40 seconds, but the maximum is 84 hours (about 3.5 days), with a mean of 5 hours and 48 minutes. This means that some positions are held through prolonged drawdowns while waiting for a 1 USD profit. An equity drawdown of 89.20 USD looks tiny relative to a deposit of 300,000 USD (0.03%), but this reflects an artificially large deposit and a small position size of 0.1 lots, not the strategy’s actual robustness: with a deposit comparable to that of a real trading account, the same trade held through a drawdown for 3.5 days would produce a much larger percentage drawdown. The Recovery Factor of 1.46 and the Sharpe Ratio of 3.94 should also be interpreted with this caveat in mind: they are calculated based on an equity curve that, technically, has never recorded a loss, which means both metrics are overstated compared to what an account with a forced stop would actually see.
Before treating the result as confirmation of the idea, the same three gaps as before should be addressed, taking the new figures into account:
- Extend the period and add a walk-forward test. One month and 51 trades represent a significant step forward compared to nine trades, but are still not enough to draw a definitive conclusion. We need a run covering at least 1–2 years of historical data, split 70/30 between training and out-of-sample testing, as described in the section on validation.
- Add a protective stop or a limit on holding time. Closing positions only at a 1 USD profit target without any risk limit is a dangerous setup for live trading, and holding times of up to 84 hours directly confirm this: a losing trade has no defined limit in either monetary or time terms. Even a fixed stop-loss or a time stop after N bars will make the test more realistic and safer.
- Check the stability of the rules during retraining. In this run, InpRetrainRulesBars=20 — the rule statistics are recalculated significantly more often than in the first version, where the parameter was set to 250. It is worth comparing how much the set of “good” rules changes between these frequent retraining runs — if it fluctuates wildly, the apparent edge most likely reflects noise rather than a stable pattern.
The result of this run is as follows: from a technical standpoint, the Expert Advisor works as intended — it compiles, trades, keeps track of statistics, and closes positions according to the specified logic — and the sample size has increased from nine trades to around fifty. But zero losing trades out of 51 in the absence of a protective stop is not evidence of an edge; it is a direct consequence of the exit mechanics. Before moving on to a live account — or even a demo account with real money — a longer backtest with enforced risk controls and out-of-sample testing is needed; otherwise, there is a risk of mistaking a statistical artifact of the system’s design for a working system.
Pitfalls
Rare rules. The most dangerous trap is a rule that was rarely encountered but yielded impressive statistics. A minimum rule support requirement is essential. With limited historical data, it is better to use fewer events and shorter rules.
Market regime change. A rule may have worked well in a trending market but stop working in a sideways market. Therefore, the statistics need to be recalculated periodically using a sliding window. Old data is not always useful.
Too many parameters. If you optimize the RSI thresholds, ATR threshold, time horizon, minimum price movement, rule length, and threshold all at the same time, you can easily overfit the system to the backtest results. Keep the number of parameters small and validate the system on held-out historical data.
Confusing probability with profit. The probability of a price move in a given direction is not the same as profitability. A rule may predict the direction correctly more often, yet yield a small average profit and occasional large losses. Therefore, after probabilistic validation, it is essential to review the trading statistics: profit factor, maximum drawdown, expected payoff, average profit, average loss, and winning and losing streaks.
Look-ahead bias. All events must be calculated using only data from the bar at shift and earlier bars. A label may use future data only during training on historical data. When processing the live bar, only the last closed bar (shift=1) is used.
Possible Extensions
Weighted rule voting. Instead of choosing a single best rule, you can select several suitable rules and average their votes based on weights for support, lift, and recency.
Separate rules for BUY and SELL setups. Instead of simply counting FUTURE_UP/FUTURE_DOWN, you can evaluate the success of a specific trading scenario: whether the TP was reached before the SL or not. This is closer to real trading than simply assessing price direction after N bars.
Rule recency. Older observations can be given less weight. The system will then adapt more quickly to regime changes, but will become more sensitive to noise.
An ensemble with an MLP. Association rules can be combined with a neural network: the MLP provides a continuous estimate of direction, while the rules provide interpretable statistical confirmation. If both filters agree, the entry is stronger. If they disagree, you can reduce the lot size or skip the trade.
A separate table of rules for each session. This is especially useful for Forex. The Asian, European, and American trading sessions often behave differently. Instead of a single shared set of rules, you can maintain separate counters for each session.
Conclusion
We transformed the idea of “the market as a series of recurring states” into a practical MQL5 module: discretizing features into events, encoding them with a bit mask, collecting combination frequencies, and linking them to a label indicating future price movement. Important safeguards are built in by default: minimum support, Laplace smoothing, and comparison with the base probability. The reader gets ready-to-use interfaces: TrainRules collects statistics over a window of historical data; GetRuleConfidence evaluates the current mask in terms of edge/confidence; and RulesAccept(dir) serves as the final gate for BUY/SELL. Mandatory practices prior to live trading: dividing the historical data by time (70/30 training/validation), prohibiting bar shuffling, testing with real risk limits (fixed stop-losses or time stops), and extended backtesting across various market conditions.
Remember: rules are not a signal generator, but a confirmation filter; the criterion for readiness is stable rules with sufficient support and a consistent edge in validation. In short: formalize events and labels → calculate statistics and safeguard estimates → obtain the confidence estimate for the current bar → apply RulesAccept(dir).
| File name | File description |
|---|---|
| GridSurvivor_AssociationRules.mq5 | An Expert Advisor or filter using association rules and probabilistic direction estimation based on Forex historical data |
Translated from Russian by MetaQuotes Ltd.
Original article: https://www.mql5.com/ru/articles/23324
Warning: All rights to these materials are reserved by MetaQuotes Ltd. Copying or reprinting of these materials in whole or in part is prohibited.
This article was written by a user of the site and reflects their personal views. MetaQuotes Ltd is not responsible for the accuracy of the information presented, nor for any consequences resulting from the use of the solutions, strategies or recommendations described.