Creating Three-Dimensional Bars in MQL5
 53
 0

Introduction
About a year ago, in the article “Creating 3D Bars Based on Time, Price, and Volume”, I built a three-dimensional representation of the market using Python. The MetaTrader 5 and Plotly integration exported quotes, calculated the volume profile, and rendered an interactive scene. Time, price, and volume were plotted along its three axes. The approach worked and yielded some interesting observations — those same yellow volume–volatility clusters before reversals. But there was a catch: the scene existed outside the terminal. It required a Python bridge, historical data exports, and a separate process, and the result opened in a browser as a static snapshot, disconnected from the live chart.
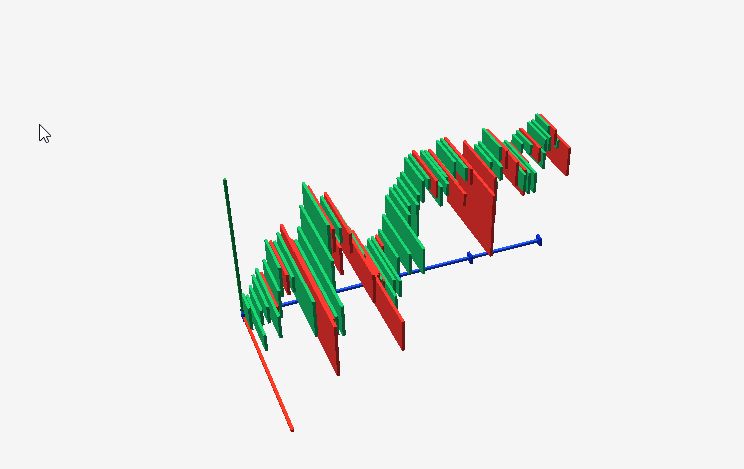
In this article, we bring the concept back into MetaTrader 5. The scene is built using CCanvas3D and DirectX 11, with no external dependencies. It sits over the chart, can be rotated with the mouse and zoomed with the scroll wheel, and is rebuilt using the latest historical data at the click of a button. No Python, no Plotly, no browser — just the platform's built-in tools.
In this article, we port the basic axes of 3D bars — time, price, and volume — and examine their implementation in detail. Price is plotted vertically, time extends into the depth of the scene, and the third horizontal axis is reserved for tick volume. The bar is no longer a candle but becomes a rectangular prism: its height is the High-Low range, its length along the third axis is the bar's volume, and its color indicates the direction. We will discuss the volatility axis and its relationship to reversal clusters from the Python version in the next article.
This article systematically examines:
- What is ported from the Python version to native MQL5, and why
- DirectX scene in MQL5: the CCanvas3D class, initialization, projection, and lighting
- Manual geometry construction: vertex, face, rectangular prism
- Loading historical data and normalizing price, volume, and time into scene coordinates
- Orbital camera, mouse control, and rendering loop
- How to interpret the tick volume scene and develop it further
What We Port from Python to Native MQL5
In the Python version, each 3D bar was an object that built a volume profile from ticks, calculated momentum and volatility, and was then normalized to a common scale. Plotly plotted the data points along three axes: chronological bar index, volume, and price. The scene looked rich but static — it was an HTML file that opened separately from the terminal and did not update in real time with the market.
Conceptually, we are keeping the same three-axis layout, but we are changing everything under the hood. Instead of loading the data into pandas, we call CopyRates directly. Instead of MinMaxScaler, we use manual normalization to scene coordinates. Instead of Plotly points, we use actual three-dimensional solids built from vertices and triangles. And most importantly: instead of a static image in the browser, you get a dynamic, interactive scene right on the chart that you can rotate and rebuild in real time.
The axis mapping is almost one-to-one. Whereas in Python the bar number ran horizontally, here the time axis, Z, extends into the depth of the scene. Whereas in Plotly volume was plotted along one axis, here it becomes the bar's length along the X-axis. In both cases, price is plotted vertically. The difference is that these are no longer scattered points, but a solid wall of bars with a visible shape and contours.
DirectX scene in MQL5: The CCanvas3D Class
The program is an Expert Advisor, not an indicator. This provides full control over the mouse, the timer, and graphical objects. CCanvas3D is created once and used throughout the program's lifetime. The Expert Advisor does not trade here — it draws, using the DirectX canvas as a drawing surface rather than a source of signals.
All 3D functionality is enabled by three header files included in the terminal's standard installation. The entire scene uses a single CDXMesh mesh: the axes and all the bars form one combined geometry stored in shared vertex and index arrays. This is critical for performance — one mesh means one draw call to the GPU.
//--- Three headers provide all of the terminal's 3D functionality
#include <Canvas\Canvas3D.mqh>
#include <Canvas\DX\DXMath.mqh>
#include <Canvas\DX\DXMesh.mqh>

input int InpBarsToShow = 80;   // Number of market bars in a 3D scene

CCanvas3D canvas;   // a canvas with a hardware DirectX context
CDXMesh   mesh;     // a single mesh for the entire scene: both the axes and all the bars
Initializing a 3D Scene
The entire configuration of the 3D context fits into just a few lines of the OnInit function. The canvas is created as a fixed-size bitmap chart object, after which a perspective projection and lighting parameters are specified. Without lighting, the faces of the rectangular prism would be filled with a single flat color, and the cube would appear as a silhouette — it is the directional light, in combination with the face normals, that creates the sense of volume.
//+------------------------------------------------------------------+
//| Expert initialization                                            |
//+------------------------------------------------------------------+
int OnInit()
  {
   //--- Enable mouse and mouse wheel events for camera control
   ChartSetInteger(0, CHART_EVENT_MOUSE_MOVE, 1);
   ChartSetInteger(0, CHART_EVENT_MOUSE_WHEEL, 1);
   EventSetMillisecondTimer(250);   // timer for deferred scene rebuild

   //--- Create a DirectX canvas as a bitmap chart object
   if(!canvas.CreateBitmapLabel("DX_3D_Bars", 20, 20, CANVAS_WIDTH, CANVAS_HEIGHT, COLOR_FORMAT_ARGB_NORMALIZE))
     {
      Print("Canvas create error: ", GetLastError());
      return(INIT_FAILED);
     }

   //--- perspective: 30° field of view, canvas aspect ratio, near/far planes
   canvas.ProjectionMatrixSet((float)DX_PI / 6, (float)CANVAS_WIDTH / (float)CANVAS_HEIGHT, 0.1f, 80.0f);

   //--- Warm directional light adds depth to the faces, while cool fill lighting softens the shadows
   canvas.LightColorSet(DXColor(1.0f, 0.96f, 0.86f, 1.0f));
   canvas.LightDirectionSet(DXVector3(0.45f, -0.85f, 0.35f));
   canvas.AmbientColorSet(DXColor(0.46f, 0.48f, 0.52f, 1.0f));

   CreateUi();          // a flat interface on top of the canvas
   BuildMarketBars();   // initial assembly of the scene geometry
   UpdateCamera();
   RedrawScene();
   return(INIT_SUCCEEDED);
  }
The DX_PI/6 field of view is 30 degrees — a narrow enough cone to keep perspective distortion from making distant bars look misshapen. The near clipping plane is set to 0.1, and the far clipping plane to 80 — our entire scene fits within this depth range. The directional light has a warm color, while the ambient light is a neutral, cool tone: the illuminated faces are slightly golden, while the shaded faces take on a gray-blue tone, giving the cube a three-dimensional appearance.
Scene Coordinate System
Before placing the bars, the coordinate system is established. It is defined by a set of constants: the origin (ORIGIN) and the lengths of the three axes. The scene is located in a cubic space ranging from approximately −3 to +6 units, centered in front of the camera. The time axis is the longest because dozens of bars are lined up along it, and they need enough space to remain distinct.
//--- Scene origin in DirectX units
const float ORIGIN_X = -3.2f;
const float ORIGIN_Y = -3.0f;
const float ORIGIN_Z = -6.2f;

//--- The lengths of the three axes of the scene
const float VOLUME_AXIS_LENGTH = 6.4f;    // X axis — tick volume
const float PRICE_AXIS_LENGTH  = 6.0f;    // Y axis — price (High–Low)
const float TIME_AXIS_LENGTH   = 12.4f;   // Z axis — time, the longest axis
Geometry: Vertex, Face, Rectangular Prism
In the Python version, the bar was a point in Plotly space — the library was responsible for rendering it. There is no library here, so we construct the bar's geometry ourselves. DirectX does not recognize the concept of a "rectangular prism"; it only recognizes triangles defined by vertices and indices. Therefore, the geometry is built from the bottom up: vertex → face → box. A vertex is represented by the DXVertex structure; four of its fields are important to us — position, normal (the direction the surface “faces,” which is needed for lighting), color, and texture coordinates.
//+------------------------------------------------------------------+
//| Fill vertex                                                      |
//+------------------------------------------------------------------+
void SetVertex(DXVertex &vertex, const float x, const float y, const float z,
               const float nx, const float ny, const float nz, const DXColor &clr,
               const float u, const float v)
  {
   vertex.position = DXVector4(x, y, z, 1.0f);    // the position of the vertex in scene space
   vertex.vcolor   = clr;                         // vertex color (green/red bar)
   vertex.normal   = DXVector4(nx, ny, nz, 0.0f); // face normal for lighting calculations
   vertex.tcoord   = DXVector2(u, v);             // texture coordinates; we do not use a texture
  }
One square face consists of four vertices and two triangles. All four vertices of the face share a single normal because the planar quadrilateral faces in one direction. The indices describe how to form two triangles — 0-1-2 and 0-2-3 — from four vertices.
//+------------------------------------------------------------------+
//| Add one quad face                                                |
//+------------------------------------------------------------------+
void AddFace(DXVertex &vertices[], uint &indices[], int &vertex_count, int &index_count,
             const float x0, const float y0, const float z0,
             const float x1, const float y1, const float z1,
             const float x2, const float y2, const float z2,
             const float x3, const float y3, const float z3,
             const float nx, const float ny, const float nz, const DXColor &clr)
  {
   int base = vertex_count;
   ArrayResize(vertices, vertex_count + 4);   // four new vertices per face
   ArrayResize(indices,  index_count  + 6);   // six indices = two triangles

   //--- the four corners of a face with a common normal
   SetVertex(vertices[base],   x0, y0, z0, nx, ny, nz, clr, 0.0f, 0.0f);
   SetVertex(vertices[base + 1], x1, y1, z1, nx, ny, nz, clr, 1.0f, 0.0f);
   SetVertex(vertices[base + 2], x2, y2, z2, nx, ny, nz, clr, 1.0f, 1.0f);
   SetVertex(vertices[base + 3], x3, y3, z3, nx, ny, nz, clr, 0.0f, 1.0f);

   //--- two triangles per square: 0-1-2 and 0-2-3
   indices[index_count++] = (uint)base;
   indices[index_count++] = (uint)(base + 1);
   indices[index_count++] = (uint)(base + 2);
   indices[index_count++] = (uint)base;
   indices[index_count++] = (uint)(base + 2);
   indices[index_count++] = (uint)(base + 3);
   vertex_count += 4;
  }
The box created by AddBox consists of six faces. The function takes two opposite corners of a rectangular prism and constructs its front, back, right, left, top, and bottom faces. Each face has its own normal: the front faces +Z, the back faces −Z, and so on. Sorting the coordinates using MathMin/MathMax at the beginning ensures that the corners can be passed in either order.
//+------------------------------------------------------------------+
//| Add a rectangular prism                                          |
//+------------------------------------------------------------------+
void AddBox(DXVertex &vertices[], uint &indices[], int &vertex_count, int &index_count,
           const float x0, const float x1, const float y0, const float y1, const float z0, const float z1,
           const DXColor &clr)
  {
   //--- sort the corners so that the argument order does not matter
   float xa = MathMin(x0, x1); float xb = MathMax(x0, x1);
   float ya = MathMin(y0, y1); float yb = MathMax(y0, y1);
   float za = MathMin(z0, z1); float zb = MathMax(z0, z1);

   //--- the six faces of a cube, each with its own normal vector
   AddFace(vertices, indices, vertex_count, index_count, xa,ya,zb, xb,ya,zb, xb,yb,zb, xa,yb,zb,  0,0, 1, clr); // front
   AddFace(vertices, indices, vertex_count, index_count, xb,ya,za, xa,ya,za, xa,yb,za, xb,yb,za,  0,0,-1, clr); // rear
   AddFace(vertices, indices, vertex_count, index_count, xb,ya,zb, xb,ya,za, xb,yb,za, xb,yb,zb,  1,0, 0, clr); // right
   AddFace(vertices, indices, vertex_count, index_count, xa,ya,za, xa,ya,zb, xa,yb,zb, xa,yb,za, -1,0, 0, clr); // left
   AddFace(vertices, indices, vertex_count, index_count, xa,yb,zb, xb,yb,zb, xb,yb,za, xa,yb,za,  0,1, 0, clr); // top
   AddFace(vertices, indices, vertex_count, index_count, xa,ya,za, xb,ya,za, xb,ya,zb, xa,ya,zb,  0,-1,0, clr); // bottom
  }
These three functions — SetVertex, AddFace, and AddBox — make up the entire geometry builder. Everything in the scene ultimately boils down to calls to AddBox: the axes, the time tick marks, and each bar.
Axes and Time Tick Marks
Axes are drawn as thin, long boxes. The red axis extends along X (volume), the green axis along Y (price), and the blue axis along Z (time). Five cube-shaped tick marks are also placed along the blue axis — visual anchors for the interface’s five timestamps.
//+------------------------------------------------------------------+
//| Add colored axes and time ticks                                  |
//+------------------------------------------------------------------+
void AddAxes(DXVertex &vertices[], uint &indices[], int &vertex_count, int &index_count)
  {
   //--- the red volume axis along the X-axis
   AddBox(vertices, indices, vertex_count, index_count,
          ORIGIN_X, ORIGIN_X + VOLUME_AXIS_LENGTH,
          ORIGIN_Y - AXIS_THICKNESS, ORIGIN_Y + AXIS_THICKNESS,
          ORIGIN_Z - AXIS_THICKNESS, ORIGIN_Z + AXIS_THICKNESS,
          DXColor(0.90f, 0.18f, 0.12f, 1.0f));

   //--- the green price axis along the Y-axis and the blue time axis along the Z-axis are built in the same way
   //--- ...

   //--- five cube-shaped time tick marks along the time axis as anchors for dates
   for(int i = 0; i < 5; i++)
     {
      float z = ORIGIN_Z + TIME_AXIS_LENGTH * (float)i / 4.0f;
      AddBox(vertices, indices, vertex_count, index_count,
             ORIGIN_X - 0.18f, ORIGIN_X + 0.18f,
             ORIGIN_Y - 0.18f, ORIGIN_Y + 0.18f,
             z - AXIS_THICKNESS, z + AXIS_THICKNESS,
             DXColor(0.05f, 0.16f, 0.72f, 1.0f));
     }
  }
Loading Historical Data and Normalization
The heart of the program is BuildMarketBars(). This is a native equivalent of the Python pipeline with copy_rates and MinMaxScaler. This function copies the historical data, identifies data boundaries, and converts prices, volumes, and time into scene coordinates. Here, however, normalization is manual and transparent: market values of any scale are compressed into a fixed cube. The number of bars is strictly limited to the range of 10–250 to ensure that the scene isn't empty and the geometry doesn't grow out of control.
//+------------------------------------------------------------------+
//| Build 3D bars from chart history                                 |
//+------------------------------------------------------------------+
void BuildMarketBars()
  {
   MqlRates rates[];
   int bars_to_copy = MathMax(10, MathMin(InpBarsToShow, 250));   // Clamp the number of bars to a safe range
   int copied = CopyRates(_Symbol, _Period, 0, bars_to_copy, rates);
   if(copied <= 0)
     {
      Print("CopyRates error: ", GetLastError());
      return;
     }

   //--- Data bounds in a single pass: price range and maximum volume
   double min_price = DBL_MAX, max_price = -DBL_MAX;
   long   max_volume = 1;
   for(int i = 0; i < copied; i++)
     {
      min_price  = MathMin(min_price, rates[i].low);
      max_price  = MathMax(max_price, rates[i].high);
      max_volume = (long)MathMax((double)max_volume, (double)rates[i].tick_volume);
     }

   double price_range = max_price - min_price;
   if(price_range <= 0.0)
      price_range = _Point;   // Protection against division by zero when historical data is flat

   //--- Array sort order: always arrange bars from oldest to newest
   bool time_ascending = (rates[0].time <= rates[copied - 1].time);
   UpdateTimeLabels(rates, copied, time_ascending);
   //--- ... followed by the main loop for constructing bars
  }
The time_ascending flag is important: depending on the settings, CopyRates may return bars either from oldest to newest or vice versa. The direction is determined once, and from then on, the bars are always arranged along the Z-axis strictly from oldest to newest.
The main loop converts each bar into a box. The Z-position is the bar's sequential index on the time axis. The lower and upper Y-coordinates are the normalized low and high values. Length along the X-axis is the tick volume divided by the maximum volume in the sample. The color is green for a bullish bar and red for a bearish bar.
//--- the width of the time slot and the depth of a single bar along the Z-axis
float slot  = TIME_AXIS_LENGTH / (float)copied;
float depth = MathMax(0.045f, slot * 0.70f);

for(int i = 0; i < copied; i++)
  {
   //--- Select the source bar based on the array's chronological order
   int source_index = (time_ascending ? i : copied - 1 - i);
   MqlRates rate = rates[source_index];

   //--- Z: bar position in time, oldest -> newest
   float z0 = ORIGIN_Z + (float)i * slot + slot * 0.15f;
   float z1 = z0 + depth;

   //--- Y: High-Low range, normalized to scene height
   float y0 = ORIGIN_Y + (float)((rate.low  - min_price) / price_range) * PRICE_AXIS_LENGTH;
   float y1 = ORIGIN_Y + (float)((rate.high - min_price) / price_range) * PRICE_AXIS_LENGTH;
   if(y1 - y0 < 0.035f)
      y1 = y0 + 0.035f;   // The doji remains visible as a thin slice

   //--- X: tick volume, normalized to the length of the volume axis
   float x1 = ORIGIN_X + (float)((double)rate.tick_volume / (double)max_volume) * VOLUME_AXIS_LENGTH;
   if(x1 - ORIGIN_X < 0.06f)
      x1 = ORIGIN_X + 0.06f;   // A bar with zero volume does not disappear completely

   //--- Color based on the bar's direction: bullish green, bearish red
   DXColor bar_color = (rate.close >= rate.open)
                       ? DXColor(0.08f, 0.66f, 0.36f, 1.0f)
                       : DXColor(0.86f, 0.18f, 0.16f, 1.0f);

   AddBox(vertices, indices, vertex_count, index_count, ORIGIN_X, x1, y0, y1, z0, z1, bar_color);
  }
Two safeguards in the loop are worth noting. The condition y1 − y0 < 0.035 ensures that even a doji with a near-zero range remains visible as a thin slice. Similarly, x1 − ORIGIN_X < 0.06 prevents a bar with zero volume from disappearing completely. Without them, there would be gaps in the scene.
[Fig. 1. Tick volume scene viewed at an angle — insert a screenshot of the terminal]
How to Read the Tick Volume Scene
In the DX_3D_Bars_TickVolume.mq5 program, the third axis is tick_volume, normalized to the maximum volume in the sample. The more ticks occur during a bar, the farther its box extends along the red axis. As a result, periods of high market activity visibly protrude forward, while quiet periods hug the price–time plane.
The main advantage of this approach is that the price and the supporting volume are visible at the same time, without having to shift your focus. The green-and-red wall of bars forms a familiar price chart, read by following the shape of its upper edge. But now each bar also protrudes forward in proportion to its volume, and viewed in profile, the scene becomes a relief map of activity over time.
| Camera angle | Visible plane | What it shows |
|---|---|---|
| Side view | Price × Time | A classic price chart, a familiar pattern of price movement |
| Top view | Volume × Time | Activity contours independent of price direction |
| Intermediate | All three axes | Whether volume confirms the price move is visible in the shape |
Momentum moves with confirming volume appear as long green or red wedges extending from the wall. Moves on thin volume — bars that are tall along the price axis but short along the volume axis — are usually false breakouts. What required close inspection of a static Plotly screenshot in the Python version can be read here from the three-dimensional contours with a single camera movement, right on the live chart.
Orbital Camera and Mouse Control
It is precisely this interactivity that sets this scene apart from a static screenshot of the Python version. The camera is implemented as an orbital camera: it always faces the center of the scene, and its position is defined by two angles and a distance — these are classic spherical coordinates.
//+------------------------------------------------------------------+
//| Camera                                                           |
//+------------------------------------------------------------------+
void UpdateCamera()
  {
   //--- the camera's target is the geometric center of the scene
   float target_x = ORIGIN_X + VOLUME_AXIS_LENGTH * 0.45f;
   float target_y = ORIGIN_Y + PRICE_AXIS_LENGTH  * 0.45f;
   float target_z = ORIGIN_Z + TIME_AXIS_LENGTH   * 0.50f;

   //--- position on a sphere of radius cam_dist centered on the target
   float x = target_x + (float)(cam_dist * MathSin(cam_angle_y) * MathCos(cam_angle_x));
   float y = target_y + (float)(cam_dist * MathSin(cam_angle_x));
   float z = target_z + (float)(cam_dist * MathCos(cam_angle_y) * MathCos(cam_angle_x));

   canvas.ViewPositionSet(DXVector3(x, y, z));
   canvas.ViewTargetSet(DXVector3(target_x, target_y, target_z));
   canvas.ViewUpDirectionSet(DXVector3(0.0f, 1.0f, 0.0f));
  }
The cam_angle_y angle controls rotation around the vertical axis (azimuth), cam_angle_x controls elevation (zenith), and cam_dist controls distance. The controls are tied to mouse events: dragging while holding down the left button changes the angles, and scrolling changes the distance. The angles and distance are limited so that the camera cannot flip past a pole or move infinitely far away.
//+------------------------------------------------------------------+
//| Mouse movement                                                   |
//+------------------------------------------------------------------+
void OnMouseMove(int x, int y, uint flags)
  {
   if(prev_mouse_x == -1)
     { prev_mouse_x = x; prev_mouse_y = y; return; }   // First frame: Remember the position

   if((flags & 1) == 1)   // Bit 1 of the flags = left mouse button is pressed
     {
      cam_angle_y += (x - prev_mouse_x) / 300.0f;
      cam_angle_x += (y - prev_mouse_y) / 300.0f;

      //--- Prevent the camera from flipping past a pole
      if(cam_angle_x < -DX_PI_DIV2 * 0.88f) cam_angle_x = -DX_PI_DIV2 * 0.88f;
      if(cam_angle_x >  DX_PI_DIV2 * 0.88f) cam_angle_x =  DX_PI_DIV2 * 0.88f;

      UpdateCamera();
      RedrawScene();
     }
   prev_mouse_x = x; prev_mouse_y = y;
  }

//+------------------------------------------------------------------+
//| Mouse wheel                                                      |
//+------------------------------------------------------------------+
void OnMouseWheel(double delta)
  {
   cam_dist *= 1.0f - (float)delta * 0.001f;
   cam_dist = MathMax(7.0f, MathMin(45.0f, cam_dist));   // Zoom within reasonable limits
   UpdateCamera();
   RedrawScene();
  }
Rendering and Mesh Rebuild
The rendering code is extremely concise. RedrawScene() clears the color and depth buffers, renders the scene, and updates the canvas. Clearing the depth buffer is critical — without it, near and far bars would overlap incorrectly.
//+------------------------------------------------------------------+
//| Render                                                           |
//+------------------------------------------------------------------+
void RedrawScene()
  {
   canvas.Render(DX_CLEAR_COLOR | DX_CLEAR_DEPTH, ColorToARGB(clrWhiteSmoke));
   canvas.Update();
   ChartRedraw();
  }
When the mesh is updated, it is completely rebuilt. The old mesh is unloaded, a new one is created from fresh vertex and index arrays, and it is added to the scene only during the very first build. Using the mesh_initialized flag prevents the object from being duplicated during subsequent rebuilds.
//--- Recreate the mesh from new geometry arrays
if(mesh_initialized)
   mesh.Shutdown();   // Unload the old geometry from the GPU

if(!mesh.Create(canvas.DXDispatcher(), canvas.InputScene(), vertices, indices))
  {
   Print("Mesh create error: ", GetLastError());
   return;
  }
mesh.DiffuseColorSet(DXColor(1.0f, 1.0f, 1.0f, 1.0f));

//--- Add the mesh to the scene only during the first build
if(!mesh_initialized)
  {
   canvas.ObjectAdd(&mesh);
   mesh_initialized = true;
  }
The rebuild is deferred to the timer handler using the need_rebuild flag, rather than performed directly in the click handler. This is a deliberate design choice: you shouldn't run the resource-intensive geometry-reconstruction operation inside OnChartEvent. A click simply sets a flag, and OnTimer picks it up on the next timer tick and performs the task without blocking event handling.
//+------------------------------------------------------------------+
//| Timer                                                            |
//+------------------------------------------------------------------+
void OnTimer()
  {
   if(need_rebuild)
     {
      need_rebuild = false;
      BuildMarketBars();
      RedrawScene();
     }
  }
Timestamps on the Z-axis
To make the blue time axis readable in terms of actual dates rather than abstract values, five labels are overlaid on the canvas at reference points: START, 25%, 50%, 75%, and NOW. The function selects the bar at the corresponding percentage along the axis and uses its actual timestamp to update the label, taking the array’s sort order into account.
//+------------------------------------------------------------------+
//| Update one Z-axis time label                                     |
//+------------------------------------------------------------------+
void UpdateOneTimeLabel(const string name, const MqlRates &rates[], const int copied,
                        const bool time_ascending, const double part, const string prefix)
  {
   //--- bar index at the axis reference point (0, 25, 50, 75, 100%)
   int bar_index = (int)MathRound((copied - 1) * part);
   bar_index = MathMax(0, MathMin(copied - 1, bar_index));

   //--- take the array order into account when selecting the source bar
   int source_index = (time_ascending ? bar_index : copied - 1 - bar_index);
   string text = prefix + TimeToString(rates[source_index].time, TIME_DATE) + " " +
                 TimeToString(rates[source_index].time, TIME_MINUTES);
   ObjectSetString(0, name, OBJPROP_TEXT, text);
  }
This is an example of how the MQL5 flat interface and the 3D canvas work together: the three-dimensional scene provides the shape, while standard OBJ_LABEL objects placed on top of it provide precise date references — something that would be difficult to represent with text in a 3D space.
What Is Next?
We ported the three core 3D bar elements — price, time, and volume — from Python to the native MetaTrader 5 environment and built a full-fledged interactive engine using DirectX. The scene is no longer confined to a static snapshot in the browser: you can rotate it with the mouse, zoom in with the scroll wheel, and rebuild it using the latest historical data right on the chart — without a Python bridge or external libraries.
In the Python version, the most interesting observation was the yellow volume–volatility clusters, which preceded reversals with high accuracy. Volume is just one of the two factors that shaped those clusters; the other is volatility. In the next article, we will replace the metric on the third axis: instead of tick volume, the X-axis will display volatility based on True Range. This will require changing exactly one function in the entire engine — and will yield a second scene that can be compared to this one, bringing us closer to reproducing the cluster effect natively in MQL5.
| File name | File description |
|---|---|
| DX_3D_Bars_TickVolume.mq5 | Visualization Expert Advisor: a three-dimensional price / time / tick volume scene using DirectX |
Translated from Russian by MetaQuotes Ltd.
Original article: https://www.mql5.com/ru/articles/22970
Warning: All rights to these materials are reserved by MetaQuotes Ltd. Copying or reprinting of these materials in whole or in part is prohibited.
This article was written by a user of the site and reflects their personal views. MetaQuotes Ltd is not responsible for the accuracy of the information presented, nor for any consequences resulting from the use of the solutions, strategies or recommendations described.