

A Grid Expert Advisor Based on a Cellular Automaton with Online Learning in MQL5 (Part II): A New Level of Online Adaptation
 119
 2

I already have a CA architecture running with 10,000 cells: the agents vote, generate PnL, change strategies, and continue trading nonstop. However, in practice, two operational bottlenecks have emerged that degrade the system's quality and require an engineering solution directly within the pipeline.
First, the input: 50 features are fed in as a flat vector, where momentum, volatility, RSI, and the Hurst exponent are “unaware” of their interrelationships. As a result, a single indicator spike can easily turn into a false signal.
Second, topology: a lattice with a Moore neighborhood propagates regime changes too slowly, and geometric neighbors are often semantically unrelated. At the same time, strict operational requirements remain in place: the implementation must run in MQL5, without matrices, without computationally intensive learning, and without slowing down OnTick().
In this article, we formalize the problem at the points where the system actually loses quality — in ExtractFeatures() and in the definition of neighbors and voting weights — and propose a practical upgrade that preserves compatibility with the existing Expert Advisor interface.
The market is more like a graph: momentum is linked to volatility, RSI is linked to the position within the Bollinger Bands, volume is linked to breakouts, autocorrelation is linked to the Hurst exponent, and the time of day changes the significance of the same patterns. If the features are related to one another in a nonlinear way, then the cellular automaton must evolve not only on a square grid, but on a graph of market relationships.
In this part, we enhance the architecture without external libraries, without matrices, and without computationally intensive learning. The idea is simple: to represent the input features as a graph, and the cells themselves as a graph of agents. In that case, the system operates as a distributed network. Each cell receives information not only from its geometric neighbors but also from semantic neighbors with the same feature or a similar strategy, as well as through long-range small-world connections.
Purpose of the article:
- show why we should convert features into a graph;
- describe graph-based filtering of 50 market features;
- show how to replace some of the neighbors in a cellular automaton with semantic connections;
- maintain compatibility with MQL5 and the old Expert Advisor interface;
- provide practical criteria for determining when the graph-based version outperforms the standard CA lattice.
Why a Flat Feature Vector Loses Information
In the classic implementation, ExtractFeatures() returns an array:
double feat[CNN_FEATURES]; // 50 features normalized to the range [-1..+1]
This is convenient as a data representation. From the perspective of market structure, however, it is a gross oversimplification. The array does not know that feat[0] is short-term momentum, feat[10] is short-term volatility, feat[16] is RSI14, feat[22] is the price’s position within the Bollinger Bands, and feat[36] is fractal time-series memory. For an array, these are simply adjacent or non-adjacent memory cells.
The problem arises when the model interprets a feature in isolation. For example, high momentum could mean:
- trend continuation if volatility is moderate and the Hurst exponent is greater than 0.5;
- a spurious spike if volatility is extreme and volume does not confirm the move;
- a reversal zone if the price is near the upper Bollinger Band and the RSI is overbought;
- a transitional regime if the autocorrelation changes sign.
In other words, a feature becomes informative only in the context of other features. Therefore, the second version of the architecture adds a layer of graph-based feature diffusion: each feature is not mixed with all others at once, but only with predefined semantic neighbors.
Feature Graph: 50 Nodes Instead of 50 Independent Numbers
Let's represent each market feature as a node in a graph:
// Nodes of the feature graph
feat[0.. 4]   = momentum;
feat[5.. 9]   = trend_strength;
feat[10..14]   = volatility;
feat[15..17]   = rsi;
feat[18..20]   = macd;
feat[21..23]   = bollinger_position;
feat[24..26]   = volume;
feat[27..29]   = autocorrelation;
feat[30..32]   = mean_reversion;
feat[33..35]   = price_level;
feat[36..37]   = hurst;
feat[38..44]   = candle_and_acceleration;
feat[45..49]   = cross_and_time;
We now introduce a graph operation: a feature is updated by blending its own value with values from local neighbors and distant nodes linked by small-world connections.
//+------------------------------------------------------------------+
//| Graph diffusion of 50 market features                            |
//+------------------------------------------------------------------+
void ApplyFeatureGraphLayer(double &feat[])
  {
   double old[CNN_FEATURES];
   for(int i=0; i<CNN_FEATURES; i++)
      old[i]=feat[i];
//---
   for(int i=0; i<CNN_FEATURES; i++)
     {
      int l1=(i-1+CNN_FEATURES)%CNN_FEATURES;
      int r1=(i+1)%CNN_FEATURES;
      //--- Long-range connections: small-world hops through feature space
      int sw1=(i*7+13)%CNN_FEATURES;
      int sw2=(i*11+17)%CNN_FEATURES;
      double local_mean=(old[l1]+old[r1])*0.5;
      double sw_mean=(old[sw1]+old[sw2])*0.5;
      //--- 70% original feature, 20% local context, 10% distant resonance
      feat[i]=MathTanh(old[i]*0.70+local_mean*0.20+sw_mean*0.10);
     }
  }
This is not a neural network layer in the traditional sense. There are no trainable matrices here, no backpropagation, and no risk of causing computational complexity to skyrocket. This is a graph filter: it propagates information across the semantic topology of features and makes the input more resistant to noise from a single indicator.
Spectral Interpretation: The Market as a Signal on a Graph
If features are the nodes of a graph, then the entire market snapshot can be understood as a signal on the graph. The current state of the market is not a vector of numbers, but rather a distribution of energy across nodes. Momentum, volatility, volume, RSI, and the Hurst exponent together define the shape of the signal. The graph layer functions as a gentle spectral filter: it suppresses isolated spikes and enhances coherent structures.
Mathematically, this can be written as follows:
f' = tanh( α · f + β · A_local · f + γ · A_smallworld · f )
Where:
| Symbol | Meaning |
|---|---|
| f | initial vector of 50 features |
| A_local | matrix of local connections between similar features |
| A_smallworld | matrix of long-range connections between different groups of features |
| α | weight of the feature itself |
| β | weight of the local context |
| γ | weight of long-range resonance |
In MQL5, we do not create the matrix explicitly. This is important. We implement the same operator using neighbor indices to maintain performance and compatibility with the terminal.
Semantic Connections between Groups of Features
The simplest small-world formula already works, but it is scientifically more robust to define connections based on market logic. For example:
| Group | Semantic connection | Purpose |
|---|---|---|
| Momentum | Volatility, Volume, Hurst | distinguish a trend from noise-driven momentum |
| RSI | Bollinger, Mean Reversion | distinguish overbought or oversold conditions from a strong trend |
| MACD | Momentum, Trend Strength | reinforce coherent trending regimes |
| Autocorrelation | Hurst, Acceleration | capture the transition from randomness to time-series memory |
| Time | Volume, Volatility | account for trading sessions and intraday structure |
Such a graph brings the system closer to the real market: rather than an indicator voting on its own, a group of features forms a local probability field.
Now that we have learned how to filter the input signal using a feature graph, the next logical step is to apply the same philosophy to the topology of the cells themselves. If features are semantically related, then the cells that “read” these features must exchange information not only on a geometric basis but also on a semantic basis.
Cellular Automata Graph: From a Lattice to a Network of Agents
In the first version, each cell had eight Moore neighbors on a toroidal grid. This is elegant and fast, but geometrically arbitrary. Why should a cell with the RSI feature listen to the cell to its left if that cell happens to use a volume-based strategy? In the graph version, we retain some of the spatial connections but add semantic connections.
New neighbor logic:
| Neighbor | Connection type | Meaning |
|---|---|---|
| 0..3 | geometric neighbors | local CA dynamics and spatial inertia |
| 4 | the same feature group | cells that read a similar market signal |
| 5 | the next feature in the graph | the transfer of information between related features |
| 6 | the same strategy | the collective experience of a single trading archetype |
| 7 | small-world chord | long-range resonance and rapid information exchange |
Neighbor initialization is still performed in advance. This is critical: the graph may be semantically complex, but it must not slow down OnTick().
//+------------------------------------------------------------------+
//| Precomputing graph neighbors for all cells                       |
//+------------------------------------------------------------------+
void BuildGraphNeighbors()
  {
   for(int i=0; i<CNN_CELLS; i++)
     {
      int x=i%CNN_GRID_W;
      int y=i/CNN_GRID_W;
      //--- 0..3: local lattice
      m_nb[i*CNN_NEIGHBORS+0]=y*CNN_GRID_W+((x+1)%CNN_GRID_W);
      m_nb[i*CNN_NEIGHBORS+1]=y*CNN_GRID_W+((x-1+CNN_GRID_W)%CNN_GRID_W);
      m_nb[i*CNN_NEIGHBORS+2]=((y+1)%CNN_GRID_H)*CNN_GRID_W+x;
      m_nb[i*CNN_NEIGHBORS+3]=((y-1+CNN_GRID_H)%CNN_GRID_H)*CNN_GRID_W+x;
      //--- 4: a cell with the same feature index
      m_nb[i*CNN_NEIGHBORS+4]=(m_feat_idx[i]*197+i*13)%CNN_CELLS;
      //--- 5: a cell with the next feature
      int next_feat=(m_feat_idx[i]+1)%CNN_FEATURES;
      m_nb[i*CNN_NEIGHBORS+5]=(next_feat*197+i*17)%CNN_CELLS;
      //--- 6: a cell using the same strategy
      m_nb[i*CNN_NEIGHBORS+6]=(m_strategy[i]*997+i*19)%CNN_CELLS;
      //--- 7: a long-range small-world chord
      m_nb[i*CNN_NEIGHBORS+7]=(i*37+101)%CNN_CELLS;
     }
  }
Such a graph connects two worlds: the local physics of a cellular automaton and the global semantic structure of the market. The system retains the ability to form waves, domains, and local consensus, but now these domains can jump across space via semantic bridges.
Why Small-World Topology Is Important for the Market
A conventional lattice propagates information slowly. It takes many CA steps for a signal to travel from one corner of the grid to another. A small-world graph solves this problem: a few long-range connections drastically reduce the average path length between agents. For the trading system, this means that the new market regime spreads more quickly across the network.
In practical terms:
- A volatility breakout affects trend-following cells more quickly;
- The RSI signal reaches mean-reversion cells more quickly;
- A successful strategy spreads its influence to other agents more quickly;
- A faulty local cluster is not permanently isolated because it receives corrective connections from afar.
This is especially important for markets with abrupt transitions: news events, session openings, changes in liquidity, and the transition from a range-bound market during the Asian session to a trend during the European session.
Graph-based Voting Instead of the Usual Average
After the graph evolution, you can enhance the WeightedVote() function. In the standard version, the cell weight depends on capital and PnL. The graph-based version introduces another factor: the cell’s coherence with its graph neighborhood.
//+------------------------------------------------------------------+
//| Cell coherence with its graph environment                        |
//+------------------------------------------------------------------+
double GraphCoherence(int i)
  {
   double s=0.0;
   for(int k=0; k<CNN_NEIGHBORS; k++)
     {
      int j=m_nb[i*CNN_NEIGHBORS+k];
      s+=m_state[i]*m_state[j];
     }
//--- +1 = complete agreement with the graph, -1 = complete disagreement
   return(s/CNN_NEIGHBORS);
  }
Now the cell is assigned the maximum weight not only because it was profitable, but also because its signal is consistent with the market's graph structure:
//+------------------------------------------------------------------+
//| Weighted voting that takes graph coherence into account          |
//+------------------------------------------------------------------+
double WeightedGraphVote()
  {
   double wsum=0.0, wtotal=0.0;
   for(int i=0; i<CNN_CELLS; i++)
     {
      double coh=GraphCoherence(i);
      double graph_bonus=1.0+0.25*MathMax(0.0, coh);
      double w=m_capital[i]*(1.0+MathMax(0.0, m_pnl[i])*0.005)*graph_bonus;
      wsum+=m_state[i]*w;
      wtotal+=w;
     }
   if(wtotal<=0.0)
      return(0.0);
   return(MathTanh((wsum/wtotal+m_bias)*2.0));
  }
This brings the voting process closer to the scientific concept of spectral resonance: a strong signal is not simply a loud signal from a single cell, but a coherent regime of the entire graph.
New Metric: Graph Health
Network Health shows the percentage of profitable cells. However, for graph-based architectures, it is also necessary to measure topological coherence. Introducing Graph Health:
//+------------------------------------------------------------------+
//| Average positive coherence across the entire network             |
//+------------------------------------------------------------------+
double GetGraphHealth()
  {
   double sum=0.0;
   for(int i=0; i<CNN_CELLS; i++)
      sum+=MathMax(0.0, GraphCoherence(i));
   return(sum/CNN_CELLS);
  }
| Graph health | Interpretation | Action |
|---|---|---|
| > 0.45 | The network is coherent; the regime can be identified with confidence. | Confidence can be increased |
| 0.25–0.45 | Normal mixed market | Continue as usual |
| < 0.25 | The graph breaks down into conflicting clusters | Reduce risk and wait for a new structure |
The combination of Network Health and Graph Health is particularly important:
- Network Health is high, Graph Health is high — the best regime: the network is profitable and coherent.
- Network Health is high, Graph Health is low — there is profit, but the structure is unstable.
- Network Health is low, Graph Health is high — a dangerous regime: the network is confidently wrong.
- Network Health is low, Graph Health is low — the market is chaotic; it is best to reduce aggressiveness.
Graph Regime: Identifying the Market Regime Through Topology
The graph-based system allows regimes to be identified not only by price but also by signal shape:
| Regime | Features | CA Behavior |
|---|---|---|
| Trend graph | Momentum + Hurst + Trend Strength are coherent | TREND_S/TREND_M/TREND_L are being amplified |
| Reversal graph | RSI + Bollinger + Mean Reversion oppose momentum | REVERSAL and MEAN_REV are being amplified |
| Noise graph | High volatility, weak autocorrelation | Confidence is reduced, grid_step is increased |
| Session graph | Time + Volume + Volatility are synchronized | The system takes into account the intraday regime |
This is no longer just market classification. This is topological diagnosis: we look at which groups of features have formed a connected cluster and which have broken apart.
How Does This Fit into ExtractFeatures()?
The practical change is minimal. First, ExtractFeatures() calculates the original 50 features, then applies the graph layer once:
//+------------------------------------------------------------------+
//| Calculation of 50 features and application of the graph layer    |
//+------------------------------------------------------------------+
bool ExtractFeatures(string sym, double &feat[])
  {
   ArrayResize(feat, CNN_FEATURES);
   ArrayInitialize(feat, 0.0);
//--- 1. Existing calculation of 50 market features (momentum, trend, volatility, RSI, MACD, Bollinger Bands, volume...)
//--- 2. Normalization to [-1..+1]
   for(int i=0; i<CNN_FEATURES; i++)
      feat[i]=MathTanh(feat[i]);
//--- 3. New graph layer for features
   ApplyFeatureGraphLayer(feat);
   return(true);
  }
In other words, the old system is not rewritten. We are not changing the Expert Advisor's philosophy, but rather the input geometry. The vector becomes a signal on a graph.
How Does This Fit into the CA Step?
There is no need to make anything inside StepCA() more complicated. The average of the neighbors is calculated in the same way, except that the array m_nb now contains not only geometric neighbors but also graph neighbors:
   double nb_mean=0.0;
   double nb_agree=0.0;
   for(int k=0; k<CNN_NEIGHBORS; k++)
     {
      int j=m_nb[i*CNN_NEIGHBORS+k];
      nb_mean+=m_state[j];
      if(m_state[i]*m_state[j]>0.0)
         nb_agree+=1.0;
     }
   nb_mean/=CNN_NEIGHBORS;
   nb_agree/=CNN_NEIGHBORS;
That is precisely why graph-based modernization does not break the old rules R1–R12. They begin to operate in a richer topology.
How Will the Expert Advisor's Behavior Change?
After switching to a graph-based CA architecture, not only does the forecast accuracy change, but so does the nature of the errors.
| Old CA Grid | Graph-Based CA |
|---|---|
| Propagates a new regime more slowly | Transmits the regime more quickly via small-world connections |
| A cell listens to neighbors selected by geometry rather than semantic relevance | A cell listens to its semantic neighbors |
| Features are passed as a flat array | The features are filtered as a signal on the graph |
| Consensus can be local and random. | Consensus is verified via Graph Coherence |
| Diagnostics: Network Health | Diagnostics: Network Health + Graph Health |
The main benefit is a reduction in false signals caused by a single indicator spike. If a single feature changes sharply but its graph neighbors do not confirm the movement, the feature layer dampens the spike. If, however, several related groups of features change simultaneously, the graph layer reinforces the structure.
Practical Thresholds for the Graph Version
| Metric | Normal | Alarm | What to Do |
|---|---|---|---|
| Network health | > 60% | < 40% | reduce risk, wait for restructuring |
| Graph health | > 0.25 | < 0.20 | do not increase confidence; increase grid_step |
| Graph coherence | 0.25–0.55 | < 0.10 or > 0.80 | low value = chaos; excessively high value = herding risk |
| Feature graph energy | stable | a sharp spike | a news-driven regime is possible |
| BPC precision | > 58% | < 52% | reduce the weight of BPC in the blend |
Why This Can Be Considered a Scientific Approach
Scientific rigor here does not lie in grandiloquent language or in an attempt to reduce the market to a universal formula. The scientific rigor lies in the architecture's shift from flat heuristics to a formal structure:
- features become graph nodes;
- connections between features define the information propagation operator;
- cells become agents on the graph;
- the neighborhood structure is no longer merely an arbitrary geometry;
- the quality of the system is measured not only by profit but also by topological metrics;
- Adaptation becomes an observable process.
The approach is similar to the concepts of graph neural networks, spectral filtering, and multi-agent dynamics, but is implemented entirely in MQL5. No external infrastructure (PyTorch, CUDA, DLLs, Python server) is required. All the logic is contained within the Expert Advisor.
Minimal Interface of the New Version
On the outside, the system remains the same:
#include <Cellular10K\CellularNeuralNet10K.mqh>
#include <Cellular10K\CellularBinaryPredictor10K.mqh>

CCellularNeuralNet10K g_ca;
CBinaryPredictor10K   g_bpc;
//+------------------------------------------------------------------+
//| Expert initialization function                                   |
//+------------------------------------------------------------------+
int OnInit()
  {
   g_ca.Initialize();
   g_bpc.Initialize();
   return(INIT_SUCCEEDED);
  }
//+------------------------------------------------------------------+
//| Expert tick function                                             |
//+------------------------------------------------------------------+
void OnTick()
  {
   if(IsNewBar())
     {
      double vote=g_ca.PredictNextMove(_Symbol);
      g_bpc.OnNewBar(_Symbol);
      //--- standard trading logic follows
     }
  }
The change is within the engine, not in the Expert Advisor. This is an important engineering principle: architectural enhancement should not force a trader to rewrite their trading system from scratch.
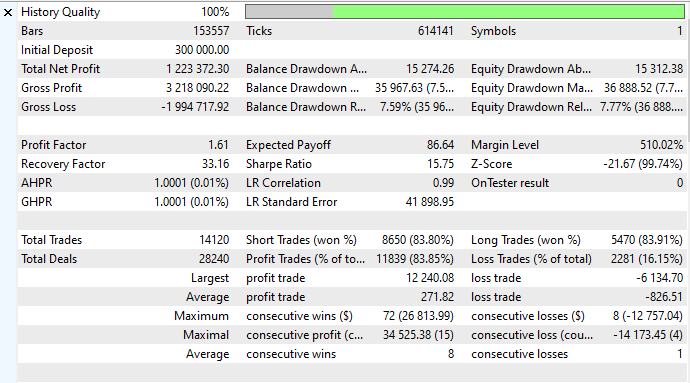
The results presented here were achieved precisely because of the changes described above: graph-based feature filtering reduced the number of false entries caused by indicator spikes, while small-world connections in the cell topology accelerated adaptation to changes in the market regime. The combination of the Network Health and Graph Health metrics allows you to monitor when the system is in a stable state and when it is at risk of herding.
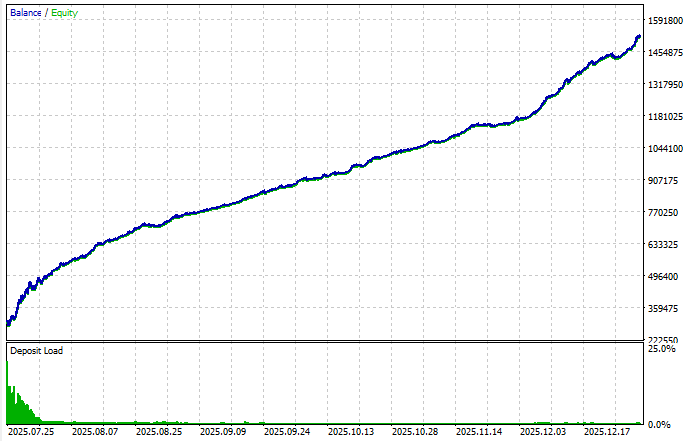
Without any initial configuration, the system — with a check for a new bar — achieves a Sharpe ratio above 15:
Result: CA Becomes the Market's Graph-based Nervous System
In the first part, the cellular automaton solved the main problem of fixed weights: it allowed the parameters to evolve directly during trading. In the second part, we removed the next limitation: the flat representation of features and the restriction of cells to a regular grid.
We converted the two key bottlenecks in the CA system into working graph-based structures, implementing the changes in practice rather than merely proposing them conceptually. What exactly has been implemented and where to apply the changes:
- ApplyFeatureGraphLayer() — this lightweight graph diffusion step is called at the end of ExtractFeatures(), converting 50 numbers into a signal on the graph and suppressing isolated outliers;
- BuildGraphNeighbors() — precomputation of neighbors: 4 local + 4 semantic (same feature group, next feature, same strategy, small-world chord);
- GraphCoherence() and WeightedGraphVote() — voting with a bonus for coherence with the graph neighborhood;
- GetGraphHealth() is a new diagnostic metric that complements Network Health and provides real-time decision thresholds.
Practical effects: fewer false signals from isolated indicator spikes; faster propagation of a new regime through small-world connections; formal criteria (Network Health + Graph Health) for increasing or decreasing confidence and managing risk. From an engineering standpoint, all of this is built into the engine (the OnInit/OnTick interface remains the same), without external libraries and without backpropagation.
The next step is to make the graph's connections adaptive: strengthen the edges when they generate profit together, and weaken them when they lead to errors. This will transform the current implementation into an evolutionary graph neural network within MetaTrader 5, while preserving the fundamental simplicity and measurability of the approach.
| Component | What was included in Part 1 | What's new in Part 2 |
|---|---|---|
| Features | 50 normalized numbers | A feature graph with local and small-world connections |
| Cells | 100×100 toroidal CA lattice | Agent graph: geometry + feature + strategy + long-range chord |
| Neighbors | 8 Moore neighbors | 4 local neighbors + 4 semantic neighbors |
| Voting | Weight based on capital and PnL | Weight based on capital, PnL, and Graph Coherence |
| Diagnostics | Hit Rate, Network Health, BPC Precision | Graph Health and Graph Coherence have been added |
Translated from Russian by MetaQuotes Ltd.
Original article: https://www.mql5.com/ru/articles/23134
Warning: All rights to these materials are reserved by MetaQuotes Ltd. Copying or reprinting of these materials in whole or in part is prohibited.
This article was written by a user of the site and reflects their personal views. MetaQuotes Ltd is not responsible for the accuracy of the information presented, nor for any consequences resulting from the use of the solutions, strategies or recommendations described.



An initial deposit of 300k and an initial margin requirement of 25 per cent. That says it all )))