

Pesaran–Timmermann Test in MQL5: Separating Real Directional Skill from a Lucky Hit Rate
 150
 0

Contents
- Introduction
- Why a hit rate needs a baseline
- The test in code
- Three forecasters
- Scoring forecasts without look-ahead
- What the self-test covers
- The gated Expert Advisor
- The rolling indicator
- Strategy Tester results
- Limitations
- Conclusion
Introduction
Say a forecaster gets 58% of next-bar directions right. Is that good? You can't tell until you know how often price went up and how often the forecaster said "up". If the market rose on 60% of bars and the model said "up" 90% of the time, 58% is exactly what a model with no information would score. Pesaran and Timmermann (1992) turned that comparison into a proper test.
Here I implement the test in plain MQL5 and use it as a gate. The EA trades a one-bar direction forecast only when the right-tail p-value of the latest rolling window is below α. That is a screening rule, not proof of skill, and a coin flip runs through the same gate because I wanted to see how often pure noise gets through.
Why a hit rate needs a baseline
Every bar gives one pair: the forecast x_t (up or down) made at the close of bar t, and the outcome y_{t+1}, the sign of the next close-to-close change. Over n pairs, P is the share of correct calls, P_x the share of "up" forecasts and P_y the share of up bars. If forecasts and outcomes had nothing to do with each other, we would expect a hit rate of
P* = P_y·P_x + (1 − P_y)(1 − P_x)
The test measures how far P sits above P*, scaled by the difference of two variances:
Var(P) = P*(1 − P*)/n
Var(P*) = (2P_y − 1)²·P_x(1 − P_x)/n + (2P_x − 1)²·P_y(1 − P_y)/n + 4·P_y·P_x(1 − P_y)(1 − P_x)/n²
PT = (P − P*) / √(Var(P) − Var(P*))
With no information in the forecast, PT is roughly standard normal. We are looking for skill, so the test is one-sided in the right tail with p-value 1 − Φ(PT). A large negative PT says the forecaster points the wrong way, and that claim needs its own left-tail p-value, Φ(PT).
That baseline isn't stuck at 50%, as Fig. 1 shows for the EMA forecaster on EURUSD M15.
Rolling hit rate against the chance hit rate P*
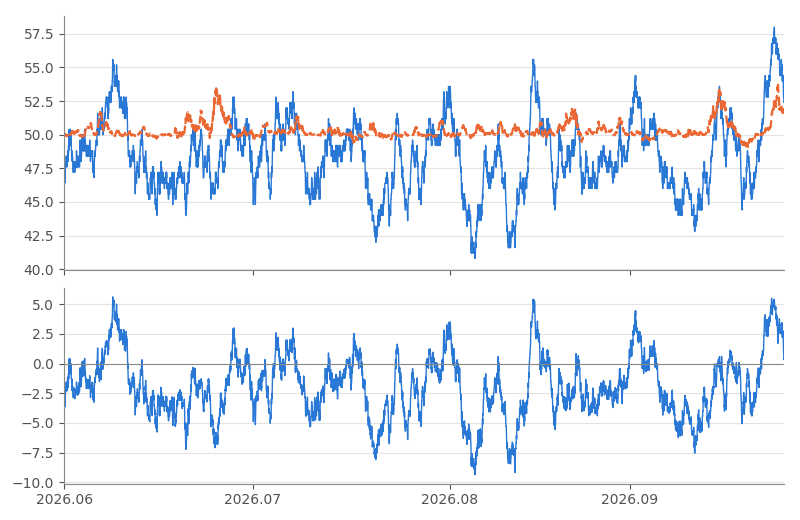
1. EURUSD M15, EMA-slope forecaster, last 250 scored pairs, from the EA log. Top: hit rate P (solid blue) and P* (dashed orange), in percent. Bottom: P − P* in points, zero in gray.
The hit rate swung between 40.8% and 58.0% and was above 50% on 23.7% of bars, while P* drifted between 49.1% and 53.9%. On 241 bars the forecaster beat 50% and still fell short of P*. At 2026.09.15 09:15 it read 53.2% against a baseline of 53.3%. The bottom panel, the numerator of PT, is above zero on only 22.1% of bars.
One assumption matters here: under the null, pairs are independent from bar to bar. The data only approximately satisfy this. The EMA forecast keeps its sign for 6.8 to 8.0 bars on average (lag-1 autocorrelation 0.71 to 0.75), while outcome signs lean slightly the other way (−0.050 to −0.006). I also apply the normal approximation to 250-pair windows. The results check how much either point matters.
The test in code
PTFromCounts() takes the four cells of the 2×2 table, forecast against outcome. Keep the formulas above in view while you read it, because the inline comments follow them line by line:
//+------------------------------------------------------------------+
//| Pesaran-Timmermann (1992) test from the four 2x2 cell counts.    |
//| uu/ud/du/dd: first letter is the forecast, second the outcome.   |
//| Returns true only when the statistic is defined.                 |
//+------------------------------------------------------------------+
bool PTFromCounts(const int uu,const int ud,const int du,const int dd,
                  SPTResult &res)
  {
   PTResetResult(res);  // start from an invalid result
   int n=uu+ud+du+dd;   // scored pairs
   res.n=n;
   if(n<PT_MIN_SAMPLE)
      return(false);    // status stays too_few
//--- marginal frequencies and the observed hit rate
   double nn=(double)n;
   res.hits=uu+dd;         // forecast and outcome agree
   res.P   =res.hits/nn;   // observed hit rate
   res.Py  =(uu+du)/nn;    // share of up outcomes
   res.Px  =(uu+ud)/nn;    // share of up forecasts
//--- a one-sided forecaster or market leaves nothing to test
   if(res.Px<=0.0 || res.Px>=1.0)
     {
      res.status=PT_STATUS_NO_FORECAST_VAR;  // always up or always down
      return(false);
     }
   if(res.Py<=0.0 || res.Py>=1.0)
     {
      res.status=PT_STATUS_NO_OUTCOME_VAR;   // market moved one way only
      return(false);
     }
//--- hit rate expected if forecasts and outcomes were independent
   double py=res.Py;
   double px=res.Px;
   res.Pstar    =py*px+(1.0-py)*(1.0-px);       // hit rate by chance
   res.var_p    =res.Pstar*(1.0-res.Pstar)/nn;  // Var(P) under H0
   res.var_pstar=(2.0*py-1.0)*(2.0*py-1.0)*px*(1.0-px)/nn+
                 (2.0*px-1.0)*(2.0*px-1.0)*py*(1.0-py)/nn+
                 4.0*py*px*(1.0-py)*(1.0-px)/(nn*nn);
   double denom=res.var_p-res.var_pstar;        // variance of P - P*
   if(denom<=0.0)
     {
      res.status=PT_STATUS_ZERO_VARIANCE;       // guard against rounding edge cases
      return(false);
     }
//--- statistic, one-sided p-value and the chi-square cross-check
   res.stat   =(res.P-res.Pstar)/MathSqrt(denom);        // PT, N(0,1) under H0
   res.p_value=PTNormalSF(res.stat);                     // right tail: H1 is skill
   double row_u=uu+ud;
   double row_d=du+dd;
   double col_u=uu+du;
   double col_d=ud+dd;
   double cross=(double)uu*dd-(double)ud*du;             // ad - bc of the 2x2 table
   res.chi2  =nn*cross*cross/(row_u*row_d*col_u*col_d);  // Pearson chi-square, 1 dof
   res.chi2_p=PTChi2SF1(res.chi2);                       // two-sided, not used by the gate
   res.status=PT_STATUS_OK;                              // statistic is defined
   return(true);
  }
Apart from having fewer than 30 pairs, there are three ways to end up with no statistic, and each returns false with its own status. I didn't want a zero here, because a zero reads as "no skill" when nothing was measured. Anything other than PT_STATUS_OK keeps the gate closed.
The zero-variance branch is a guard. Across 9.3 million tables (n = 30…120) with both shares strictly between 0 and 1, the denominator remained positive. Over the 69,996 real windows here, the denominator never fell below 52% of Var(P). All 110,442 logged bars carry status ok, so no failure branch changed any result. The ratio PT²/χ² on the full samples ranges from 1.0001 to 1.0002.
For the right-tail p-value, PTNormalSF() goes through the complementary error function, because computing 1 − Φ(z) via direct subtraction loses precision in the far tail.
Three forecasters
Every closed bar passes through CForecastEngine::Push(), which keeps a ring of log closes and a running EMA:
//+------------------------------------------------------------------+
//| Add the log close of a finished bar and update the EMA           |
//+------------------------------------------------------------------+
void CForecastEngine::Push(const double log_price)
  {
//--- the first price seeds the EMA, later ones update it
   if(m_count==0)
     {
      m_ema     =log_price;               // EMA starts at the first price
      m_ema_prev=log_price;               // so the first slope is zero
     }
   else
     {
      double k=2.0/(m_ema_period+1.0);    // EMA weight, 0 < k < 1
      m_ema_prev=m_ema;                   // keep EMA(t-1) for the slope
      m_ema    +=k*(log_price-m_ema);     // EMA(t)
     }
//--- store the price in the ring
   m_buf[m_head]=log_price;         // newest price
   m_head=(m_head+1)%m_capacity;    // wrap the write position
   m_count++;                       // prices seen since reset
  }
The EMA model reads the last change of that EMA:
//+------------------------------------------------------------------+
//| EMA-slope model: the last change of the EMA, in basis points     |
//+------------------------------------------------------------------+
bool CForecastEngine::ForecastEMA(double &value) const
  {
   value=0.0;                          // no forecast by default
   if(m_count<=m_ema_period)
      return(false);                   // EMA still warming up
   value=(m_ema-m_ema_prev)*PT_SCALE;  // sign = sign(lp - EMA(t-1))
   return(true);                       // forecast available
  }
Since EMA_t − EMA_{t−1} = k(lp_t − EMA_{t−1}) and k is positive, the forecast says "up" whenever the close is above the previous EMA. Nothing is fitted, and N = 20 is a demonstration value, not one I optimized or recommend.
ForecastAR1() is also in the engine. AR(1) estimates an intercept and a slope from the last 200 return pairs on every bar. I left it out of the test matrix, so no result here comes from it. The third model is a coin flip from a 32-bit linear congruential generator, identical in MQL5 and in the Python mirror.
One side effect caught me out. Warm-up always draws the same number of flips, so with the default seed every random run logs the same sequence. All six random runs match over their first 4,208 logged bars. Interpret these as one coin sequence tested against six outcome series, not as six independent controls. The fixed seed makes the runs reproducible, and that is all it buys.
Scoring forecasts without look-ahead
CRollingPT holds one forecast that is still waiting for its outcome, plus a ring of the last W scored pairs. Its four cell counts are adjusted as pairs enter and leave:
//+------------------------------------------------------------------+
//| Score the forecast opened one bar ago against 'close', then open |
//| a new one. 'record' adds the scored pair to the full-sample      |
//| counts. Returns the outcome sign, or 0 when nothing was scored.  |
//+------------------------------------------------------------------+
int CRollingPT::Update(const double close,const int forecast_sign,
                       const bool record)
  {
   int outcome=0;                            // 0 means nothing was scored
   if(m_pend_ok)
     {
      outcome=PTSign(close-m_pend_close);    // direction of the bar that just closed
      //--- a flat bar has no direction and is left out of the test
      if(outcome==0)
        {
         if(record)
            m_zero_all++;  // counted, not tested
        }
      else
        {
         //--- drop the oldest pair once the window is full
         if(m_filled==m_window)
            m_win[PTCell(m_fc[m_head],m_oc[m_head])]--;  // oldest pair leaves
         else
            m_filled++;                                  // window still filling
         m_fc[m_head]=m_pend_sign;                       // store the scored pair
         m_oc[m_head]=outcome;                           // and its outcome
         m_win[PTCell(m_pend_sign,outcome)]++;           // newest pair enters
         m_head=(m_head+1)%m_window;                     // advance the ring
         if(record)
            m_all[PTCell(m_pend_sign,outcome)]++;        // full-sample verdict
        }
     }
//--- open the next forecast at this close
   m_pend_close=close;                 // scored at the next close
   m_pend_sign =forecast_sign;         // direction to be scored
   m_pend_ok   =(forecast_sign!=0);    // zero forecast is never scored
   return(outcome);                    // outcome of the previous forecast
  }
A forecast made at the close of bar t is scored only when bar t + 1 closes, so no window can ever contain an outcome the forecast already knew about.
What the self-test covers
OnInit() runs PTRunSelfTest() and refuses to start, returning INIT_FAILED, if any of its 41 checks fails. Its reference values come from a separate Python implementation that uses scipy for the distributions.
| Group | Checks | What is compared |
|---|---|---|
| Distribution functions | 12 | Normal upper tail, normal quantile, chi-square(1) upper tail |
| PT on reference tables | 15 | n = 100 and n = 10,000 cases, the introduction's example (PT = 0), a wrong-way forecaster, with right-tail p-values and χ² |
| Undefined cases | 3 | Forecaster always "up", and fewer than 30 pairs |
| Rolling evaluator | 7 | Window and full-sample counts on a synthetic path with flat bars |
| Forecasters and coin | 4 | EMA slope and AR(1) on the same path, coin signs and state |
All 18 tester runs started, so all 41 checks passed in the terminal. Not covered: PTFromSigns(), the zero-variance and no-outcome-variation branches, warm-up, trading, sizing, logging and the indicator. Passing the self-test confirms the calculation core, not the trading loop around it. To cover the rolling path I recomputed PT in Python from the logged signs and outcomes. On 105,897 bars whose window lies inside the log, the largest difference from the EA's value is 5.0e−7, the CSV's rounding.
The gated Expert Advisor
Every closed bar, live or replayed, goes through one function:
//+------------------------------------------------------------------+
//| Feed one closed bar: push the price, score the open forecast,    |
//| make the next forecast and evaluate the rolling window           |
//+------------------------------------------------------------------+
void ProcessBar(const double close,const bool record,SBarState &st)
  {
   g_engine.Push(MathLog(close));                                 // models see log prices
   st.fc_ok  =g_engine.Forecast(InpForecaster,st.value,st.sign);  // next-bar direction
   st.outcome=g_pt.Update(close,st.fc_ok ? st.sign : 0,record);   // score the previous forecast
   g_pt.Evaluate(st.res);                                         // PT over the rolling window
   st.ready  =g_pt.Ready();                                       // window full?
  }
Before the first tested bar, WarmUp() pushes 600 history bars through the pipeline with record = false. This fills the window from the start, but replayed pairs are excluded from the full-sample verdict. Like N and W, the 600-bar warm-up is a demonstration choice, not a tuned or recommended one. They do reach the early gate decisions: until 250 new pairs have been scored, each window still holds pre-test bars. Across all 18 runs, 10 gate-open bars fell in that stretch, all on the coin's EURUSD M15 run, and none on an EMA run. On each new bar the EA then scores, tests and decides:
//+------------------------------------------------------------------+
//| Expert tick function                                             |
//+------------------------------------------------------------------+
void OnTick()
  {
//--- act once per new bar of InpTimeframe
   datetime bar=iTime(_Symbol,InpTimeframe,0);           // open time of the forming bar
   if(bar==0 || bar==g_last_bar)
      return;                                            // same bar: nothing to do
   g_last_bar=bar;                                       // act once per bar
   double   close    =iClose(_Symbol,InpTimeframe,1);    // bar that just closed
   datetime bar_time =iTime(_Symbol,InpTimeframe,1);     // its open time, for the log
   if(close<=0.0)
      return;                                            // no data for that bar
//--- score the last forecast, make the next one, test the window
   SBarState st;
   ProcessBar(close,true,st);    // record=true: counts in the verdict
   bool gate_open=(st.ready && st.res.status==PT_STATUS_OK &&
                   st.res.p_value<InpAlpha);
   if(st.ready)
     {
      g_bars_eval++;             // bars with a full window
      if(gate_open)
         g_bars_open++;          // of those, gate open
     }
//--- desired direction: gated, or every forecast in the control run
   int desired=0;                                              // 0 means stay flat
   if(st.fc_ok)
     {
      if(InpGateEnabled)
         desired=gate_open ? st.sign : 0;                      // trade only with evidence
      else
         desired=st.sign;                                      // control: always follow
     }
   string action=ManagePosition(desired);                      // close, open, reverse or hold
   WriteBarRow(bar_time,close,st,gate_open,desired,action);    // one CSV row per bar
  }
The gate is the right-tail test at InpAlpha = 0.05, a critical value of 1.645. It opens when the current window's right-tail p-value is below α, and that is all an open gate says. α limits false alarms in one window; a run makes thousands of overlapping decisions, so some windows will pass by chance. Setting InpGateEnabled to false makes the EA follow every forecast, and that is the control run. ManagePosition() closes a position that disagrees with the forecast and opens one when flat. OpenPosition() places a 2.0 × ATR(14) stop with no target at 0.5% risk. CalculateLotSize() sizes positions using tick value. It switches to contract size when profit currency and account currency match and the computed values differ by more than a factor of two. This check is retained due to incorrect gold metadata on some demo servers.
The rolling indicator
PTRollingStat runs the same engine on closed chart bars. It has no timeframe input and uses the chart's bars. Because it uses the single-buffer form of OnCalculate(), it receives only one price series without knowing which applied price it represents. The code checks neither, so to match the EA's log you must attach it to a chart of the EA's InpTimeframe and leave it on Close, the default. The EA does not use the indicator; it is only a display. Only the right-tail line g_crit = PTNormalQuantile(1 − InpAlpha) is drawn, because only that tail opens the gate.
//+------------------------------------------------------------------+
//| Custom indicator iteration function                              |
//+------------------------------------------------------------------+
int OnCalculate(const int rates_total,
                const int prev_calculated,
                const int begin,
                const double &price[])
  {
//--- full recalculation on first call or when history changes
   if(prev_calculated==0 || prev_calculated>rates_total)
     {
      g_engine.Reset(InpSeed);                           // same seed as the EA
      g_pt.Reset();                                      // empty window
      ArrayInitialize(g_line_a,EMPTY_VALUE);
      ArrayInitialize(g_line_b,EMPTY_VALUE);
      g_next=begin;                                      // first bar to process
      if(InpMaxBars>0)
         g_next=MathMax(begin,rates_total-InpMaxBars);   // limit the history replayed
     }
//--- only closed bars are scored; the forming bar stays empty
   int last_closed=rates_total-2;                           // rates_total-1 is still forming
   for(int i=g_next;i<=last_closed;i++)
     {
      g_line_a[i]=EMPTY_VALUE;
      g_line_b[i]=EMPTY_VALUE;
      if(price[i]<=0.0)
         continue;                                          // no price on this bar
      double value=0.0;
      int    sign =0;
      g_engine.Push(MathLog(price[i]));                     // same order as ProcessBar()
      bool ok=g_engine.Forecast(InpForecaster,value,sign);  // next-bar direction
      g_pt.Update(price[i],ok ? sign : 0,false);            // score the previous forecast
      SPTResult res;
      if(!g_pt.Evaluate(res))
         continue;                                          // window not full yet
      //--- fill the two lines for the selected view
      if(InpView==PT_VIEW_STATISTIC)
        {
         g_line_a[i]=res.stat;         // PT over the last W pairs
         g_line_b[i]=g_crit;           // right-tail critical value
        }
      else
        {
         g_line_a[i]=100.0*res.P;      // hit rate
         g_line_b[i]=100.0*res.Pstar;  // hit rate by chance
        }
     }
   if(last_closed+1>g_next)
      g_next=last_closed+1;            // each closed bar is pushed once
//--- forming bar
   if(rates_total>0)
     {
      g_line_a[rates_total-1]=EMPTY_VALUE;   // no value until it closes
      g_line_b[rates_total-1]=EMPTY_VALUE;
     }
   return(rates_total);                      // all bars processed
  }
Rolling PT statistic on GBPUSD M15

2. EMA-slope forecaster, from the EA log. Top: close. Bottom: PT over the last 250 scored pairs (blue), the right-tail critical value 1.645 (dotted) and zero (gray). Shading marks the gate open.
On this market the gate opened 8 separate times and stayed open for 241 scored bars, even though the full-sample PT is −2.99. One number describes the whole period and the other a 250-bar slice, and neither explains the other.
Strategy Tester results
Settings. Settings. MetaQuotes-Demo, real ticks, a $10,000 deposit in a USD account, 1:100 leverage and a 5 ms delay, with 100% history quality in every report. Spread was floating on all three symbols, not a fixed value, and the broker charged no commission on any of them. Swap, in points, was −12.6/−4.6 (long/short) on XAUUSD, −0.7/−1.0 on EURUSD and −0.2/−2.2 on GBPUSD, tripled on Wednesdays; the tester charges these inside net profit, and I don't add them again. The matrix used default EA inputs throughout. H1 runs cover 2026.01.02 to 2026.09.25 and M15 runs 2026.06.01 to 2026.09.25. Each market ran the EMA forecaster with the gate on and off, plus the coin with the gate on. Re-running the EMA passes gave byte-identical CSVs.
Sample accounting. The EA logs one row per bar it evaluates during the run, and in all twelve EMA reports that count matches the tester's "Bars". A bar is evaluated when the next one opens, so the first logged row is the last bar before the start date, the one that closes as the test begins. "Rows" below means exactly these logged bars. Flat bars have no direction and are excluded. Therefore, n = rows − flat, and the last forecast in each run is never scored. Excluding them shrinks the sample unevenly but only slightly: 0.07% to 0.12% of rows on gold, 0.5% to 1.6% on the currency pairs, most on M15. The gate on and gate off EMA runs score the same forecasts, so their statistics match exactly.
Units and assumptions. The forecasters read log closes, and the EMA slope is logged in basis points (PT_SCALE = 10,000). Recomputing the EMA from the logged closes reproduces every logged slope on 35,014 bars, to rounding. Hit rates are stored as fractions and shown in percent. The window holds scored pairs. Rows matching "Bars" confirm the EA sampled InpTimeframe.
Full-sample tests. "Right" is the right-tail p-value, the gate's test, and "Left" the left-tail p-value.
| Market | Rows | Flat | n | EMA hit | P* | PT | Right | Left | Coin hit | Coin PT | Coin right |
|---|---|---|---|---|---|---|---|---|---|---|---|
| XAUUSD H1 | 4,208 | 3 | 4,205 | 49.0 | 50.0 | −1.25 | 0.894 | 0.106 | 50.1 | 0.17 | 0.433 |
| XAUUSD M15 | 7,364 | 9 | 7,355 | 49.2 | 50.0 | −1.44 | 0.925 | 0.075 | 51.4 | 2.32 | 0.010 |
| EURUSD H1 | 4,558 | 32 | 4,526 | 49.0 | 50.2 | −1.60 | 0.945 | 0.055 | 49.6 | −0.48 | 0.683 |
| EURUSD M15 | 8,064 | 130 | 7,934 | 48.4 | 50.1 | −2.95 | 0.998 | 0.0016 | 50.5 | 0.85 | 0.197 |
| GBPUSD H1 | 4,556 | 23 | 4,533 | 47.9 | 50.1 | −2.88 | 0.998 | 0.0020 | 48.7 | −1.74 | 0.959 |
| GBPUSD M15 | 8,064 | 125 | 7,939 | 48.4 | 50.0 | −2.99 | 0.999 | 0.0014 | 50.1 | 0.13 | 0.447 |
Full-sample PT, EMA forecaster and coin flip
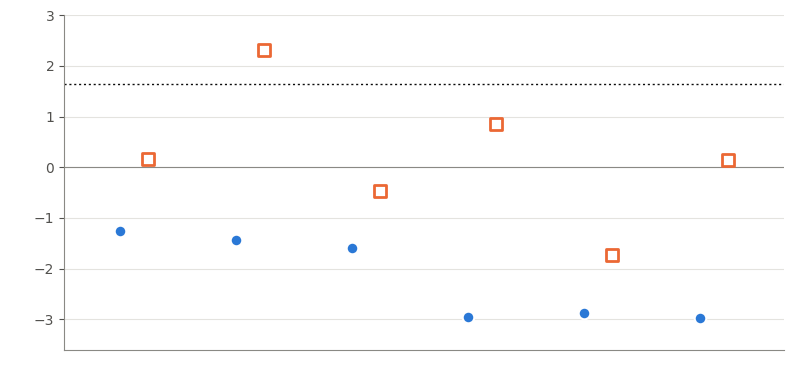
3. Left to right: XAUUSD H1, XAUUSD M15, EURUSD H1, EURUSD M15, GBPUSD H1, GBPUSD M15. Blue circles: EMA forecaster; orange squares: coin flip. Dotted: the right-tail critical value 1.645.
Start with the right tail, the one the gate uses. Every EMA statistic is negative. The only right-tail p below 0.05 belongs to the coin on XAUUSD M15 (0.010), which has no information by construction.
Does the EMA forecaster point the wrong way more often than chance? I only thought to ask after seeing the data, so this left-tail test is exploratory and gets a stricter bar. A Bonferroni cut of 0.05/6 ≈ 0.0083 controls the chance of any false positive among the six EMA left-tail tests, whatever their dependence (EURUSD and GBPUSD move together). It does not cover the path that led here: the EMA model, the markets, the timeframes, W = 250, α = 0.05 and the switch to the left tail after seeing negative statistics. Of the six, three pass: EURUSD M15 (0.0016), GBPUSD H1 (0.0020) and GBPUSD M15 (0.0014). The lowest coin left-tail p is 0.041. Treat these as leads to re-test on another period, not as findings.
These runs can't say why. Several factors may contribute: outcome signs lean slightly towards reversal while the rule bets on continuation, the EMA length was never varied, and the sample is one stretch of 2026. On the other three legs nothing is significant in either tail. That is no evidence of skill, which is not the same as showing the signal is worthless.
Sensitivity to dependence.PT is close to the t-statistic from regressing the outcome indicator on the forecast indicator, and that regression can use Newey-West (HAC) errors with 9 to 10 lags. Shifting the EMA forecasts circularly against the outcomes keeps both series' autocorrelation and breaks their alignment.
| EMA leg | PT | OLS t | HAC t | Left p, normal | Left p, shift null |
|---|---|---|---|---|---|
| XAUUSD H1 | −1.25 | −1.25 | −1.23 | 0.106 | 0.146 |
| XAUUSD M15 | −1.44 | −1.44 | −1.49 | 0.075 | 0.070 |
| EURUSD H1 | −1.60 | −1.60 | −1.69 | 0.055 | 0.048 |
| EURUSD M15 | −2.95 | −2.95 | −3.06 | 0.0016 | 0.0020 |
| GBPUSD H1 | −2.88 | −2.88 | −3.08 | 0.0020 | <0.001 |
| GBPUSD M15 | −2.99 | −2.99 | −3.08 | 0.0014 | <0.001 |
The HAC t-statistics stay within 0.20 of PT. Under the shift null (5,000 shifts per leg) PT had a standard deviation of 0.83 to 1.05, and the 5% right-tail test rejected 1.5% to 5.2% of the time. So for the full samples the normal approximation does not appear anti-conservative here, and the three left-tail results keep shift-null p-values of 0.0020 or below. The rolling gate gets a weaker check. Under the shift null the window gate opened on 4.0% to 4.6% of bars, close to the nominal 5%, but that is the only gate-level test, and nothing here controls the error rate across a run's overlapping decisions.
The coin through the gate. The coin's gate-open share depends on which rows you count, so the table gives both bases. "All rows" is every logged bar, as the EA saw them: 0.13% to 13.91%, 5.8% on average. "Compared rows" drops the bars whose window still held warm-up pairs, which is the part I could simulate. I ran 1,000 coin sequences against each market's real outcomes, each sequence shared by all six markets as in the EA. The simulation starts from an empty window instead of the EA's replayed history, so it matches the EA only from the 251st scored pair on, not over the whole run.
| Market | Rows | Open, all rows % | Compared rows | Open, compared % | Simulated 5–95% |
|---|---|---|---|---|---|
| XAUUSD H1 | 4,208 | 6.54 | 3,959 | 6.95 | 0.2–12.4 |
| XAUUSD M15 | 7,364 | 13.91 | 7,115 | 14.39 | 1.1–10.6 |
| EURUSD H1 | 4,558 | 1.47 | 4,308 | 1.56 | 0.3–12.9 |
| EURUSD M15 | 8,064 | 6.26 | 7,809 | 6.34 | 1.1–10.0 |
| GBPUSD H1 | 4,556 | 0.13 | 4,305 | 0.14 | 0.2–12.7 |
| GBPUSD M15 | 8,064 | 6.63 | 7,809 | 6.85 | 1.0–10.7 |
| Mean of six | — | 5.82 | — | 6.04 | 3.0–7.5 |
The open-bar counts are the same on both bases except EURUSD M15 (505 against 495), so the two columns differ mostly through the denominator. The simulated range applies only to the compared column.
Gate-open share of the coin flip against simulated coins
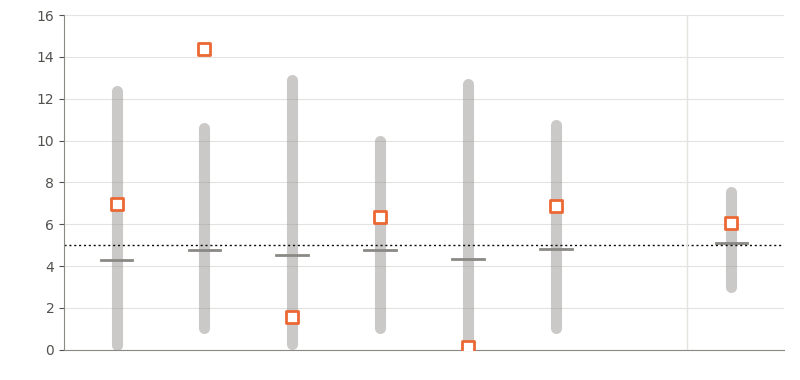
4. Percent of compared rows with the gate open, markets as in Fig. 3, then the six-run mean. Gray: 5th to 95th percentile of 1,000 simulated coins with the median. Orange: real runs. Dotted: 5%.
On compared rows the six-run mean, 6.0%, sits inside its simulated 90% range of 3.0% to 7.5%. That mean is descriptive. The six runs share one coin, so they are closer to one experiment seen through six markets than to six draws, and the simulation keeps the same sharing so that its band is a fair yardstick. Market by market it is less tidy. XAUUSD M15 is outside its band at 14.4%: only 0.4% of simulated runs went higher on that market, though some market reached that level in 9% of replicates. GBPUSD H1, at 0.14%, sits just below its band. At least one of six full-sample right-tail tests fell below 0.05 in 25% of replicates (26% if independent). So the average looks as designed, but that says nothing about a single market, and on gold M15 the coin held the gate open on one bar in seven.
Trading results. From the tester reports, with maximal balance drawdown. Read the ON rows with care: 55 trades in total, 0 to 32 per market, is far too few for profit factor, net profit or drawdown to settle anything, and these numbers are not evidence that the gate is useful.
| Market | Gate | Net, $ | Trades | Profit factor | Max DD % |
|---|---|---|---|---|---|
| XAUUSD H1 | ON | −15.08 | 2 | 0.00 | 0.15 |
| XAUUSD H1 | OFF | +425.16 | 480 | 1.08 | 4.81 |
| XAUUSD M15 | ON | +34.34 | 8 | 1.79 | 0.23 |
| XAUUSD M15 | OFF | −1,685.96 | 977 | 0.86 | 21.23 |
| EURUSD H1 | ON | −17.10 | 2 | 0.00 | 0.17 |
| EURUSD H1 | OFF | +320.42 | 573 | 1.04 | 7.87 |
| EURUSD M15 | ON | −37.78 | 11 | 0.36 | 0.40 |
| EURUSD M15 | OFF | −2,753.98 | 1,138 | 0.81 | 34.97 |
| GBPUSD H1 | ON | 0.00 | 0 | n/a | 0.00 |
| GBPUSD H1 | OFF | −1,158.44 | 619 | 0.87 | 17.16 |
| GBPUSD M15 | ON | −24.89 | 32 | 0.94 | 2.22 |
| GBPUSD M15 | OFF | −5,261.50 | 1,184 | 0.62 | 52.84 |
Net profit per market, gate ON and OFF
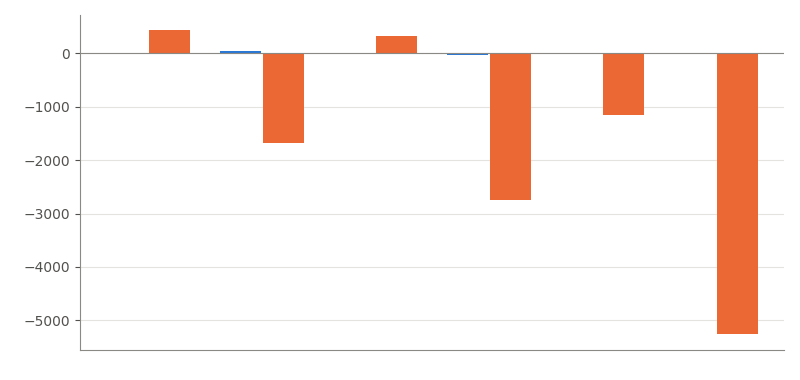
5. Dollars from the tester reports, markets in the order of Fig. 3. Blue: gate ON; orange: gate OFF. The ON bars are barely visible because those runs traded 55 times in total.
Without the gate the EA ended at −10,114.30 dollars over 4,971 trades, and GBPUSD M15 alone cost 52.6% of the deposit. With it, the EA ended at −60.51 dollars over 55 trades. The most visible difference is exposure, about 90 times fewer trades. The data don't separate that from which bars the filter picked, and stops, holding time, position size, the minimum lot and spreads all sit between a forecast and a dollar figure.
To look at the filter apart from trading, I compared forecasts on the same bars, split by whether the gate was open when each was made. Treat this as a description, not a test. The 309 gate-open EMA bars hit 51.1% (158 hits) against 48.6% on 36,177 gate-closed bars, but 241 of them come from GBPUSD M15 (128 hits, 53.1%). The rest are thin: XAUUSD M15 12 of 25, EURUSD M15 16 of 38, and the three H1 legs 2 of 5 between them. Bars inside one open stretch share most of their window, so they are clustered rather than independent, and a binomial p-value on the pooled count would claim more than it can. The coin's 2,386 gate-open bars hit 48.8% and the rest 50.3%. In this sample I can't detect a better hit rate on the bars the gate let through. That is a lack of evidence either way, not proof that the filter adds nothing.
Two ungated runs made money with a below-chance forecaster: XAUUSD H1 (+425.16) and EURUSD H1 (+320.42). Several mechanisms sit between accuracy and profit. Summing the one-bar log return in the forecast direction, without costs or stops, gives +1,717 bp on XAUUSD H1 and +170 on EURUSD H1, and on gold the hits came on bars moving 26.5 bp on average against 24.7 for misses. Holding until the forecast flips, the stop and 706 gold H1 signals blocked by the minimum lot also play a part. Costs pull the other way: XAUUSD M15 sums to +766 bp before costs yet ended at −1,685.96 dollars. The logs can't split these effects further. The general point stands: PT judges direction, not the size of the moves you catch or what they cost, so passing it is not enough to call a signal tradable, and failing it does not rule out a profit.
Limitations
Scope. One broker (MetaQuotes-Demo real ticks), one stretch of 2026 (H1 from 2026.01.02, M15 from 2026.06.01, both to 2026.09.25), three instruments, two timeframes, one EMA period (20), W = 250, a 600-bar warm-up and α = 0.05. None of these were optimized or are recommended settings; they were chosen once, for demonstration, and held fixed across the whole matrix. What I say about the forecaster and the gate holds for this matrix only.
Many tests. α applies to one window, but a run makes thousands of overlapping decisions, so a gate-open share near 5% is the expected noise rate, not a certificate of trading value. The Bonferroni cut covers only the six post-hoc left-tail tests, not the choices that led to them, which is why those results are exploratory.
Controls and approximations. The six coin runs share one sequence because of the fixed seed: reproducible, not independent. Using a different seed per run would remove that dependence. HAC and the shift null support the full-sample results; the rolling gate is checked only through its open share under the shift null, and the shift null keeps only each series' own dependence. Early gate decisions use pre-test bars from warm-up.
Untested parts. The self-test covers the calculation core only. AR(1) and the indicator's accuracy view were not in the matrix, and the gated trading sample, 55 trades, is too small to judge.
Conclusion
A hit rate means very little until you set it against the hit rate the forecaster's own mix of "up" and "down" calls would produce by chance. Pesaran and Timmermann's test does that with four counters and a normal tail, and getting the undefined cases right matters as much as the formula.
In these tests the EMA-slope forecaster showed no right-tail skill anywhere, and on EURUSD M15, GBPUSD H1 and GBPUSD M15 an exploratory left-tail check suggests it was wrong more often than chance. The gated EA traded 55 times and stayed nearly flat while ungated runs lost up to 52.6% of the deposit. Most of that gap is reduced exposure, and these runs can't tell how much the choice of bars added. A coin got through the gate on 5.8% of logged bars on average and on 13.91% in one run. So treat an open gate as a screen, not as proof of skill, judge accuracy and payoff separately, and keep a coin-flip control beside the real forecaster.
| File | Type | Description |
|---|---|---|
| MQL5\Include\PesaranTimmermann\PTCore.mqh | Include | PT test with status codes, chi-square cross-check, distribution functions, EMA/AR(1)/coin forecasters, rolling evaluator and the 41-check self-test. |
| MQL5\Experts\PesaranTimmermann\PTDirectionGate_EA.mq5 | Expert Advisor | Trades the forecast while the rolling right-tail p-value is below α and writes per-bar and summary CSVs to Common Files. |
| MQL5\Indicators\PesaranTimmermann\PTRollingStat.mq5 | Indicator | Rolling PT statistic with its one-sided critical value, or hit rate against P*. Display only; attach it to the EA's timeframe and keep Close. |
| MQL5\Files\PesaranTimmermann\*.py | Python | Reference implementation, self-test values, and the analysis and figure scripts used in this article. The net-profit chart (Fig. 5) reads a tester_results.csv you fill in from your own tester reports; it is optional, not in the archive, and nothing else needs it. |
Warning: All rights to these materials are reserved by MetaQuotes Ltd. Copying or reprinting of these materials in whole or in part is prohibited.
This article was written by a user of the site and reflects their personal views. MetaQuotes Ltd is not responsible for the accuracy of the information presented, nor for any consequences resulting from the use of the solutions, strategies or recommendations described.


