
Creating an EMA Crossover Forward Simulation Indicator in MQL5

Table of Contents
Introduction
Traders and MetaTrader 5 developers often lack actionable context immediately after an EMA crossover. The signal appears, but what happens next is usually left to guesswork. This creates hesitation around entries, trade management, and profit-taking because there is no consistent visual framework for evaluating whether momentum is likely to continue, weaken, or completely fail.
The objective is not to create a market oracle, but to build a disciplined forward-looking projection engine that transforms an EMA crossover into a sequence of plausible future candles. The system should operate automatically, minimize unnecessary redraws, support manual anchoring, and provide clear invalidation rules when market conditions change. In this article, we will build exactly that: a compact Forward Simulation Engine for MetaTrader 5 that converts a standard crossover detector into a structured and extensible forward-scenario visualization tool.
Simulation Overview
The simulation begins the moment a fast EMA crosses above or below a slow EMA, locking in the crossover bar as the anchor point. From that anchor, the engine constructs a predetermined number of future candles by taking the slope of the EMA at the cross and propagating it forward with a built-in decay factor. Each successive bar moves less than the one before it, mimicking how real momentum typically fades over time rather than continuing at full strength.
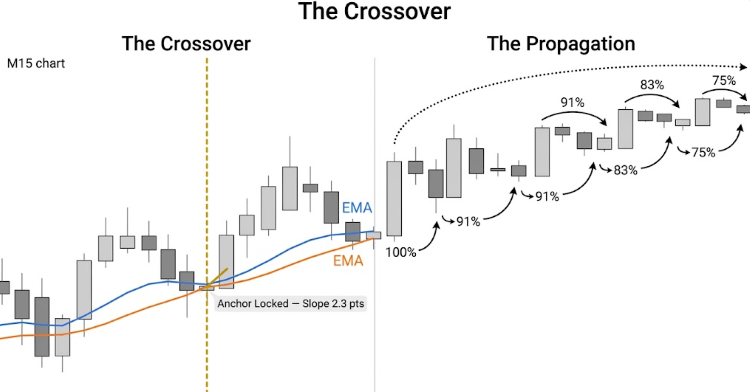
The engine freezes the EMA slope at the crossover bar and propagates it forward with a 0.91 decay factor, so each future bar moves less that the one before it.
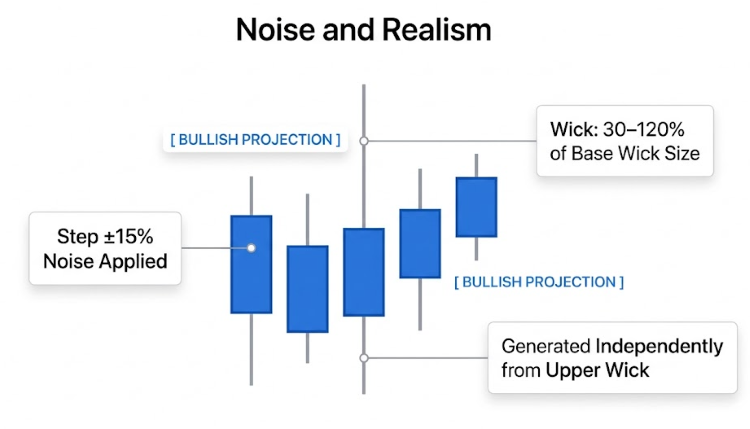
To keep the projection believable, the engine layers in controlled randomness for both body direction and wick size. A small amount of noise is applied to each bar's step so the sequence does not look perfectly linear, while upper and lower wicks are generated independently to reflect normal market structure. The result is an organic-looking forward path. Traders can use it to set take-profit zones, manage trailing stops, or gauge whether the trade still has room to run.
Getting Started
//+------------------------------------------------------------------+
//|                                            ForwardSimEngine.mq5  |
//|                     Forward Simulation Engine  –  EMA Crossover  |
//|                   Visualized as Predicted Future Candles  (M15)  |
//|                                  Copyright 2025, MetaQuotes Ltd. |
//|                     https://www.mql5.com/en/users/johnhlomohang/ |
//+------------------------------------------------------------------+
#property copyright "Copyright 2025, MetaQuotes Ltd."
#property link      "https://www.mql5.com/en/users/johnhlomohang/"
#property version     "1.00"
#property indicator_chart_window
#property indicator_buffers 2
#property indicator_plots   2

#property indicator_label1  "Fast EMA"
#property indicator_type1   DRAW_LINE
#property indicator_color1  clrDodgerBlue
#property indicator_style1  STYLE_SOLID
#property indicator_width1  2

#property indicator_label2  "Slow EMA"
#property indicator_type2   DRAW_LINE
#property indicator_color2  clrOrangeRed
#property indicator_style2  STYLE_SOLID
#property indicator_width2  2

//+------------------------------------------------------------------+
//| INDICATOR BUFFERS                                                |
//+------------------------------------------------------------------+
double FastEMABuffer[];
double SlowEMABuffer[];

//+------------------------------------------------------------------+
//| INPUT PARAMETERS                                                 |
//+------------------------------------------------------------------+
input int    FastEMA_Period     = 9;            // Fast EMA period
input int    SlowEMA_Period     = 21;           // Slow EMA period
input int    FutureBars         = 10;           // Number of future candles to project
input double SpreadMultiplier   = 2.0;          // Wick size multiplier
input bool   AutoAnchor         = true;         // Auto-move anchor to latest cross bar
input string AnchorLineName     = "FSE_Anchor"; // Anchor vertical line name
input color  BullishColor       = clrDodgerBlue;    // Bullish body color
input color  BearishColor       = clrCrimson;       // Bearish body color
input color  WickColor          = clrDimGray;       // Wick color
input bool   ShowZoneLabel      = true;         // Show projection label
input bool   ShowSeparatorLine  = true;         // Show dashed separator at anchor
input int    InvalidationPips   = 10;           // Pip distance to trigger invalidation
To get started, we define how the indicator will appear and behave on the chart. We place it directly in the chart window and configure two plots, which represent the fast and slow EMA lines. Each EMA is styled with its own color, width, and label so we can clearly distinguish them during analysis. We also declare two buffers that will store the calculated EMA values, allowing the platform to draw these lines smoothly over price.
Next, we define a set of input parameters that control both the EMA logic and the forward simulation behavior. We specify the periods for the fast and slow EMAs, along with how many future candles we want to project. We also include controls for spread influence, anchor handling, and visual styling such as bullish and bearish colors, wick appearance, and optional labels or separator lines. Finally, we add an invalidation setting to manage when a projected scenario should no longer be considered valid, giving us better control over how the simulation adapts to changing market conditions.
//+------------------------------------------------------------------+
//| STRUCTS                                                          |
//+------------------------------------------------------------------+
struct PredictedCandle
  {
   double            open;
   double            high;
   double            low;
   double            close;
   bool              bullish;
  };

//+------------------------------------------------------------------+
//| GLOBAL VARS                                                      |
//+------------------------------------------------------------------+
int      g_FastHandle    = INVALID_HANDLE;
int      g_SlowHandle    = INVALID_HANDLE;

int      g_LastSignal    = 0;     // +1 bull, -1 bear, 0 none
bool     g_SignalActive  = false;
double   g_SignalPrice   = 0.0;
datetime g_SignalBarTime = 0;
datetime g_DrawnAnchor   = 0;     // anchor time of the last successful draw

//+------------------------------------------------------------------+
//| Expert initialization function                                   |
//+------------------------------------------------------------------+
int OnInit()
  {
//--- Bind and configure the two visible EMA plot buffers
   SetIndexBuffer(0, FastEMABuffer, INDICATOR_DATA);
   SetIndexBuffer(1, SlowEMABuffer, INDICATOR_DATA);

   ArraySetAsSeries(FastEMABuffer, false);
   ArraySetAsSeries(SlowEMABuffer, false);

   PlotIndexSetInteger(0, PLOT_DRAW_BEGIN, FastEMA_Period);
   PlotIndexSetInteger(1, PLOT_DRAW_BEGIN, SlowEMA_Period);

//--- Internal calculation handles
   g_FastHandle = iMA(_Symbol, _Period, FastEMA_Period, 0, MODE_EMA, PRICE_CLOSE);
   g_SlowHandle = iMA(_Symbol, _Period, SlowEMA_Period, 0, MODE_EMA, PRICE_CLOSE);

   if(g_FastHandle == INVALID_HANDLE || g_SlowHandle == INVALID_HANDLE)
     {
      Print("ForwardSimEngine [ERROR]: iMA handle creation failed. "
            "Symbol=", _Symbol, " TF=", EnumToString(_Period));
      return INIT_FAILED;
     }

   Print("ForwardSimEngine [INIT]: OK  FastEMA=", FastEMA_Period,
         "  SlowEMA=", SlowEMA_Period,
         "  FutureBars=", FutureBars,
         "  InvalidationPips=", InvalidationPips);

   EventSetTimer(3);
   return INIT_SUCCEEDED;
  }

//+------------------------------------------------------------------+
//| Expert deinitialization function                                 |
//+------------------------------------------------------------------+
void OnDeinit(const int reason)
  {
   EventKillTimer();
   CleanAllObjects();
   Print("ForwardSimEngine [DEINIT]: objects cleaned, reason=", reason);
  }
In this code section, we define a PredictedCandle struct. It stores OHLC values and a bullish flag for each projected candle. This allows us to treat future candles as complete units rather than loose values. Alongside this, we declare several global variables to manage the EMA handles and track the state of the system. These include the last detected signal, whether a signal is currently active, the price and time of that signal, and the anchor point used for drawing projections. This setup ensures that our engine always knows the current context before generating any future candles.
We then initialize the indicator by binding the EMA buffers and configuring how they are drawn on the chart. The EMA handles are created using built-in functions, allowing us to retrieve real-time EMA values efficiently. A validation check ensures that both handles are created successfully, preventing the system from running in an unstable state. Once initialized, we activate a timer to control periodic updates, which is useful for managing projections independently of tick events. When the indicator is removed, we clean up all graphical objects and stop the timer, ensuring that the chart remains tidy and no resources are left running in the background.
//+-----------------------------------------------------------------------+
//| ON CALCULATE                                                          |
//+-----------------------------------------------------------------------+
int OnCalculate(const int rates_total,
                const int prev_calculated,
                const datetime &time[],
                const double   &open[],
                const double   &high[],
                const double   &low[],
                const double   &close[],
                const long     &tick_volume[],
                const long     &volume[],
                const int      &spread[])
  {
   if(rates_total < SlowEMA_Period + 5)
     {
      Print("ForwardSimEngine [WARN]: Not enough bars: ", rates_total);
      return 0;
     }

//--- How many bars to (re)calculate
   int limit = (prev_calculated > 1) ? rates_total - prev_calculated + 1
               : rates_total;
//--- Start index in the buffer (oldest bar that needs updating)
   int startBar = rates_total - limit;

//--- Local arrays for engine logic – we own these, safe to size freely
   double tmpFast[], tmpSlow[];
   ArraySetAsSeries(tmpFast, false);
   ArraySetAsSeries(tmpSlow, false);
   ArrayResize(tmpFast, rates_total);
   ArrayResize(tmpSlow, rates_total);

//--- Copy ALL bars into local arrays (needed by RunEngine for crossover)
   int copiedFast = CopyBuffer(g_FastHandle, 0, 0, rates_total, tmpFast);
   int copiedSlow = CopyBuffer(g_SlowHandle, 0, 0, rates_total, tmpSlow);

   if(copiedFast <= 0 || copiedSlow <= 0)
     {
      Print("ForwardSimEngine [WARN]: CopyBuffer returned <=0. fast=",
            copiedFast, " slow=", copiedSlow);
      return prev_calculated;
     }

//--- Write into plot buffers ONLY within the confirmed copied range
//--- and only within what MT5 has allocated (ArraySize guard).
   int bufSzFast = ArraySize(FastEMABuffer);
   int bufSzSlow = ArraySize(SlowEMABuffer);
   int safeFast  = MathMin(copiedFast, bufSzFast);
   int safeSlow  = MathMin(copiedSlow, bufSzSlow);

   for(int i = startBar; i < safeFast; i++)
      FastEMABuffer[i] = tmpFast[i];
   for(int i = startBar; i < safeSlow; i++)
      SlowEMABuffer[i] = tmpSlow[i];

//--- Run the simulation engine
   RunEngine(rates_total, time, close, tmpFast, tmpSlow);

   return rates_total;
  }

//+------------------------------------------------------------------+
//|  ON TIMER                                                        |
//+------------------------------------------------------------------+
void OnTimer()
  {
//--- If user moved the anchor manually, force a redraw on next tick
   if(!AutoAnchor)
     {
      datetime curAnchor = GetAnchorTime();
      if(curAnchor != g_DrawnAnchor && curAnchor != 0)
        {
         g_DrawnAnchor = 0;
         ChartRedraw();
        }
     }
  }
This section handles the main calculation flow of the indicator and ensures that all data is processed safely and efficiently. We first check if there are enough bars available before doing any calculations, which protects the system from invalid states. Then we determine how many bars need to be updated based on previous calculations, allowing us to avoid unnecessary work. Local arrays are created to store EMA values, giving us full control over resizing and indexing without interfering with platform-managed buffers. We copy EMA data into these arrays and validate the result to ensure the data is usable before proceeding.
Once the EMA values are ready, we carefully write them into the indicator buffers within safe limits to avoid out-of-range errors. This ensures that the plotted EMA lines remain stable and accurate on the chart. After updating the buffers, we pass all required data into the simulation engine, which handles signal detection and future candle projection. The timer function complements this by monitoring manual changes to the anchor point, and if a change is detected, it forces a redraw so that the projections stay aligned with the latest user input.
//+------------------------------------------------------------------+
//| CORE ENGINE                                                      |
//| All arrays: index 0 = oldest,  rates_total-1 = live forming bar  |
//|            rates_total-2 = last fully closed bar  (bar index 1)  |
//|            rates_total-3 = bar before that         (bar index 2) |
//+------------------------------------------------------------------+
void RunEngine(const int      rates_total,
               const datetime &time[],
               const double   &close[],
               const double   &fastBuf[],
               const double   &slowBuf[])
  {
   int barLive    = rates_total - 1; // live/forming bar
   int barClosed  = rates_total - 2; // last fully closed bar
   int barPrev    = rates_total - 3; // bar before that

   if(barPrev < SlowEMA_Period)
      return;

//--- 1. Crossover detection
//--- We look at the two most recently CLOSED bars (barPrev and barClosed).
//--- Cross occurs when the fast EMA crossed over the slow EMA between them.
   double fCur  = fastBuf[barClosed];
   double fPrev = fastBuf[barPrev];
   double sCur  = slowBuf[barClosed];
   double sPrev = slowBuf[barPrev];

   int newSignal = 0;
   if(fPrev <= sPrev && fCur > sCur)
      newSignal =  1; // bullish
   if(fPrev >= sPrev && fCur < sCur)
      newSignal = -1; // bearish

//--- Heartbeat log (first 3 ticks + every new signal)
   static int s_ticks = 0;
   s_ticks++;
   if(s_ticks <= 3 || newSignal != 0)
     {
      Print("ForwardSimEngine [TICK #", s_ticks, "]",
            "  fCur=",   DoubleToString(fCur,  _Digits),
            "  sCur=",   DoubleToString(sCur,  _Digits),
            "  gap=",    DoubleToString(fCur - sCur, _Digits),
            "  newSig=", newSignal,
            "  active=", g_SignalActive,
            "  lastSig=",g_LastSignal);
     }

//--- 2. Latch new signal
   if(newSignal != 0)
     {
      g_LastSignal    = newSignal;
      g_SignalActive  = true;
      g_SignalPrice   = close[barClosed];
      g_SignalBarTime = time[barClosed];
      g_DrawnAnchor   = 0; // force full redraw

      Print("ForwardSimEngine [SIGNAL]: ",
            (newSignal == 1 ? ">>> BULLISH CROSS <<<" : ">>> BEARISH CROSS <<<"),
            "  bar=", TimeToString(g_SignalBarTime),
            "  px=",  DoubleToString(g_SignalPrice, _Digits));
     }

//--- 3. Invalidation check
   if(g_SignalActive)
     {
      double livePx = close[barLive];
      //--- 1 pip = 10 * _Point for a 5-digit broker (covers 3-digit too)
      double pipSize = _Point * 10.0;
      double thresh  = InvalidationPips * pipSize;

      bool inv = false;
      if(g_LastSignal ==  1 && livePx < g_SignalPrice - thresh)
         inv = true;
      if(g_LastSignal == -1 && livePx > g_SignalPrice + thresh)
         inv = true;

      if(inv)
        {
         Print("ForwardSimEngine [INVALIDATED]",
               "  signalPx=", DoubleToString(g_SignalPrice, _Digits),
               "  livePx=",   DoubleToString(livePx, _Digits),
               "  thresh=",   DoubleToString(thresh,  _Digits));

         g_SignalActive = false;
         g_LastSignal   = 0;
         g_DrawnAnchor  = 0;
         CleanAllObjects();
         DrawInvalidationLabel(g_SignalBarTime, g_SignalPrice);
         ChartRedraw();
         return;
        }
     }

//--- 4. Only draw/redraw when there is an active signal
   if(!g_SignalActive || g_LastSignal == 0)
      return;

   datetime anchorTime = (AutoAnchor) ? g_SignalBarTime : GetAnchorTime();
   if(anchorTime == 0)
      anchorTime = g_SignalBarTime;

//--- Skip if already drawn at this anchor
   if(anchorTime == g_DrawnAnchor)
      return;
   g_DrawnAnchor = anchorTime;

//--- 5. Build synthetic candles
   double emaSlope = fCur - fPrev;
   PredictedCandle pred[];
   ArrayResize(pred, FutureBars);
   GeneratePrediction(close[barClosed], emaSlope, pred);

//--- 6. Render
   CleanAllObjects();
   DrawAllCandles(anchorTime, pred);
   if(ShowSeparatorLine)
      DrawSeparator(anchorTime);
   if(ShowZoneLabel)
      DrawZoneLabel(anchorTime, close[barClosed]);
   UpdateAnchorLine(anchorTime);
   ChartRedraw();

   Print("ForwardSimEngine [DRAWN]",
         "  signal=",   g_LastSignal,
         "  anchor=",   TimeToString(anchorTime),
         "  bars=",     FutureBars,
         "  slope=",    DoubleToString(emaSlope, _Digits));
  }
This core engine detects EMA crossovers, manages signal state, and controls when projections are drawn. It evaluates the two most recently closed bars to determine whether a bullish or bearish crossover has occurred, then logs and stores that signal with its price and timestamp. Once a signal is active, the engine continuously checks if current price action invalidates it based on a defined pip threshold, ensuring that only valid scenarios are projected. This prevents outdated or incorrect predictions from remaining on the chart.
When a valid signal is present, the engine selects an anchor point and avoids unnecessary redraws by checking if that anchor has already been processed. It then calculates the EMA slope to guide the direction of the projection and generates a sequence of synthetic future candles. Before rendering, it clears previous objects to keep the chart clean, then draws the new candles along with optional visual elements like a separator line and zone label. Finally, it updates the anchor reference and refreshes the chart, ensuring that the projection always reflects the most recent and valid market state.
//+------------------------------------------------------------------+
//|  PREDICTION ENGINE                                               |
//+------------------------------------------------------------------+
void GeneratePrediction(double startPrice, double emaSlope, PredictedCandle &out[])
  {
//--- Wick size in price: 1 pip × multiplier × 3
   double pipVal = _Point * 10.0;
   double wickSz = pipVal * SpreadMultiplier * 3.0;
   if(wickSz < _Point * 5)
      wickSz = _Point * 5;

//--- Step direction: preserve sign from signal, floor at 3 points minimum
   double direction = (g_LastSignal == 1) ? MathAbs(emaSlope) : -MathAbs(emaSlope);
   if(MathAbs(direction) < _Point * 3)
      direction = (g_LastSignal == 1 ? 1.0 : -1.0) * _Point * 3;

   double decayBase = 0.91; // each bar's move is 91% of the previous
   double prevClose = startPrice;

   MathSrand((int)(TimeLocal() % 32767));

   for(int i = 0; i < FutureBars; i++)
     {
      double decay = MathPow(decayBase, i);
      double step  = direction * decay;

      //--- ±15% noise relative to wickSz
      double noise = ((double)(MathRand() % 200) - 100.0) / 100.0 * wickSz * 0.15;
      step += noise;

      out[i].open  = prevClose;
      out[i].close = prevClose + step;
      out[i].bullish = (out[i].close >= out[i].open);

      double bodyTop = MathMax(out[i].open, out[i].close);
      double bodyBot = MathMin(out[i].open, out[i].close);

      //--- Wick: 30%–120% of wickSz
      double upWk = wickSz * (0.3 + (double)(MathRand() % 90) * 0.01);
      double dnWk = wickSz * (0.3 + (double)(MathRand() % 90) * 0.01);

      out[i].high = bodyTop + upWk;
      out[i].low  = bodyBot - dnWk;

      prevClose = out[i].close;
     }
  }

//+------------------------------------------------------------------+
//| DRAW ALL CANDLES – project one bar-width ahead of anchor         |
//+------------------------------------------------------------------+
void DrawAllCandles(datetime startTime, PredictedCandle &candles[])
  {
   int barSec = PeriodSeconds();
   int total  = ArraySize(candles);

   for(int i = 0; i < total; i++)
     {
      //--- +1 so first projected candle starts ONE bar after the anchor
      datetime t1 = startTime + (datetime)((i + 1) * barSec);
      DrawSingleCandle(i, t1, candles[i]);
     }
  }
This prediction engine generates a sequence of synthetic future candles based on the current market context. It begins by calculating a realistic wick size using pip value and a multiplier, ensuring that even small markets still produce visible candles. The direction of movement is derived from the last detected signal and guided by the EMA slope, which reflects current momentum. A minimum movement threshold is enforced to avoid flat projections, and a decay factor is applied so that each future candle moves less aggressively than the previous one. Random noise is also introduced to prevent overly perfect patterns and to better mimic natural market behavior.
Each predicted candle is then constructed step by step, using the previous close as the next open to maintain continuity. The engine determines whether the candle is bullish or bearish and builds the body accordingly, followed by generating variable wick sizes to add realism. Once all candles are created, the drawing function projects them forward in time, starting one full bar after the anchor point. This ensures a clean separation between real price action and the simulated future, allowing the projection to appear as a natural extension of the chart.
//+------------------------------------------------------------------+
//|  DRAW ONE CANDLE                                                 |
//+------------------------------------------------------------------+
void DrawSingleCandle(int idx, datetime t1, const PredictedCandle &c)
  {
   int      barSec  = PeriodSeconds();
   string   pfx     = "FutureCandle_" + IntegerToString(idx);
   datetime t2      = t1 + (datetime)barSec;
   datetime tMid    = t1 + (datetime)(barSec / 2);

   color bodyCol = c.bullish ? BullishColor : BearishColor;

//--- Doji guard: ensure body has at least 1 point height
   double bOpen  = c.open;
   double bClose = c.close;
   if(MathAbs(bOpen - bClose) < _Point)
      bClose = bOpen + (c.bullish ? _Point : -_Point);

//--- Filled body
   string nm = pfx + "_body";
   ObjectDelete(0, nm);
   if(ObjectCreate(0, nm, OBJ_RECTANGLE, 0, t1, bOpen, t2, bClose))
     {
      ObjectSetInteger(0, nm, OBJPROP_COLOR,      bodyCol);
      ObjectSetInteger(0, nm, OBJPROP_FILL,       true);
      ObjectSetInteger(0, nm, OBJPROP_BACK,       false);
      ObjectSetInteger(0, nm, OBJPROP_WIDTH,      1);
      ObjectSetInteger(0, nm, OBJPROP_SELECTABLE, false);
      ObjectSetInteger(0, nm, OBJPROP_HIDDEN,     false);
     }

//--- Body outline (unfilled rectangle)
   nm = pfx + "_bord";
   ObjectDelete(0, nm);
   if(ObjectCreate(0, nm, OBJ_RECTANGLE, 0, t1, bOpen, t2, bClose))
     {
      ObjectSetInteger(0, nm, OBJPROP_COLOR,      bodyCol);
      ObjectSetInteger(0, nm, OBJPROP_FILL,       false);
      ObjectSetInteger(0, nm, OBJPROP_BACK,       false);
      ObjectSetInteger(0, nm, OBJPROP_WIDTH,      1);
      ObjectSetInteger(0, nm, OBJPROP_SELECTABLE, false);
      ObjectSetInteger(0, nm, OBJPROP_HIDDEN,     false);
     }

//--- Upper wick
   nm = pfx + "_wU";
   ObjectDelete(0, nm);
   double wTop = MathMax(bOpen, bClose);
   if(ObjectCreate(0, nm, OBJ_TREND, 0, tMid, wTop, tMid, c.high))
     {
      ObjectSetInteger(0, nm, OBJPROP_COLOR,      WickColor);
      ObjectSetInteger(0, nm, OBJPROP_WIDTH,      1);
      ObjectSetInteger(0, nm, OBJPROP_RAY_RIGHT,  false);
      ObjectSetInteger(0, nm, OBJPROP_SELECTABLE, false);
      ObjectSetInteger(0, nm, OBJPROP_HIDDEN,     false);
     }

//--- Lower wick
   nm = pfx + "_wD";
   ObjectDelete(0, nm);
   double wBot = MathMin(bOpen, bClose);
   if(ObjectCreate(0, nm, OBJ_TREND, 0, tMid, wBot, tMid, c.low))
     {
      ObjectSetInteger(0, nm, OBJPROP_COLOR,      WickColor);
      ObjectSetInteger(0, nm, OBJPROP_WIDTH,      1);
      ObjectSetInteger(0, nm, OBJPROP_RAY_RIGHT,  false);
      ObjectSetInteger(0, nm, OBJPROP_SELECTABLE, false);
      ObjectSetInteger(0, nm, OBJPROP_HIDDEN,     false);
     }
  }

//+------------------------------------------------------------------+
//| SEPARATOR                                                        |
//+------------------------------------------------------------------+
void DrawSeparator(datetime t)
  {
   string nm = "FSE_Sep";
   ObjectDelete(0, nm);
   if(ObjectCreate(0, nm, OBJ_VLINE, 0, t, 0))
     {
      ObjectSetInteger(0, nm, OBJPROP_COLOR,      clrSilver);
      ObjectSetInteger(0, nm, OBJPROP_STYLE,      STYLE_DASH);
      ObjectSetInteger(0, nm, OBJPROP_WIDTH,      1);
      ObjectSetInteger(0, nm, OBJPROP_BACK,       true);
      ObjectSetInteger(0, nm, OBJPROP_SELECTABLE, false);
      ObjectSetInteger(0, nm, OBJPROP_HIDDEN,     false);
     }
  }

//+------------------------------------------------------------------+
//| ZONE LABEL                                                       |
//+------------------------------------------------------------------+
void DrawZoneLabel(datetime t, double price)
  {
   string nm  = "FSE_Label";
   string txt = (g_LastSignal == 1) ? "[ BULLISH PROJECTION ]" : "[ BEARISH PROJECTION ]";
   color  col = (g_LastSignal == 1) ? BullishColor : BearishColor;

   ObjectDelete(0, nm);
   if(ObjectCreate(0, nm, OBJ_TEXT, 0, t + (datetime)PeriodSeconds(), price))
     {
      ObjectSetString(0,  nm, OBJPROP_TEXT,       txt);
      ObjectSetInteger(0, nm, OBJPROP_COLOR,      col);
      ObjectSetInteger(0, nm, OBJPROP_FONTSIZE,   10);
      ObjectSetString(0,  nm, OBJPROP_FONT,       "Courier New");
      ObjectSetInteger(0, nm, OBJPROP_ANCHOR,     ANCHOR_LEFT_LOWER);
      ObjectSetInteger(0, nm, OBJPROP_SELECTABLE, false);
      ObjectSetInteger(0, nm, OBJPROP_HIDDEN,     false);
     }
  }
This section focuses on rendering each predicted candle with precision and clarity using chart objects. We construct every candle by defining its time range and midpoint, then determine its body color based on whether it is bullish or bearish. A small safeguard ensures that even doji candles have a visible body, preventing rendering issues. The candle body is drawn using two rectangles: one filled to represent the main body and another unfilled to create a clean outline. Before drawing, any existing object with the same name is deleted to avoid duplication and keep the chart clean.
We then complete the candle by drawing the upper and lower wicks using vertical trend lines positioned at the midpoint of the candle. These wicks extend from the body to the high and low values, giving the candle a realistic structure. Beyond individual candles, we also enhance visualization by adding a separator line at the anchor point to clearly divide real price action from projected data. A label is placed near the projection zone to indicate whether the scenario is bullish or bearish, using matching colors for consistency.
//+------------------------------------------------------------------+
//|  INVALIDATION LABEL                                              |
//+------------------------------------------------------------------+
void DrawInvalidationLabel(datetime t, double price)
  {
   string nm = "FSE_Invalid";
   ObjectDelete(0, nm);
   if(ObjectCreate(0, nm, OBJ_TEXT, 0, t + (datetime)PeriodSeconds(), price))
     {
      ObjectSetString(0,  nm, OBJPROP_TEXT,       "[ INVALIDATED - AWAITING NEXT CROSS ]");
      ObjectSetInteger(0, nm, OBJPROP_COLOR,      clrOrange);
      ObjectSetInteger(0, nm, OBJPROP_FONTSIZE,   9);
      ObjectSetString(0,  nm, OBJPROP_FONT,       "Courier New");
      ObjectSetInteger(0, nm, OBJPROP_ANCHOR,     ANCHOR_LEFT_LOWER);
      ObjectSetInteger(0, nm, OBJPROP_SELECTABLE, false);
      ObjectSetInteger(0, nm, OBJPROP_HIDDEN,     false);
     }
  }

//+------------------------------------------------------------------+
//|  ANCHOR LINE HELPERS                                             |
//+------------------------------------------------------------------+
void PlaceAnchorLine(datetime t)
  {
   ObjectDelete(0, AnchorLineName);
   if(ObjectCreate(0, AnchorLineName, OBJ_VLINE, 0, t, 0))
     {
      ObjectSetInteger(0, AnchorLineName, OBJPROP_COLOR,      clrGold);
      ObjectSetInteger(0, AnchorLineName, OBJPROP_STYLE,      STYLE_DASHDOTDOT);
      ObjectSetInteger(0, AnchorLineName, OBJPROP_WIDTH,      2);
      ObjectSetInteger(0, AnchorLineName, OBJPROP_SELECTABLE, true);
      ObjectSetInteger(0, AnchorLineName, OBJPROP_HIDDEN,     false);
     }
  }

//+------------------------------------------------------------------+
//|  Update Anchor Line                                              |
//+------------------------------------------------------------------+
void UpdateAnchorLine(datetime t)
  {
   if(ObjectFind(0, AnchorLineName) < 0)
      PlaceAnchorLine(t);
   else
      ObjectSetInteger(0, AnchorLineName, OBJPROP_TIME, t);
  }

//+------------------------------------------------------------------+
//|  Get Anchor Time                                                 |
//+------------------------------------------------------------------+
datetime GetAnchorTime()
  {
   if(ObjectFind(0, AnchorLineName) >= 0)
      return (datetime)ObjectGetInteger(0, AnchorLineName, OBJPROP_TIME);
   return 0;
  }

//+------------------------------------------------------------------+
//|  CLEANUP                                                         |
//+------------------------------------------------------------------+
void CleanAllObjects()
  {
   ObjectsDeleteAll(0, "FutureCandle_");
   ObjectsDeleteAll(0, "FSE_");
  }
//+------------------------------------------------------------------+
This last section handles how the system communicates invalid signals and manages the anchor point used for projections. When a signal becomes invalid, we display a clear label on the chart to inform the user that the current scenario is no longer valid and that the engine is waiting for the next crossover. The label is positioned just ahead of the anchor point and styled for visibility, while any previous invalidation label is removed to prevent clutter. This ensures the chart always reflects the latest state of the simulation without confusion.
We also manage the anchor line, which serves as the reference point for where projections begin. The system can place the anchor line, update its position if it already exists, and retrieve its time when needed. This allows both automatic and manual control over where the simulation starts. Finally, a cleanup function removes all previously drawn projection objects and related elements, ensuring that each new simulation is rendered on a clean chart. This keeps the visual output consistent, organized, and easy to interpret.
Simulation Demo
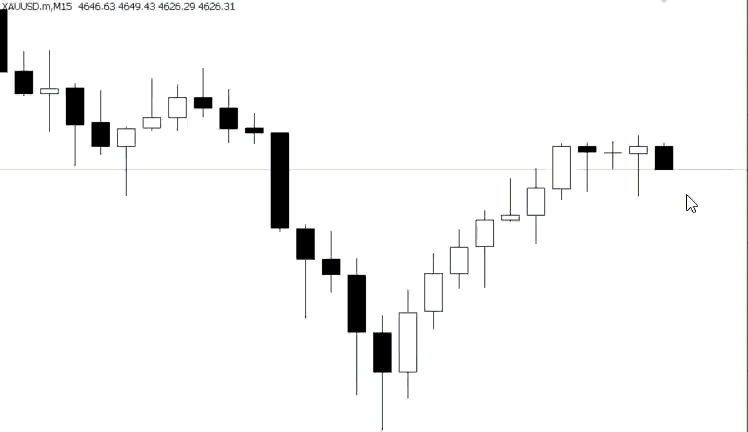
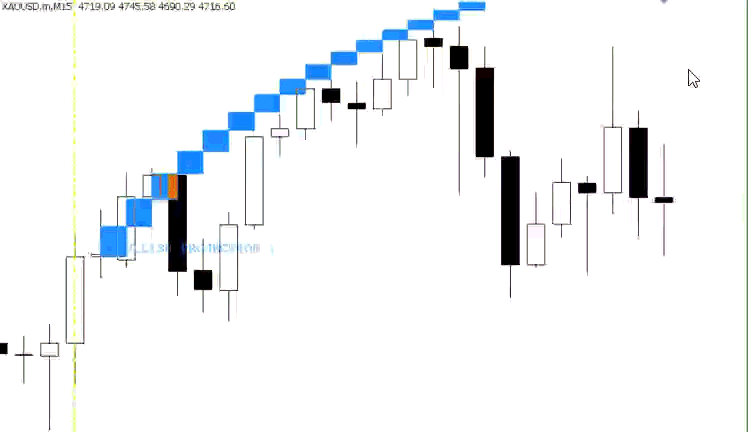
Bullish simulation:
Bearish simulation:
Conclusion
We implemented a practical Forward Simulation Engine that goes beyond a standard EMA indicator and delivers a structured visual scenario framework. The system detects EMA crossovers on closed bars, locks an anchor point, measures EMA slope at the signal, and generates a sequence of synthetic OHLC candles using directional decay and controlled noise. It also includes signal invalidation through a pip-based threshold, supports both automatic and manual anchoring, and avoids unnecessary redraws for better chart efficiency. To complete the visualization, the engine renders projected candle bodies, wicks, separator lines, and projection labels while maintaining a clean chart environment.
As a result, you now have a concrete MetaTrader 5 framework: a crossover detector, a reproducible generator for FutureBars, an invalidation rule, an anchor mechanism, and a robust rendering/cleanup flow. This serves as a solid base for extensions—for example, replacing the simple slope/noise model with volatility-aware steps, structure-based scenario filters, or machine-learning score overlays-without reworking the signal or visualization core. In short, the article delivers a repeatable, extensible tool to turn EMA signals into interpretable forward scenarios rather than unanswered alerts.
Warning: All rights to these materials are reserved by MetaQuotes Ltd. Copying or reprinting of these materials in whole or in part is prohibited.
This article was written by a user of the site and reflects their personal views. MetaQuotes Ltd is not responsible for the accuracy of the information presented, nor for any consequences resulting from the use of the solutions, strategies or recommendations described.

- Free trading apps
- Over 8,000 signals for copying
- Economic news for exploring financial markets
You agree to website policy and terms of use
Check out the new article: Creating an EMA Crossover Forward Simulation Indicator in MQL5.
Author: Hlomohang John Borotho
Bidhaan Yuusuf #:
Hi how can dolowod this indicator