

Building a Gold Volatility Regime Monitor from Options Data in MQL5
 1 176
1 176
 0
0

Introduction
Your gold chart is a complete record of what already happened. But there's a second market quoting gold right now, and it isn't describing the past at all. It's quoting what people expect next and how much they'll pay to be protected from it.
That second market is the options market, and MetaTrader doesn't show you one number from it. Nothing is hidden: gold options are quoted publicly throughout the trading day. The problem is plumbing. MetaTrader was built to trade instruments, not to read option chains, so the information sits one wall away from the terminal where you actually size your trades.
So that's what we're building. We'll take one number out of the gold options market, the one that says how much movement traders are paying to be protected against, compare it with how much gold has actually been moving, and put the difference on your chart. What options quote is the price of protection, shaped by supply and demand, not a pure forecast, so the comparison is context rather than a signal.
By the end, you'll have three programs:
- a Python script that reads the option chain and publishes a small file;
- an example MetaTrader script that reads the file and prints the comparison;
- a background service that keeps the reading live on a chart and sends a phone notification when the regime changes.
All of it is source code you can read and change.
Realized and implied volatility
Volatility means how much something moves, and there are two entirely different ways to measure it.
The first is realized volatility. Take gold's closing prices, compute the daily returns, take the standard deviation, and scale it to a year. That's a measurement of the past: over the last month, gold moved about this much. MetaTrader can compute this because it has the price history.
The second is implied volatility, and it isn't measured from price history at all. It's extracted from what people are paying for options right now. An option is the right to buy or sell gold at a fixed price later, and what that right costs depends mostly on how much gold is expected to move between now and then. If gold is expected to sit still, the right is nearly worthless; if gold is expected to swing hard, it is valuable. So, the price contains an opinion about future movement, and running that logic backward recovers the movement being assumed. It isn't a forecast anybody published. It's the expectation sitting inside what traders are paying with real money.
That distinction is the whole article. Realized volatility is what gold did. Implied volatility is what the market is charging for what gold might do.
The variance risk premium
Put the two side by side, and the gap between them points at something with a name and a literature: the variance risk premium. [1] The term deserves precision. In strict academic usage, it is defined in terms of variance rather than a volatility difference and measured against realized variance over a matching horizon. This article does not attempt that estimate. It builds the practical, MetaTrader-friendly proxy: the gap between near-the-money implied volatility and recently realized volatility, at the same 30-day horizon. Everything that follows should be read in that spirit.
The gap is usually positive, which is interesting in itself: across markets, options tend to price more movement than actually shows up. [2] That persistence is compensation. Selling protection means carrying the risk of the day everything moves at once, and people want to be paid for carrying it.
The useful reading isn't the absolute number; it's the comparison. I prefer the ratio, implied divided by realized, because it's scale-free and survives regime changes in a way that raw volatility points don't. The boundaries below, 1.20, 1.05 and 0.95, are heuristic and configurable: they are reasonable working values for gold, not thresholds this article estimates or validates. They are inputs in the code, and a different instrument or horizon will want different ones. Four states, in plain words. If the ratio is:
- Well above 1: protection is expensive, and it may not be visible on the price chart yet.
- Slightly above 1: a modest premium, the normal resting state of most markets.
- Near 1: expectations and reality agree.
- Below 1: realized movement is outrunning implied; the market was positioned for calm and isn't getting it.
Applications in position sizing and strategy selection
A measurement is only worth taking if it changes a decision.
Start with position sizing, because that's where it bites hardest. Almost every sizing rule in retail trading is calibrated to realized volatility: ATR-based stops, percent-risk models, and volatility-scaled lots. They all look backward, and that works until the regime changes. When implied volatility is well above realized, the options market is pricing wider swings than the last month delivered. In that case, your stop is calibrated to the wrong volatility. The same logic covers the complacency trap: quiet markets shrink ATR, the sizing model hands you more lots, and everything feels safe right up until it isn't. A high ratio during a quiet stretch is one of the few early warnings available, and it comes from people with money riding on the answer rather than from an oscillator.
It also helps with interpreting conditions. When the ratio drops below 1, gold has recently delivered more movement than the options market had been pricing; that can coincide with trending or expanding conditions, but it is context, not a strategy switch. When it sits well above 1, protection is bid, which often accompanies nervous, range-bound markets and sometimes just reflects hedging demand. Scheduled risk also tends to show up first in implied volatility, so the ratio can act as a crude event-sensitive warning even without a calendar, though not every event produces a clean signal. And if you buy options or structured products on gold, this is simply the price check: a ratio of 1.4 means you're paying forty percent over what gold has been delivering.
The limits are worth stating plainly. This says nothing about direction, and it isn't a timing trigger: premiums can stay stretched for weeks.
For a developer, the useful part may not be gold at all. Compute data outside MetaTrader, publish it as a small JSON file, read it via WebRequest, and consume it in a service. This pattern generalizes to any data the terminal cannot access, for example, positioning or model output. Gold's implied volatility is the example; the bridge is the technique.
Extracting implied volatility from option prices
This is the part to build carefully, because it's where the one real trap lives.
The mechanics are Black-Scholes. [4] The model prices an option from five inputs: the price of the underlying, the strike, the time left, the interest rate, and volatility. Four are known facts. Volatility is the only unknown, so we invert it: take the price the option is actually trading at and search for the volatility that makes the model produce it. An option's price rises steadily as volatility rises, so a simple bisection search can't get lost. Narrow the bracket until the model price matches the market price, and the volatility you're left holding is the implied volatility.
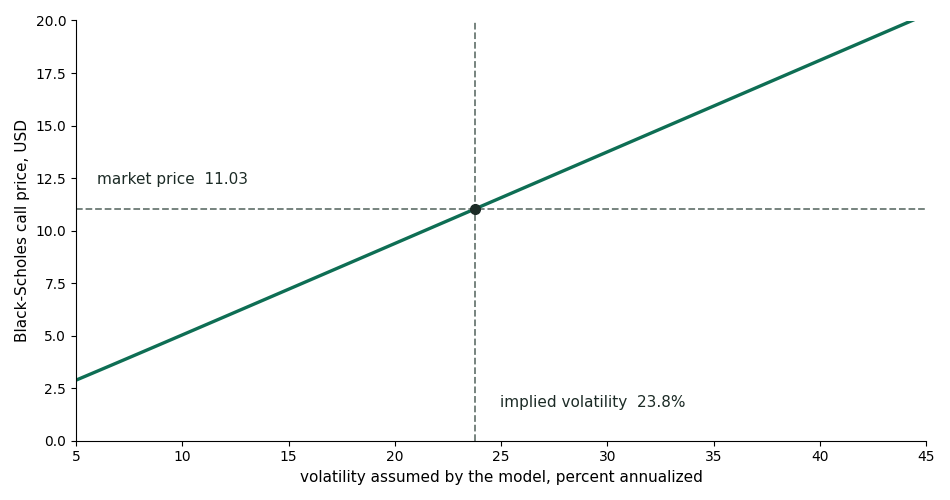
The option price rises steadily with the volatility assumed by the model, so the quoted price picks out exactly one volatility. A gold call quoted at $11.03 implies 23.8 percent.
Now the trap. Most free option chains ship an "implied volatility" column, and it's tempting to just read it. When I first did that for gold, the column reported 0.20 percent, and 0.00 percent on some contracts, while the prices of those same contracts implied about 22 percent. Gold's annualized volatility being one-fifth of one percent isn't a small error; it's impossible, and nothing about the number looked broken until you knew what to expect. Re-running the script months later, the same column returned plausible figures instead, around 24 percent, while still understating the solved values on the put side by more than a volatility point. The lesson is simple: the field is unreliable. A value that is only sometimes correct is the most dangerous failure mode. So, we compute it ourselves, which costs about forty lines of code.
One more decision worth explaining. For each expiry, we take the call and the put closest to the money, solve both, and average them. This reduces one-sided distortions and gives a more balanced at-the-money proxy. It does not remove skew from the surface; it only keeps the reading from leaning on whichever side happens to be richer. Puts on gold are often bid up by hedgers, and reading puts alone measures fear rather than expected range.
Implementation of the data feed in Python
MetaTrader can't read an option chain, so we do that part outside and hand it the answer. The script below reads the option chain of GLD, the gold ETF, solves implied volatility at several expiries, interpolates to a thirty-day horizon, measures realized volatility as a reference, and writes one small JSON object. The interpolation runs on total variance, volatility squared multiplied by time, rather than on volatility itself, because variance accumulates linearly with time in a way that volatility does not.
Why GLD rather than spot gold? Because the gold options anyone can pull for free are quoted on the ETF, and its option-implied volatility is a useful proxy for gold volatility expectations. It is not identical to options on spot gold: the ETF has its own trading hours, structure, and frictions. Over the same 30 sessions, realized volatility was 22.65% for GLD and 22.61% for XAUUSD. One window on one pair of instruments is a spot check rather than proof of equivalence, but it is close enough to treat GLD as an acceptable proxy here.
#!/usr/bin/env python3
"""
gold_vrp_feed.py - publish gold's options-implied volatility as a small JSON feed.

WHY THIS EXISTS
    MetaTrader 5 has no access to options data. Implied volatility, the market's
    forward-looking expectation of movement, does not exist inside the terminal. This
    script computes it outside, from a free public option chain, and writes one small
    JSON object that any MQL5 program can read over HTTP.

WHAT THIS IS, METHODOLOGICALLY
    A practical proxy, not a full academic measurement. In strict academic usage the
    variance risk premium is defined on variance, not on a simple volatility
    difference. This feed publishes the applied version: near-the-money implied
    volatility at a 30-day horizon against 30-session realized volatility. GLD options
    are used as a liquid, freely quoted proxy for gold volatility expectations; they
    are not identical to options on spot gold.

WHY IT SOLVES FOR IMPLIED VOLATILITY INSTEAD OF READING IT
    Option chains usually ship an implied volatility column. For gold that column
    reported 0.20 percent, and on some contracts 0.00 percent, while the prices of those
    same contracts implied about 22 percent. So we ignore that column and solve
    Black-Scholes backwards from the price the market is actually paying, which is what
    implied volatility means in the first place. The inversion is an approximation: it
    treats the options as European, uses a flat short-rate, and reads only the
    near-the-money slice of the surface. For short-dated near-ATM contracts feeding a
    monitor, that is a reasonable engineering compromise.

WHAT IT COMPUTES
    spot                  current price of GLD, the gold ETF whose options we read
    iv_atm                at-the-money implied volatility of the nearest usable expiry
    iv_30d                the same at a 30-day horizon, interpolated in total variance
    iv_30d_interpolated   true when a real interpolation happened
    rv_30d_gld            realized volatility of GLD over the last 30 sessions
    vrp_reference         iv_30d - rv_30d_gld, in volatility points, as a sanity check
    plus the expiry used, days to expiry, and a UTC timestamp

USAGE
    pip install yfinance pandas numpy
    python gold_vrp_feed.py                  print the JSON
    python gold_vrp_feed.py --out feed.json  also write it to a file
    python gold_vrp_feed.py --debug          show the contracts and prices used
"""

import argparse
import json
import math
from datetime import datetime, timezone

import numpy as np
import pandas as pd
import yfinance as yf

TICKER = "GLD"          # gold ETF: liquid options, no dividend, quoted in dollars
RV_WINDOW = 30          # sessions of realized volatility, matches the 30-day implied horizon
TRADING_DAYS = 252      # annualization factor for realized volatility
RISK_FREE = 0.04        # short-rate approximation; at-the-money IV barely moves with it
MIN_OI = 10             # ignore contracts with almost no open interest
IV_FLOOR, IV_CEIL = 0.02, 2.00   # sanity bounds: 2% to 200% annualized
MAX_EXPIRIES = 8        # stop scanning after this many usable expiries


def norm_cdf(x: float) -> float:
    """Standard normal cumulative distribution."""
    return 0.5 * (1.0 + math.erf(x / math.sqrt(2.0)))


def bs_price(spot, strike, t_years, vol, rate, is_call) -> float:
    """Black-Scholes price of a European option on a non-dividend-paying asset."""
    if t_years <= 0 or vol <= 0:
        intrinsic = (spot - strike) if is_call else (strike - spot)
        return max(intrinsic, 0.0)
    d1 = (math.log(spot / strike) + (rate + 0.5 * vol * vol) * t_years) / (vol * math.sqrt(t_years))
    d2 = d1 - vol * math.sqrt(t_years)
    if is_call:
        return spot * norm_cdf(d1) - strike * math.exp(-rate * t_years) * norm_cdf(d2)
    return strike * math.exp(-rate * t_years) * norm_cdf(-d2) - spot * norm_cdf(-d1)


def implied_vol(market_price, spot, strike, t_years, rate, is_call):
    """
    Solve Black-Scholes backwards for volatility, by bisection.

    An option's price rises monotonically with volatility, so we can narrow a bracket
    until the model price matches the market price. Bisection is slower than Newton's
    method and far more reliable, which is the right trade for a feed that must not
    return nonsense.
    """
    intrinsic = max((spot - strike) if is_call else (strike - spot), 0.0)
    if market_price <= intrinsic + 1e-6:
        return None                      # no time value left, nothing to imply

    low, high = IV_FLOOR, IV_CEIL
    if bs_price(spot, strike, t_years, high, rate, is_call) < market_price:
        return None                      # price above what 200% volatility can explain

    for _ in range(100):
        mid = 0.5 * (low + high)
        if bs_price(spot, strike, t_years, mid, rate, is_call) < market_price:
            low = mid
        else:
            high = mid
        if high - low < 1e-6:
            break
    return 0.5 * (low + high)


def mid_price(row):
    """Prefer the bid/ask midpoint; fall back to the last trade."""
    bid = float(row.get("bid") or 0.0)
    ask = float(row.get("ask") or 0.0)
    if bid > 0 and ask > 0 and ask >= bid:
        return 0.5 * (bid + ask)
    last = float(row.get("lastPrice") or 0.0)
    return last if last > 0 else None


def realized_volatility(closes: pd.Series, window: int = RV_WINDOW) -> float:
    """Annualized standard deviation of daily log returns."""
    logret = np.log(closes / closes.shift(1)).dropna()
    if len(logret) < window:
        return float("nan")
    return float(logret.tail(window).std(ddof=1) * math.sqrt(TRADING_DAYS))


def atm_iv_for_expiry(tk, expiry, spot, t_years, debug=False):
    """
    Average the implied volatility of the call and the put nearest the money.

    Using both sides reduces one-sided distortions and gives a more balanced
    at-the-money proxy. It does not remove skew from the surface; it only keeps the
    reading from leaning on whichever side happens to be richer.
    """
    chain = tk.option_chain(expiry)
    results = []
    for frame, is_call in ((chain.calls, True), (chain.puts, False)):
        if frame is None or frame.empty:
            continue
        usable = frame[frame["openInterest"].fillna(0) >= MIN_OI]
        if usable.empty:
            usable = frame
        row = usable.iloc[(usable["strike"] - spot).abs().argsort().iloc[0]]
        price = mid_price(row)
        if price is None:
            continue
        vol = implied_vol(price, spot, float(row["strike"]), t_years, RISK_FREE, is_call)
        if vol is None or not (IV_FLOOR < vol < IV_CEIL):
            continue
        results.append(vol)
        if debug:
            kind = "call" if is_call else "put "
            print(f"    {kind} strike {float(row['strike']):8.2f}  price {price:7.2f}  "
                  f"solved IV {vol * 100:6.2f}%  (chain field said "
                  f"{float(row.get('impliedVolatility') or 0) * 100:.2f}%)")
    if not results:
        return None
    return sum(results) / len(results)


def build_feed(debug=False) -> dict:
    tk = yf.Ticker(TICKER)

    history = tk.history(period="6mo", interval="1d")
    if history.empty:
        raise RuntimeError(f"no price history returned for {TICKER}")
    spot = float(history["Close"].iloc[-1])
    rv = realized_volatility(history["Close"])

    today = datetime.now(timezone.utc).date()
    candidates = []
    for expiry in tk.options:
        days = (datetime.strptime(expiry, "%Y-%m-%d").date() - today).days
        if days < 7 or days > 90:
            continue
        if debug:
            print(f"  expiry {expiry} ({days} days):")
        vol = atm_iv_for_expiry(tk, expiry, spot, days / 365.0, debug)
        if vol:
            candidates.append((days, expiry, vol))
        # stop once the 30-day horizon is bracketed on both sides
        bracketed = (any(c[0] <= 30 for c in candidates)
                     and any(c[0] >= 30 for c in candidates))
        if bracketed or len(candidates) >= MAX_EXPIRIES:
            break
    if not candidates:
        raise RuntimeError("no expiry produced a usable at-the-money implied volatility")

    candidates.sort()
    near_days, near_expiry, near_iv = candidates[0]

    # interpolate in total variance (sigma squared times time) between the expiries
    # straddling 30 days, then convert back to volatility; implied volatility is not
    # linear in time, while total variance interpolates more faithfully
    iv_30d = near_iv
    interpolated = False
    before = [c for c in candidates if c[0] <= 30]
    after = [c for c in candidates if c[0] >= 30]
    if before and after:
        lo_days, _, lo_iv = before[-1]
        hi_days, _, hi_iv = after[0]
        if hi_days > lo_days:
            lo_var = lo_iv * lo_iv * lo_days
            hi_var = hi_iv * hi_iv * hi_days
            weight = (30 - lo_days) / (hi_days - lo_days)
            var_30d = lo_var + weight * (hi_var - lo_var)
            iv_30d = math.sqrt(var_30d / 30.0)
            interpolated = True
        else:
            iv_30d = lo_iv

    return {
        "symbol": TICKER,
        "spot": round(spot, 4),
        "iv_atm": round(near_iv, 6),
        "iv_30d": round(iv_30d, 6),
        "iv_30d_interpolated": interpolated,
        "rv_30d_gld": None if math.isnan(rv) else round(rv, 6),
        "vrp_reference": None if math.isnan(rv) else round(iv_30d - rv, 6),
        "expiry": near_expiry,
        "days_to_expiry": near_days,
        "updated_utc": datetime.now(timezone.utc).strftime("%Y-%m-%dT%H:%M:%SZ"),
        "source": "option chain, implied volatility solved from market prices",
    }

def main() -> int:
    parser = argparse.ArgumentParser(description="Publish gold implied volatility as JSON")
    parser.add_argument("--out", help="also write the JSON to this file")
    parser.add_argument("--debug", action="store_true", help="show contracts and prices used")
    args = parser.parse_args()

    if args.debug:
        print("solving implied volatility from market prices:")
    feed = build_feed(args.debug)
    text = json.dumps(feed, indent=2)
    print(("\n" if args.debug else "") + text)

    if args.out:
        with open(args.out, "w", encoding="utf-8") as handle:
            handle.write(text + "\n")
        print(f"\nwritten to {args.out}")

    iv = feed["iv_30d"] * 100
    rv = feed["rv_30d_gld"]
    horizon = "interpolated to 30 days" if feed["iv_30d_interpolated"] else \
              f"nearest expiry, {feed['days_to_expiry']} days"
    print(f"\n30-day implied volatility: {iv:.2f}%  ({horizon})")
    if rv is not None:
        print(f"30-day realized volatility (GLD): {rv * 100:.2f}%")
        print(f"reference premium: {feed['vrp_reference'] * 100:+.2f} volatility points")
    return 0

if __name__ == "__main__":
    raise SystemExit(main())
Run it, and it prints the JSON and a short summary.
solving implied volatility from market prices:
  expiry 2026-08-14 (8 days):
    call strike   389.00  price    5.97  solved IV  25.17%  (chain field said 24.73%)
    put  strike   389.00  price    5.05  solved IV  22.82%  (chain field said 21.23%)
  expiry 2026-08-21 (15 days):
    call strike   389.00  price    7.88  solved IV  23.95%  (chain field said 24.55%)
    put  strike   389.00  price    6.70  solved IV  22.39%  (chain field said 21.00%)
  expiry 2026-08-28 (22 days):
    call strike   389.00  price    9.53  solved IV  23.72%  (chain field said 24.71%)
    put  strike   389.00  price    8.03  solved IV  22.36%  (chain field said 20.98%)
  expiry 2026-09-04 (29 days):
    call strike   389.00  price   11.03  solved IV  23.75%  (chain field said 25.01%)
    put  strike   389.00  price    9.25  solved IV  22.62%  (chain field said 21.07%)
  expiry 2026-09-11 (36 days):
    call strike   390.00  price   11.68  solved IV  23.37%  (chain field said 24.81%)
    put  strike   377.00  price    5.35  solved IV  22.54%  (chain field said 21.34%)
{
  "symbol": "GLD",
  "spot": 389.045,
  "iv_atm": 0.239943,
  "iv_30d": 0.231462,
  "iv_30d_interpolated": true,
  "rv_30d_gld": 0.22663,
  "vrp_reference": 0.004832,
  "expiry": "2026-08-14",
  "days_to_expiry": 8,
  "updated_utc": "2026-08-06T18:47:15Z",
  "source": "option chain, implied volatility solved from market prices"
}

30-day implied volatility: 23.15%  (interpolated to 30 days)
30-day realized volatility (GLD): 22.66%
reference premium: +0.48 volatility points
Ten contracts across five expiries, calls and puts, all landing between 22.4 and 25.2 percent. That clustering is how you know the inversion is working, because a broken solver produces scatter rather than agreement. Averaging the call and put at each expiry gives 24.0 percent at eight days, then 23.2, 23.0, 23.2 and 23.0 further out: elevated at the front and flatter beyond, which is the term structure of gold volatility, and none of it is visible on a price chart. In the last expiry, the nearest usable put sits well below the call, because the open-interest filter discarded the closer strikes for lack of liquidity.
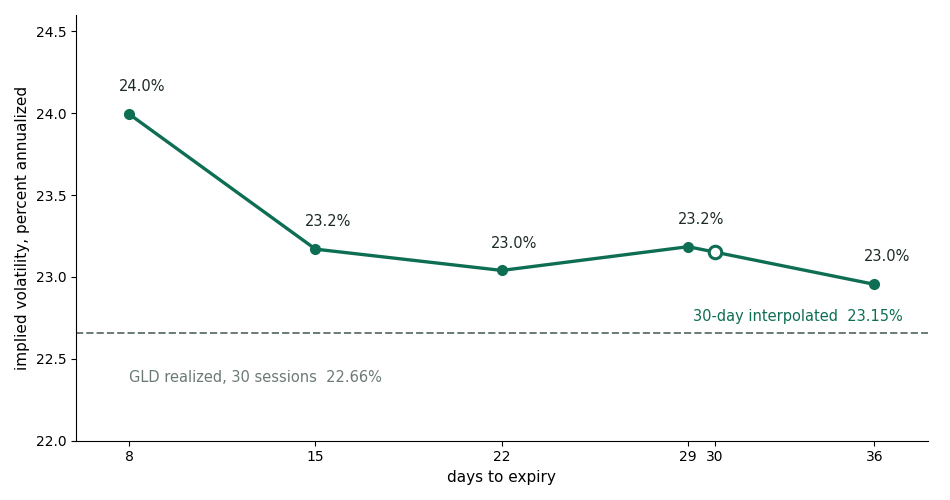
Implied volatility is solved from gold option prices at five expiries against the volatility gold has actually realized over the last thirty sessions.
Transferring external data into MetaTrader 5
We have the number. Now it has to reach the terminal.
MQL5 has a function called WebRequest that fetches a URL. The Python script writes a small JSON file, the file lives at a public address, and MetaTrader reads it like any other file on the web. For this article, the file sits in a public repository, which makes the address permanent and free. Any static host works; the feed is a few hundred bytes.
If you have never published a file this way, a public GitHub repository takes about five minutes: create the repository and mark it public, upload feed.json, then open the file and click "Raw" to get an address of the form raw.githubusercontent.com/yourname/yourrepo/main/feed.json. The "Raw" button is the part to get right, because the ordinary repository address points at a web page wrapped around the file, which MetaTrader cannot read.
Two practical details matter more than they look. MetaTrader blocks web requests by default, so open Tools, then Options, then Expert Advisors, tick "Allow WebRequest for listed URL," and add the host; forget it and WebRequest returns error 4014, which the code below detects and explains. And a feed can go stale: if the machine publishing it stops, the last file just sits there, and a stale reading presented as a live one is worse than no reading at all. So, everything we build carries the publication timestamp and reports its own age.
Automating feed updates with GitHub Actions
A feed that only updates when you remember to run a script isn't much better than running it by hand, and it shouldn't need a computer left switched on. The cheapest solution is to let the repository run the script for itself. GitHub Actions executes a job on a schedule, free on public repositories: it checks out the repository, installs the packages, runs the feed script, and commits the new JSON if it changed. Hourly is plenty for a volatility regime.
name: Update gold volatility feed

# Runs the feed script on a schedule and commits the result, so the JSON that
# MetaTrader reads stays fresh without a machine of your own being left on.
# The times are UTC. Hourly is plenty for a volatility regime.

on:
  schedule:
    - cron: "5 * * * *"      # every hour, five minutes past the hour
  workflow_dispatch:          # adds a "Run workflow" button for manual updates

permissions:
  contents: write             # lets the job commit the refreshed feed

jobs:
  update:
    runs-on: ubuntu-latest
    steps:
      - name: Check out the repository
        uses: actions/checkout@v4

      - name: Set up Python
        uses: actions/setup-python@v5
        with:
          python-version: "3.11"

      - name: Install dependencies
        run: pip install yfinance pandas numpy

      - name: Rebuild the feed
        run: python gold_vrp_feed.py --out feed.json

      - name: Commit the feed if it changed
        run: |
          git config user.name "github-actions[bot]"
          git config user.email "github-actions[bot]@users.noreply.github.com"
          git add feed.json
          git diff --staged --quiet || git commit -m "Update gold volatility feed"
          git push
Save it on GitHub through "Add file", then "Create new file", typing the full path .github/workflows/update-feed.yml into the filename box so the folders are created as you go. Upload gold_vrp_feed.py to the repository as well, since the job runs it, then open the Actions tab and use "Run workflow" to trigger it immediately. A green check and a fresh commit on feed.json mean the loop is closed. The permissions line matters: without it, the job runs but cannot push its result back.
Two things to expect: scheduled runs are not punctual, and the raw file sits behind a cache for a few minutes. Neither matters at a fifteen-minute polling interval, and both are why the panel reports the age of the reading instead of pretending it is live.
Reading the feed from MQL5
Here's the whole bridge as one flat file, meant to be read top to bottom. It fetches the JSON, pulls out the implied volatility, computes realized volatility from the terminal's own gold bars, and prints the comparison. That division of labor matters: the only thing we import is the number the terminal genuinely cannot produce.
//+------------------------------------------------------------------+
//| GoldVRPCheck.mq5 - example script                                |
//| Reads gold's options-implied volatility from a published feed,   |
//| measures realized volatility from the terminal's own gold bars,  |
//| and prints the premium between them. Reads only. Never trades.   |
//+------------------------------------------------------------------+
#property script_show_inputs

input string          FeedURL     = "https://raw.githubusercontent.com/GeneTheStoic/gold-vrp-feed/main/feed.json"; // implied volatility feed
input string          GoldSymbol  = "XAUUSD";    // gold symbol in Market Watch
input ENUM_TIMEFRAMES RVTimeframe = PERIOD_D1;   // timeframe for realized volatility
input int             RVWindow    = 30;          // bars of realized volatility, matches the 30-day implied horizon
input int             TimeoutMs   = 5000;        // web request timeout

#define TRADING_DAYS 252.0

//+------------------------------------------------------------------+
//| Read a numeric field out of a flat JSON object                   |
//+------------------------------------------------------------------+
double JsonNumber(const string json, const string key)
  {
   string tag = "\"" + key + "\"";
   int at = StringFind(json, tag);
   if(at < 0)
      return 0.0;
   int colon = StringFind(json, ":", at + StringLen(tag));
   if(colon < 0)
      return 0.0;
   int end = colon + 1;
   int len = StringLen(json);
   while(end < len)
     {
      ushort ch = StringGetCharacter(json, end);
      if(ch == ',' || ch == '}' || ch == '\n' || ch == '\r')
         break;
      end++;
     }
   string raw = StringSubstr(json, colon + 1, end - colon - 1);
   StringTrimLeft(raw);
   StringTrimRight(raw);
   return StringToDouble(raw);
  }
//+------------------------------------------------------------------+
//| Read a text field out of a flat JSON object                      |
//+------------------------------------------------------------------+
string JsonText(const string json, const string key)
  {
   string tag = "\"" + key + "\"";
   int at = StringFind(json, tag);
   if(at < 0)
      return "";
   int colon = StringFind(json, ":", at + StringLen(tag));
   if(colon < 0)
      return "";
   int open = StringFind(json, "\"", colon + 1);
   if(open < 0)
      return "";
   int close = StringFind(json, "\"", open + 1);
   if(close < 0)
      return "";
   return StringSubstr(json, open + 1, close - open - 1);
  }
//+------------------------------------------------------------------+
//| Convert an ISO 8601 timestamp into a datetime value              |
//+------------------------------------------------------------------+
datetime FeedTime(const string iso)
  {
   string s = iso;
   StringReplace(s, "-", ".");
   StringReplace(s, "T", " ");
   StringReplace(s, "Z", "");
   return StringToTime(s);
  }
//+------------------------------------------------------------------+
//| Annualized standard deviation of log returns, from the terminal  |
//+------------------------------------------------------------------+
double RealizedVolatility(const string symbol, ENUM_TIMEFRAMES tf, const int window)
  {
   double close[];
   int need = window + 1;
   if(CopyClose(symbol, tf, 0, need, close) < need)
      return 0.0;
   ArraySetAsSeries(close, true);

   double sum = 0.0, sumsq = 0.0;
   int n = 0;
   for(int i = 0; i < window; i++)
     {
      if(close[i] <= 0.0 || close[i + 1] <= 0.0)
         continue;
      double r = MathLog(close[i] / close[i + 1]);
      sum += r;
      sumsq += r * r;
      n++;
     }
   if(n < 2)
      return 0.0;

   double mean = sum / n;
   double variance = (sumsq - n * mean * mean) / (n - 1);
   if(variance < 0.0)
      variance = 0.0;
   return MathSqrt(variance) * MathSqrt(TRADING_DAYS);
  }
//+------------------------------------------------------------------+
//| Plain-language reading of the implied to realized ratio          |
//+------------------------------------------------------------------+
string RegimeText(const double ratio)
  {
   if(ratio >= 1.20)
      return "Protection is expensive: options price far more movement than gold has delivered";
   if(ratio >= 1.05)
      return "A premium is priced in: options expect more movement than gold has delivered";
   if(ratio >= 0.95)
      return "Expectations are in line with what gold has actually been doing";
   return "Realized is outrunning implied: gold is moving more than options expected";
  }
//+------------------------------------------------------------------+
//| Download the feed; returns an empty string on failure            |
//+------------------------------------------------------------------+
string DownloadFeed(const string url, const int timeout)
  {
   char post[], result[];
   string result_headers;

   ResetLastError();
   int status = WebRequest("GET", url, "", timeout, post, result, result_headers);
   if(status == -1)
     {
      int err = GetLastError();
      if(err == 4014)
         Print("This URL is not allowed. Open Tools -> Options -> Expert Advisors, ",
               "tick 'Allow WebRequest for listed URL' and add: ", url);
      else
         Print("Download failed, error ", err);
      return "";
     }
   if(status != 200)
     {
      Print("Feed returned HTTP status ", status);
      return "";
     }
   return CharArrayToString(result, 0, WHOLE_ARRAY, CP_UTF8);
  }
//+------------------------------------------------------------------+
//| Script program start function                                    |
//+------------------------------------------------------------------+
void OnStart()
  {
//--- 1. fetch the implied volatility that the terminal cannot compute
   string json = DownloadFeed(FeedURL, TimeoutMs);
   if(json == "")
      return;

   double impliedVol = JsonNumber(json, "iv_30d");
   string feedSymbol = JsonText(json, "symbol");
   string updated = JsonText(json, "updated_utc");
   if(impliedVol <= 0.0)
     {
      Print("The feed did not contain a usable implied volatility.");
      return;
     }

//--- 2. measure realized volatility locally, from the broker's own bars
   double realizedVol = RealizedVolatility(GoldSymbol, RVTimeframe, RVWindow);
   if(realizedVol <= 0.0)
     {
      Print("Not enough history for ", GoldSymbol, ". Open its chart once and retry.");
      return;
     }

//--- 3. compare the two
   double premium = impliedVol - realizedVol;
   double ratio = impliedVol / realizedVol;

//--- 4. how old is the reading
   datetime stamp = FeedTime(updated);
   int ageMinutes = (stamp > 0 ? (int)((TimeGMT() - stamp) / 60) : -1);

   PrintFormat("Implied volatility (%s options, 30 days): %.2f%%",
               feedSymbol, impliedVol * 100.0);
   PrintFormat("Realized volatility (%s, last %d %s bars): %.2f%%",
               GoldSymbol, RVWindow, EnumToString(RVTimeframe), realizedVol * 100.0);
   PrintFormat("Premium: %+.2f volatility points   Ratio: %.2f",
               premium * 100.0, ratio);
   Print(RegimeText(ratio));
   if(ageMinutes >= 0)
      PrintFormat("Feed updated %d minutes ago (%s UTC).", ageMinutes, updated);
  }
//+------------------------------------------------------------------+
The feed is a flat object with known keys, so rather than pulling in a parsing library, we find the key, skip to the colon, and read to the next comma or brace. Forty lines, no dependencies, and it fails by returning zero rather than crashing. For a monitor that treats a missing value as no reading, that is an acceptable trade, though in a larger system I would want stricter validation, because quiet parsing can hide malformed data.
Save it in MQL5\Scripts\GoldVRPCheck\, compile with F7, and drop it on a gold chart. This is what it prints.
Implied volatility (GLD options, 30 days): 23.11%
Realized volatility (XAUUSD, last 30 PERIOD_D1 bars): 22.61%
Premium: +0.50 volatility points    Ratio: 1.02
Expectations are in line with what gold has actually been doing
Feed updated 22 minutes ago (2026-08-06T19:06:38Z UTC).
The implied figure came out of the options market through Python and a URL; the realized figure was computed inside the terminal from XAUUSD bars. Neither number could have produced the other, and the comparison between them is the thing that was missing.
Methodological limits
Before the results, what this measurement is and is not.
GLD is a proxy for gold, not gold itself: the ETF trades its own hours with its own frictions, and its implied volatility is not the volatility of spot-gold options.
Both sides now sit on a thirty-day horizon, but the realized side remains a backward-looking estimate standing in for a forward-looking expectation.
This is a near-the-money measure, not the model-free implied variance built from the whole surface that the academic treatment uses.
The Black-Scholes inversion is an approximation: European treatment, a flat short-rate, and no early exercise effects. That is acceptable for short-dated near-the-money contracts feeding a monitor.
The output is context, not a signal. It says nothing about direction, and a stretched reading can stay stretched for weeks.
Measurement results on gold
At the time of writing, gold options were implying 23.11 percent annualized volatility over a thirty-day horizon. XAUUSD had realized 22.61 percent over the previous thirty daily bars. A ratio of 1.02 and a premium of plus 0.50 volatility points, both sides measured over the same window.
So, the options market is charging about two percent more movement than gold has been delivering: a small, ordinary premium, which is what the literature says you should expect most of the time. I'm keeping that result rather than waiting for a more flattering one, because a tool that tells you conditions are ordinary is doing its job, and knowing the premium is thin is useful if you were about to assume gold options were expensive because gold has been in the news.
Something did happen while I was writing, and it shows the mechanism in miniature. Gold sold off through the session. Implied volatility rose, because that's what happens when people start buying protection, while realized volatility barely moved, because a month of history doesn't change much in two hours. The premium widened. The options market repriced expected movement before the price history had any way of knowing something had changed, and that gap opening up is the entire reason to watch this number.
Continuous monitoring with an MQL5 service
A script you run by hand has an obvious flaw: volatility regimes change on their own schedule, usually while you're doing something else.
MQL5 has a program type built for this. A service lives in MQL5\Services, starts with the terminal, and runs in its own thread, so a looping service doesn't slow anything else down. The only event it handles is OnStart, and inside OnStart you're allowed to loop forever.
So the service does three things on a timer. It reads the feed and recomputes the comparison. It keeps a small panel current on one of your charts: what the relationship means, the two volatilities behind it, and how old the reading is, saying so in words when the feed passes the staleness threshold. And when the regime changes, it sends a push notification to your phone.
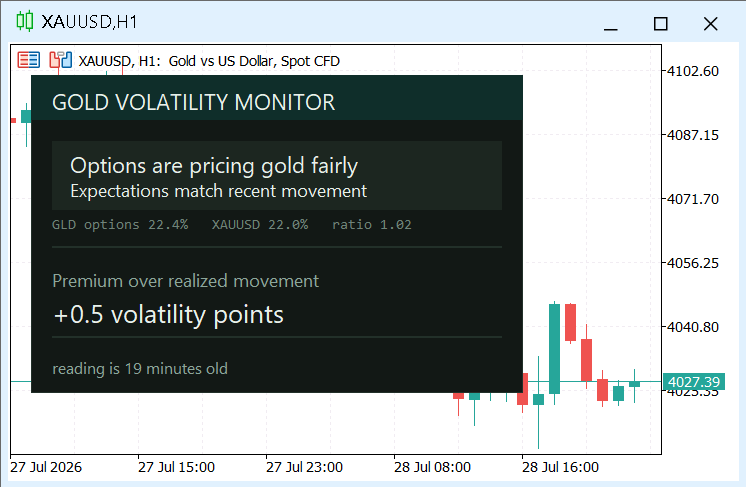
The panel that is kept on the chart by the service: what the comparison means, the two volatilities behind it, and how old the reading is.
The alerting is deliberately conservative: it notifies on a change of state, then waits out a cooldown, because an alert that arrives forty times a day is an alert you stop reading. Since an alerting tool is worthless if the alerts never arrive, the service checks at startup whether notifications are enabled, warns in the journal if they are not, and sends one confirmation message through the same channel the regime alerts will use.

The confirmation the service sends when it starts so the notification path is verified before it is needed. Regime alerts arrive through the same channel.
Project structure
Four files, easiest to understand from the outside in.
gold_vrp_feed.py is the only piece that touches the options market. It solves implied volatility from option prices and publishes one JSON object, on a schedule, wherever you like.
GoldVRPMonitor.mqh holds the class CVolatilityEngine: it fetches the feed, parses it, measures realized volatility from the terminal's own bars, computes the ratio, classifies the regime, and produces the sentence used for notifications. If you want any of this inside your own indicator or Expert Advisor, this is the file you lift.
GoldVRPCheck.mq5 is the flat example script you've already seen. GoldVRPMonitorService.mq5 is display and delivery: it owns the loop, the panel, and the alerts, and contains no volatility mathematics of its own.
The split is the point. The measurement lives in one place, so the panel, the phone alert, and the printed output can't disagree with each other.
The volatility engine class
The class holds its configuration, its results, and a few private helpers.
//+------------------------------------------------------------------+
//| GoldVRPMonitor.mqh                                               |
//| CVolatilityEngine: compares the volatility gold's options expect |
//| with the volatility gold is actually delivering.                 |
//| Implied volatility arrives from a published feed, realized       |
//| volatility is measured from the terminal's own bars.             |
//| Reads only. Never trades.                                        |
//+------------------------------------------------------------------+
#ifndef GOLD_VRP_MONITOR_MQH
#define GOLD_VRP_MONITOR_MQH

#define GVRP_TRADING_DAYS 252.0

//+------------------------------------------------------------------+
//| How the premium reads, from expensive protection to underpriced  |
//+------------------------------------------------------------------+
enum ENUM_VOL_REGIME
  {
   REGIME_NONE,        // no usable reading yet
   REGIME_EXPENSIVE,   // options price far more movement than gold delivers
   REGIME_PREMIUM,     // options price somewhat more movement
   REGIME_INLINE,      // expectations match recent movement
   REGIME_UNDERPRICED  // gold is moving more than options expected
  };

//+------------------------------------------------------------------+
//| Volatility comparison engine                                     |
//+------------------------------------------------------------------+
class CVolatilityEngine
  {
private:
   //--- configuration
   string            m_url;
   string            m_symbol;
   ENUM_TIMEFRAMES   m_tf;
   int               m_window;
   int               m_timeout;
   double            m_expensive;
   double            m_premium;
   double            m_inline;

   //--- results
   double            m_impliedVol;
   double            m_realizedVol;
   double            m_ratio;
   ENUM_VOL_REGIME   m_regime;
   string            m_feedSymbol;
   string            m_updated;
   int               m_ageMinutes;
   string            m_lastError;
The engine classifies the regime once, and everything downstream asks for the classification, which is why the panel and the push message can never drift apart. The private helpers do the unglamorous work: reading fields out of the JSON, converting the ISO timestamp into something MQL5 can subtract, and downloading the feed with the error 4014 check.
  //--- read a numeric field out of a flat JSON object
   double            JsonNumber(const string json, const string key)
     {
      string tag = "\"" + key + "\"";
      int at = StringFind(json, tag);
      if(at < 0)
         return 0.0;
      int colon = StringFind(json, ":", at + StringLen(tag));
      if(colon < 0)
         return 0.0;
      int end = colon + 1;
      int len = StringLen(json);
      while(end < len)
        {
         ushort ch = StringGetCharacter(json, end);
         if(ch == ',' || ch == '}' || ch == '\n' || ch == '\r')
            break;
         end++;
        }
      string raw = StringSubstr(json, colon + 1, end - colon - 1);
      StringTrimLeft(raw);
      StringTrimRight(raw);
      return StringToDouble(raw);
     }
   //--- read a text field out of a flat JSON object
   string            JsonText(const string json, const string key)
     {
      string tag = "\"" + key + "\"";
      int at = StringFind(json, tag);
      if(at < 0)
         return "";
      int colon = StringFind(json, ":", at + StringLen(tag));
      if(colon < 0)
         return "";
      int open = StringFind(json, "\"", colon + 1);
      if(open < 0)
         return "";
      int close = StringFind(json, "\"", open + 1);
      if(close < 0)
         return "";
      return StringSubstr(json, open + 1, close - open - 1);
     }
   //--- convert an ISO 8601 timestamp into a datetime value
   datetime          FeedTime(const string iso)
     {
      string s = iso;
      StringReplace(s, "-", ".");
      StringReplace(s, "T", " ");
      StringReplace(s, "Z", "");
      return StringToTime(s);
     }
 //--- download the feed; empty string means the reason is in m_lastError
   string            Download()
     {
      char post[], result[];
      string result_headers;

      ResetLastError();
      int status = WebRequest("GET", m_url, "", m_timeout, post, result, result_headers);
      if(status == -1)
        {
         int err = GetLastError();
         if(err == 4014)
            m_lastError = "URL not allowed in Tools -> Options -> Expert Advisors";
         else
            m_lastError = "download failed, error " + IntegerToString(err);
         return "";
        }
      if(status != 200)
        {
         m_lastError = "feed returned HTTP status " + IntegerToString(status);
         return "";
        }
      return CharArrayToString(result, 0, WHOLE_ARRAY, CP_UTF8);
     }
Then realized volatility from the terminal's own bars: log returns, sample standard deviation, annualized by the square root of 252. It is the same calculation the Python side performs on GLD, which is what makes the two figures comparable.
  //--- annualized standard deviation of log returns, from the terminal's bars
   double            Realized()
     {
      double close[];
      int need = m_window + 1;
      if(CopyClose(m_symbol, m_tf, 0, need, close) < need)
        {
         m_lastError = "not enough history for " + m_symbol;
         return 0.0;
        }
      ArraySetAsSeries(close, true);

      double sum = 0.0, sumsq = 0.0;
      int n = 0;
      for(int i = 0; i < m_window; i++)
        {
         if(close[i] <= 0.0 || close[i + 1] <= 0.0)
            continue;
         double r = MathLog(close[i] / close[i + 1]);
         sum += r;
         sumsq += r * r;
         n++;
        }
      if(n < 2)
        {
         m_lastError = "not enough usable bars for " + m_symbol;
         return 0.0;
        }

      double mean = sum / n;
      double variance = (sumsq - n * mean * mean) / (n - 1);
      if(variance < 0.0)
         variance = 0.0;
      return MathSqrt(variance) * MathSqrt(GVRP_TRADING_DAYS);
     }
   //--- classify the implied to realized ratio
   ENUM_VOL_REGIME   Classify(const double ratio)
     {
      if(ratio >= m_expensive)
         return REGIME_EXPENSIVE;
      if(ratio >= m_premium)
         return REGIME_PREMIUM;
      if(ratio >= m_inline)
         return REGIME_INLINE;
      return REGIME_UNDERPRICED;
     }
And the public surface. Configure it, set the thresholds, call Compute, then ask for whatever you need.
public:
                     CVolatilityEngine() : m_url(""), m_symbol("XAUUSD"), m_tf(PERIOD_D1),
                                           m_window(30), m_timeout(5000),
                                           m_expensive(1.20), m_premium(1.05), m_inline(0.95),
                                           m_impliedVol(0), m_realizedVol(0), m_ratio(0),
                                           m_regime(REGIME_NONE), m_feedSymbol(""),
                                           m_updated(""), m_ageMinutes(-1), m_lastError("")
     {
     }
   //--- feed location and the local measurement to compare it against
   void              Configure(const string url, const string symbol,
                               const ENUM_TIMEFRAMES tf, const int window, const int timeout)
     {
      m_url = url;
      m_symbol = symbol;
      m_tf = tf;
      m_window = (window < 5 ? 5 : window);
      m_timeout = (timeout < 1000 ? 1000 : timeout);
     }
   //--- the three ratio boundaries that separate the four regimes
   void              SetThresholds(const double expensive, const double premium,
                                   const double inLine)
     {
      m_expensive = expensive;
      m_premium = premium;
      m_inline = inLine;
     }
   //--- fetch, measure, compare; false means LastError() explains why
   bool              Compute()
     {
      m_lastError = "";
      string json = Download();
      if(json == "")
         return false;

      m_impliedVol = JsonNumber(json, "iv_30d");
      m_feedSymbol = JsonText(json, "symbol");
      m_updated = JsonText(json, "updated_utc");
      if(m_impliedVol <= 0.0)
        {
         m_lastError = "feed carried no usable implied volatility";
         return false;
        }

      m_realizedVol = Realized();
      if(m_realizedVol <= 0.0)
         return false;

      m_ratio = m_impliedVol / m_realizedVol;
      m_regime = Classify(m_ratio);

      datetime stamp = FeedTime(m_updated);
      m_ageMinutes = (stamp > 0 ? (int)((TimeGMT() - stamp) / 60) : -1);
      return true;
     }
   //--- results
   double            ImpliedVol()   const { return m_impliedVol; }             // annualized, 0.22 = 22%
   double            RealizedVol()  const { return m_realizedVol; }            // annualized, from local bars
   double            Premium()      const { return m_impliedVol - m_realizedVol; } // volatility points
   double            Ratio()        const { return m_ratio; }                  // implied divided by realized
   ENUM_VOL_REGIME   Regime()       const { return m_regime; }                 // current classification
   string            FeedSymbol()   const { return m_feedSymbol; }             // instrument behind the options
   string            UpdatedUTC()   const { return m_updated; }                // feed timestamp as published
   int               AgeMinutes()   const { return m_ageMinutes; }             // -1 when unknown
   string            LastError()    const { return m_lastError; }              // reason Compute() failed
Compute is strict about failure. If the download fails, or the feed carries no usable volatility, or there isn't enough local history, it returns false and leaves the reason in LastError, so callers can show the reason instead of presenting a stale number as current.
   //--- headline for the panel: what the ratio means, in words
   string            RegimeHeadline()
     {
      switch(m_regime)
        {
         case REGIME_EXPENSIVE:
            return "Protection is expensive";
         case REGIME_PREMIUM:
            return "A premium is priced in";
         case REGIME_INLINE:
            return "Options are pricing gold fairly";
         case REGIME_UNDERPRICED:
            return "Gold is moving more than expected";
         default:
            return "No reading";
        }
     }
   //--- the second line, explaining the headline
   string            RegimeExplain()
     {
      switch(m_regime)
        {
         case REGIME_EXPENSIVE:
            return "Options expect far more movement than gold delivers";
         case REGIME_PREMIUM:
            return "Options expect more movement than gold delivers";
         case REGIME_INLINE:
            return "Expectations match recent movement";
         case REGIME_UNDERPRICED:
            return "Realized movement is outrunning expectations";
         default:
            return "Waiting for the feed";
        }
     }
   //--- one plain sentence, short enough for a push notification
   string            Summary()
     {
      return StringFormat("%s. Options imply %.1f%%, %s has realized %.1f%% (ratio %.2f).",
                          RegimeHeadline(), m_impliedVol * 100.0, m_symbol,
                          m_realizedVol * 100.0, m_ratio);
     }
  };

#endif // GOLD_VRP_MONITOR_MQH
//+------------------------------------------------------------------+
Summary produces one sentence short enough for a lock screen, which is why it says what the reading means before giving the numbers.
The service implementation
One line makes this a service rather than a script.
//+------------------------------------------------------------------+
//| GoldVRPMonitorService.mq5                                        |
//| MetaTrader 5 service. Runs in the background with no chart of    |
//| its own, compares the volatility gold's options expect with the  |
//| volatility gold is delivering, keeps a small panel on an open    |
//| chart, and sends a push notification when the regime changes.    |
//| Reads only. Never trades.                                        |
//+------------------------------------------------------------------+
#property service
#property version   "1.00"
#property description "Background gold volatility monitor: chart panel plus regime alerts."

#include "GoldVRPMonitor.mqh"

//--- feed and measurement
input string          FeedURL       = "https://raw.githubusercontent.com/GeneTheStoic/gold-vrp-feed/main/feed.json"; // implied volatility feed
input string          GoldSymbol    = "XAUUSD";    // gold symbol in Market Watch
input ENUM_TIMEFRAMES RVTimeframe   = PERIOD_D1;   // timeframe for realized volatility
input int             RVWindow      = 30;          // bars of realized volatility, matches the 30-day implied horizon
input int             TimeoutMs     = 5000;        // web request timeout
//--- monitoring
input int             CheckMinutes  = 15;          // how often to re-read the feed
input int             StaleMinutes  = 180;         // warn when the feed is older than this
//--- panel
input bool            ShowPanel     = true;        // draw the panel on a chart
input string          PanelSymbol   = "";          // chart to draw on ("" = first open chart)
input int             PanelX        = 20;          // panel x
input int             PanelY        = 30;          // panel y
input double          UIScale       = 1.0;         // interface scale
//--- regime boundaries, as a ratio of implied to realized volatility
input double          RatioExpensive = 1.20;       // at or above this: protection is expensive
input double          RatioPremium   = 1.05;       // at or above this: a premium is priced in
input double          RatioInLine    = 0.95;       // at or above this: expectations are fair
//--- alerts
input bool            AlertOnChange = true;        // push when the regime changes
input int             CooldownMinutes = 60;        // minimum minutes between repeat pushes
input bool            StartupPush   = true;        // send a test push on start

//--- palette
#define CBG      C'18,24,21'
#define CBORD    C'34,48,41'
#define CHEAD    C'15,46,42'
#define CINK     C'232,240,234'
#define CMUT     C'140,166,154'
#define CKICK    C'111,131,120'
#define CTRACK   C'28,38,32'
#define CGREEN   C'52,201,138'
#define CAMBER   C'230,184,75'
#define CRED     C'229,86,86'
#define CFILLG   C'28,56,46'
#define CFILLA   C'58,50,26'
#define CFILLR   C'58,32,32'
#define PFX      "GVRP_"
#define UIF      "Segoe UI"
#define MONO     "Consolas"
The regime boundaries are inputs rather than constants on purpose: 1.20, 1.05, and 0.95 are reasonable for gold, and they aren't laws. A service has no chart of its own, but it can draw on any open chart, because every object function in MQL5 takes a chart identifier as its first argument. Indicators pass zero, meaning "my own chart"; a service passes the identifier of a chart it chose. That single detail is what lets a background program keep a live panel in front of you.
//--- DPI scaling
double gScl = 1.0, gFscl = 1.0;

//+------------------------------------------------------------------+
//| Scale a distance by the DPI factor                               |
//+------------------------------------------------------------------+
int S(double v) { return (int)MathRound(v * gScl); }
//+------------------------------------------------------------------+
//| Scale a font size by the UI scale factor                         |
//+------------------------------------------------------------------+
int FS(int p) { int f = (int)MathRound(p * gFscl); return (f < 6 ? 6 : f); }
//+------------------------------------------------------------------+
//| Create a rectangle label object on the given chart               |
//+------------------------------------------------------------------+
void RC(long id, string n)
  {
   string nm = PFX + n;
   if(ObjectFind(id, nm) < 0)
      ObjectCreate(id, nm, OBJ_RECTANGLE_LABEL, 0, 0, 0);
   ObjectSetInteger(id, nm, OBJPROP_CORNER, CORNER_LEFT_UPPER);
   ObjectSetInteger(id, nm, OBJPROP_BORDER_TYPE, BORDER_FLAT);
   ObjectSetInteger(id, nm, OBJPROP_BACK, false);
   ObjectSetInteger(id, nm, OBJPROP_SELECTABLE, false);
   ObjectSetInteger(id, nm, OBJPROP_HIDDEN, true);
  }
//+------------------------------------------------------------------+
//| Position, size and color a rectangle label                       |
//+------------------------------------------------------------------+
void setRect(long id, string n, int x, int y, int w, int h, color bg, color bd = clrNONE)
  {
   RC(id, n);
   string nm = PFX + n;
   ObjectSetInteger(id, nm, OBJPROP_XDISTANCE, x);
   ObjectSetInteger(id, nm, OBJPROP_YDISTANCE, y);
   ObjectSetInteger(id, nm, OBJPROP_XSIZE, MathMax(1, w));
   ObjectSetInteger(id, nm, OBJPROP_YSIZE, MathMax(1, h));
   ObjectSetInteger(id, nm, OBJPROP_BGCOLOR, bg);
   ObjectSetInteger(id, nm, OBJPROP_COLOR, (bd == clrNONE ? bg : bd));
   ObjectSetInteger(id, nm, OBJPROP_TIMEFRAMES, OBJ_ALL_PERIODS);
  }
//+------------------------------------------------------------------+
//| Create or update a text label on the given chart                 |
//+------------------------------------------------------------------+
void L(long id, string n, int x, int y, string text, color clr, int size,
       string font = UIF, ENUM_ANCHOR_POINT a = ANCHOR_LEFT_UPPER)
  {
   string nm = PFX + n;
   if(ObjectFind(id, nm) < 0)
      ObjectCreate(id, nm, OBJ_LABEL, 0, 0, 0);
   ObjectSetInteger(id, nm, OBJPROP_CORNER, CORNER_LEFT_UPPER);
   ObjectSetInteger(id, nm, OBJPROP_ANCHOR, a);
   ObjectSetInteger(id, nm, OBJPROP_XDISTANCE, x);
   ObjectSetInteger(id, nm, OBJPROP_YDISTANCE, y);
   ObjectSetString(id, nm, OBJPROP_TEXT, text);
   ObjectSetInteger(id, nm, OBJPROP_COLOR, clr);
   ObjectSetInteger(id, nm, OBJPROP_FONTSIZE, size);
   ObjectSetString(id, nm, OBJPROP_FONT, font);
   ObjectSetInteger(id, nm, OBJPROP_SELECTABLE, false);
   ObjectSetInteger(id, nm, OBJPROP_HIDDEN, true);
   ObjectSetInteger(id, nm, OBJPROP_TIMEFRAMES, OBJ_ALL_PERIODS);
  }
//+------------------------------------------------------------------+
//| Hide a text label                                                |
//+------------------------------------------------------------------+
void hideL(long id, string n)
  {
   string nm = PFX + n;
   if(ObjectFind(id, nm) >= 0)
      ObjectSetInteger(id, nm, OBJPROP_TIMEFRAMES, OBJ_NO_PERIODS);
  }
//+------------------------------------------------------------------+
//| Color matching the current regime                                |
//+------------------------------------------------------------------+
color RegimeColor(const ENUM_VOL_REGIME regime)
  {
   switch(regime)
     {
      case REGIME_EXPENSIVE:
         return CRED;
      case REGIME_PREMIUM:
         return CAMBER;
      case REGIME_INLINE:
         return CINK;
      case REGIME_UNDERPRICED:
         return CGREEN;
      default:
         return CMUT;
     }
  }
//+------------------------------------------------------------------+
//| Band fill matching the current regime                            |
//+------------------------------------------------------------------+
color RegimeFill(const ENUM_VOL_REGIME regime)
  {
   switch(regime)
     {
      case REGIME_EXPENSIVE:
         return CFILLR;
      case REGIME_PREMIUM:
         return CFILLA;
      case REGIME_UNDERPRICED:
         return CFILLG;
      default:
         return CTRACK;
     }
  }
//+------------------------------------------------------------------+
//| Find the chart to draw on                                        |
//+------------------------------------------------------------------+
long FindChart()
  {
   long id = ChartFirst();
   long first = id;
   while(id >= 0)
     {
      if(PanelSymbol == "" || ChartSymbol(id) == PanelSymbol)
         return id;
      id = ChartNext(id);
     }
   return first;
  }
The panel puts the meaning first and the mathematics second: the headline in words, the monospaced line with both instruments and both volatilities, and the age of the reading, which turns amber and labels itself stale when the feed has gone old.
//+------------------------------------------------------------------+
//| Draw the panel on the given chart                                |
//+------------------------------------------------------------------+
void DrawPanel(long id, CVolatilityEngine &eng, bool hasData)
  {
   int PX = PanelX, PY = PanelY;
   int pad = S(14), colW = S(300);
   int Wpx = pad + colW + pad;
   int hdH = S(30);

   setRect(id, "bg", PX, PY, Wpx, hdH + S(40), CBG, CBORD);
   setRect(id, "hd", PX, PY, Wpx, hdH, CHEAD);
   L(id, "title", PX + pad, PY + S(7), "GOLD VOLATILITY MONITOR", CINK, FS(11), UIF);

   if(!hasData)
     {
      hideL(id, "head");
      hideL(id, "headsub");
      hideL(id, "tech");
      hideL(id, "pr_k");
      hideL(id, "pr_v");
      hideL(id, "age");
      L(id, "empty", PX + pad, PY + hdH + S(12), "Waiting for the volatility feed", CINK, FS(9), UIF);
      L(id, "empty2", PX + pad, PY + hdH + S(30), eng.LastError(), CMUT, FS(8), UIF);
      setRect(id, "bg", PX, PY, Wpx, hdH + S(52), CBG, CBORD);
      ChartRedraw(id);
      return;
     }
   hideL(id, "empty");
   hideL(id, "empty2");

   int y = PY + hdH + S(14);
   int xL = PX + pad;
   color rc = RegimeColor(eng.Regime());

//--- headline band: what the comparison means, in words
   int heroH = S(46);
   setRect(id, "hero_tk", xL, y, colW, heroH, CTRACK);
   double fill = (eng.Ratio() - 0.80) / 0.60;
   if(fill < 0.05)
      fill = 0.05;
   if(fill > 1.0)
      fill = 1.0;
   setRect(id, "hero_fl", xL, y, (int)MathMax(S(3), colW * fill), heroH, RegimeFill(eng.Regime()));
   L(id, "head", xL + S(12), y + S(15), eng.RegimeHeadline(), CINK, FS(11), UIF, ANCHOR_LEFT);
   L(id, "headsub", xL + S(12), y + S(32), eng.RegimeExplain(), rc, FS(9), UIF, ANCHOR_LEFT);
   y += heroH + S(4);

//--- the two volatilities behind the headline
   L(id, "tech", xL, y,
     StringFormat("%s options %.1f%%   %s %.1f%%   ratio %.2f",
                  eng.FeedSymbol(), eng.ImpliedVol() * 100.0,
                  GoldSymbol, eng.RealizedVol() * 100.0, eng.Ratio()),
     CKICK, FS(7), MONO);
   y += S(20);

   setRect(id, "d1", xL, y, colW, S(1), CBORD);
   y += S(14);

//--- the premium itself, in volatility points
   L(id, "pr_k", xL, y, "Premium over realized movement", CMUT, FS(9), UIF);
   y += S(18);
   L(id, "pr_v", xL, y,
     StringFormat("%+.1f volatility points", eng.Premium() * 100.0), CINK, FS(13), UIF);
   y += S(28);

   setRect(id, "d2", xL, y, colW, S(1), CBORD);
   y += S(14);

//--- how fresh the reading is
   int age = eng.AgeMinutes();
   bool stale = (age < 0 || age > StaleMinutes);
   string ageText = (age < 0 ? "reading age unknown"
                    : (stale ? StringFormat("STALE: reading is %d minutes old, treat with caution", age)
                             : StringFormat("reading is %d minutes old", age)));
   L(id, "age", xL, y, ageText, (stale ? CAMBER : CMUT), FS(8), UIF);
   y += S(24);

   int H = (y - PY);
   setRect(id, "bg", PX, PY, Wpx, H, CBG, CBORD);
   setRect(id, "hd", PX, PY, Wpx, hdH, CHEAD);
   ChartRedraw(id);
  }
And the loop. Read, redraw, compare the regime against the previous one, and notify only on a genuine change after the cooldown. Charts can be closed while a service is running, so each cycle checks that the panel's chart still exists, and the service removes its own objects when it stops.
//+------------------------------------------------------------------+
//| Service entry point: background monitoring loop                  |
//+------------------------------------------------------------------+
void OnStart()
  {
//--- DPI scaling for the panel
   double dpi = (double)TerminalInfoInteger(TERMINAL_SCREEN_DPI);
   if(dpi <= 0)
      dpi = 96;
   gScl = (dpi / 96.0) * (UIScale > 0 ? UIScale : 1.0);
   gFscl = (UIScale > 0 ? UIScale : 1.0);

//--- make sure pushes can actually reach the phone
   if(!TerminalInfoInteger(TERMINAL_NOTIFICATIONS_ENABLED))
      Print("Push notifications are DISABLED. Enable them in Tools -> Options -> ",
            "Notifications and enter your MetaQuotes ID, or no alert will arrive.");
   else
      if(StartupPush)
        {
         if(SendNotification("Gold volatility monitor started. You will get an alert when the regime changes."))
            Print("Startup push sent. Check your phone.");
         else
            Print("Startup push FAILED, error ", GetLastError(),
                  ". Check your MetaQuotes ID in Tools -> Options -> Notifications.");
        }

   CVolatilityEngine engine;
   engine.Configure(FeedURL, GoldSymbol, RVTimeframe, RVWindow, TimeoutMs);
   engine.SetThresholds(RatioExpensive, RatioPremium, RatioInLine);

   ENUM_VOL_REGIME lastRegime = REGIME_NONE;
   datetime lastAlert = 0;
   long chart = -1;
   int sleepSec = (CheckMinutes < 1 ? 1 : CheckMinutes) * 60;

   Print("Gold volatility monitor running. Reading the feed every ", CheckMinutes, " minutes.");

   while(!IsStopped())
     {
      bool ok = (TerminalInfoInteger(TERMINAL_CONNECTED) && engine.Compute());
      if(!ok && engine.LastError() != "")
         Print("Reading failed: ", engine.LastError());

      //--- keep the panel on a live chart, charts can be closed under us
      if(ShowPanel)
        {
         if(chart < 0 || ChartPeriod(chart) == 0)
            chart = FindChart();
         if(chart >= 0)
            DrawPanel(chart, engine, ok);
        }

      if(ok)
        {
         bool changed = (engine.Regime() != lastRegime && lastRegime != REGIME_NONE);
         bool cooled = ((long)TimeCurrent() - (long)lastAlert >= (long)CooldownMinutes * 60);

         //--- notify only when the regime actually changes, and not too often
         if(AlertOnChange && changed && cooled)
           {
            string msg = "GOLD VOLATILITY: " + engine.Summary();
            if(SendNotification(msg))
               lastAlert = TimeCurrent();
            else
               Print("Push failed, error ", GetLastError());
            Print(msg);
           }
         if(engine.Regime() != lastRegime)
            Print("Regime: ", engine.RegimeHeadline(), " (", engine.Summary(), ")");
         lastRegime = engine.Regime();
        }

      Sleep(1000 * sleepSec);
     }

//--- clean the panel off the chart when the service stops
   if(chart >= 0 && ChartPeriod(chart) > 0)
     {
      ObjectsDeleteAll(chart, PFX);
      ChartRedraw(chart);
     }
   Print("Gold volatility monitor stopped.");
  }
//+------------------------------------------------------------------+
Put GoldVRPMonitorService.mq5 and GoldVRPMonitor.mqh together in MQL5\Services\GoldVRPMonitor\, or unpack the attached archive into the terminal data folder. Compile with F7, then find Services at the bottom of the Navigator, right-click, Add Service, and pick it.
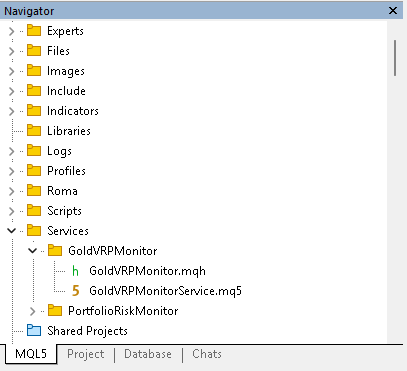
The service in the Navigator.
For notifications to arrive, the terminal needs your MetaQuotes ID. Find it in the mobile app under Settings and enter it in Tools, Options, Notifications.
Conclusion
The technical path is simple and practical: invert Black-Scholes on live option prices to recover implied volatility, publish that figure as a tiny JSON file, fetch it from MetaTrader with WebRequest, and compare it to realized volatility computed locally from your broker's bars. The implementation delivered in the article comprises three working pieces you can read and modify:
- a Python feed that solves implied volatility from GLD option prices and interpolates a 30-day value;
- an example MQL5 script that reads the feed and prints the comparison;
- a background MQL5 service that keeps a chart panel current, reports reading age, and sends push notifications on regime changes.
What you get is not a buy or sell signal but a reliable, money-backed second opinion on expected movement. Use it to question oversized positions in apparently quiet markets, to sanity-check the price you pay for options, and as a crude event-sensitive warning when implied and realized diverge, though not every event produces a clean signal. Remember the limits: GLD is a proxy for spot gold, this is a near-the-money, 30-day measure, and the solver uses standard Black-Scholes approximations. The tool's value lies in transparent, automated context, and in being auditable and configurable, so you can adapt the thresholds and horizons to your workflow.
Background and sources
The variance risk premium isn't my idea, and it has been studied properly. Carr and Wu gave it its canonical treatment across markets in 2009. [1] Bollerslev, Tauchen, and Zhou showed in the same year that the gap between implied and realized variance carries predictive information about returns [2], and Bollerslev, Todorov, and Xu later separated out the tail component of that premium. [3] Extracting implied volatility from an option price by inverting the pricing model goes back to Black and Scholes in 1973. [4]
The framing here follows the options and volatility theory I studied at Nicolaus Copernicus University. If you read one of these, read Carr and Wu, which lays out both what the premium is and how carefully it has to be measured.
References
[1] Carr, P. and Wu, L. (2009). Variance Risk Premiums. The Review of Financial Studies, 22(3), 1311 to 1341.
[2] Bollerslev, T., Tauchen, G., and Zhou, H. (2009). Expected Stock Returns and Variance Risk Premia. The Review of Financial Studies, 22(11), 4463 to 4492.
[3] Bollerslev, T., Todorov, V., and Xu, L. (2015). Tail Risk Premia and Return Predictability. Journal of Financial Economics, 118(1), 113 to 134.
[4] Black, F. and Scholes, M. (1973). The Pricing of Options and Corporate Liabilities. Journal of Political Economy, 81(3), 637 to 654.
| # | Name | Type | Description |
|---|---|---|---|
| 1 | gold_vrp_feed.py | Python script | Reads the gold ETF option chain, solves implied volatility from option prices, and publishes it as a JSON feed |
| 2 | GoldVRPMonitor.mqh | Class library | CVolatilityEngine: reads the feed, measures realized volatility from the terminal's bars, computes the ratio and classifies the regime |
| 3 | GoldVRPCheck.mq5 | Script | Example script: fetches the feed, compares implied against realized volatility, and prints the result |
| 4 | GoldVRPMonitorService.mq5 | Service | Background monitor: chart panel and push notifications on a regime change |
| 5 | MQL5.zip | Archive | An archive of the MQL5 files above for unpacking into the MQL5 directory of the client terminal |
Warning: All rights to these materials are reserved by MetaQuotes Ltd. Copying or reprinting of these materials in whole or in part is prohibited.
This article was written by a user of the site and reflects their personal views. MetaQuotes Ltd is not responsible for the accuracy of the information presented, nor for any consequences resulting from the use of the solutions, strategies or recommendations described.

 Larry Williams Market Secrets (Part 17) : Detecting Oops Signals Using a Custom Indicator
 Building a Compile-Time Unit Testing Framework in MQL5 Using Preprocessor Assertions
 Implementing a Trade Throttle and Rate Limiter in MQL5
 Neural Networks in Trading: Probabilistic Time Series Forecasting (Conclusion)

- Free trading apps
- Over 8,000 signals for copying
- Economic news for exploring financial markets
You agree to website policy and terms of use