

Neural Networks in Trading: Robust Trading Signals in Any Market Regime (Attention Modules)
 157
157
 1
1

Introduction
Financial markets are like a living organism that breathes, evolves, and is constantly changing. There is no absolute stability here. The usual correlations between assets can disappear in just a few trading sessions. The market is not just numbers on charts; it is also a reflection of human emotions, expectations, and decisions intertwined in an extremely complex web of interconnections. And in this world of chaos and uncertainty, tools capable of discerning hidden order are especially valuable.
The ST-Expert framework, which we began discussing in the previous article, was created precisely to identify patterns where conventional methods of analysis fall short. Its main feature is its ability to combine two dimensions: temporal and spatial. The temporal aspect is a classic element of financial forecasting: analyzing historical data and attempting to predict the future based on past quotes. The spatial aspect adds a new level of understanding: the market is viewed as a network in which every asset is connected to others, and changes in one segment inevitably affect neighboring ones.
Imagine that we are analyzing the stock market. If the price of oil begins to rise, this is reflected almost immediately in the stock prices of oil companies. And the currencies of oil-producing countries — as well as entire sectors of related industries — may follow suit. A classical model built solely on price time series sees only the direct trajectory of a particular instrument. ST-Expert, on the other hand, is capable of capturing the entire cascade of changes because it works not only with time but also with the space of market relationships.
The framework's architecture is based on the Mixture of Experts principle — a mixture of experts. This approach can be compared to the work of an investment committee. It brings together analysts with different profiles: one specializes in technical analysis, another in macroeconomics, and a third tracks correlations between sectors. Individually, each of them has limited capabilities. But when their opinions come together, the final decision turns out to be much closer to reality. The same is true in ST-Expert: each expert block is responsible for its own area of analysis, and the system combines their forecasts to form a coherent solution.
This distribution of tasks provides the system with three key advantages:
- Adaptability. The market changes every minute, and the system must change along with it. If the key driver of movement yesterday was the commodities sector, and today it has shifted to currencies, ST-Expert reconfigures itself, shifting the emphasis among its experts.
- Robustness. When one of the experts is wrong, the overall forecast maintains its quality thanks to collective alignment. This reduces the risk of overcommitting to a single strategy and makes the system more robust.
- Interpretability. It is important for a trader to understand not only the outcome of a forecast but also the reasons behind it. In ST-Expert, you can always see which expert made the main contribution and which relationships proved meaningful. This makes the system not a black box but a tool that can be used consciously.
In trading terms, ST-Expert is not just an indicator, but an entire navigation system. It accounts for trend flows, catches local impulses, analyzes correlations between assets, and builds a real-time map of the market. Moreover, the system can update this map when familiar routes turn out to be blocked. In practical trading, this means fewer false signals and more decisions that reflect actual market dynamics.
The framework's architecture includes several key elements. At the center is a graph model, where vertices represent assets or time points, and edges represent the connections between them. These relationships can be direct and obvious, such as the dependence of gold on the dollar exchange rate, or hidden, such as correlations between individual stocks within a sector. The system's purpose is not simply to identify these connections, but also to be able to reconfigure them when the market dictates new conditions.
The adaptive graph combination module plays a crucial role. It can be compared to an orchestra conductor. Each instrument has its own part, but it is the conductor who decides which voice should sound louder at the right moment. If some relationships lose significance, the system strengthens others, thereby maintaining the integrity of the forecast.
The ST-Expert training mechanism is equally important. It is designed so that the system becomes familiar with different scenarios. This allows it to be prepared for new situations — whether a sudden news spike, a shift in correlations, or the emergence of new market drivers. In trading terms, this is akin to preparing for any market scenario: from a calm sideways market to a turbulent trend.
The author's visualization of the ST-Expert framework is shown below.
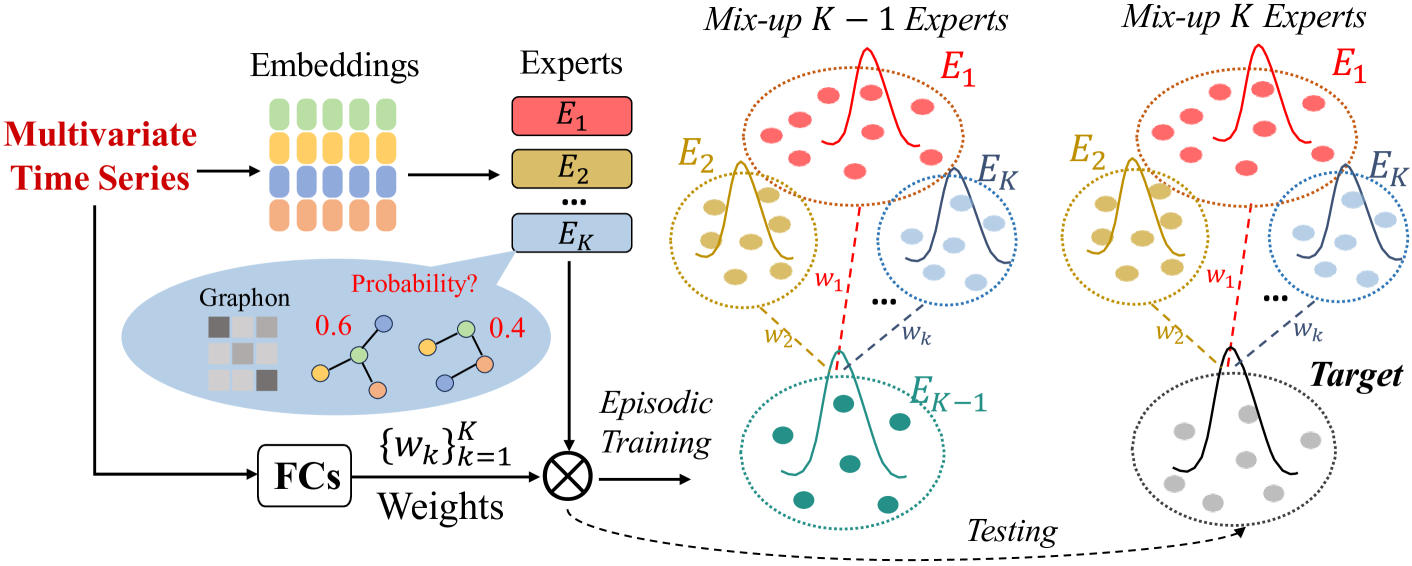
In the previous article, we did not limit ourselves to theory and took the first step toward the practical implementation of ST-Expert approaches using MQL5. We built a graphon generation object — a key component of the architecture responsible for modeling probabilistic relationships. This fundamental component lays the groundwork for adaptive analysis of spatial structures.
Today, we are continuing the work we started. Our goal is to develop the framework step by step, transforming it from a set of ideas into a full-fledged algorithmic trading tool.
Ideas for Use
As we move on to working on the model, it is worth recalling another important feature of the ST-Expert framework — its versatility. The authors of the framework emphasize that the approaches they propose are not limited to use in graph-based models. On the contrary, they can be integrated into a wide variety of classical models, enhancing them and endowing them with new properties. Essentially, this is about modularity. ST-Expert can be viewed as a set of adaptive components that can operate both independently and as part of larger systems.
This versatility is particularly valuable in a financial context. After all, a trader or researcher rarely limits themselves to a single model — more often than not, they use a whole set of tools. The ability to integrate ST-Expert approaches into them opens up new possibilities for experimentation. You can improve their robustness to spatial shifts, expand their analytical capabilities, or add a new level of interpretability.
In this work, we decided to develop this particular direction. The Extralonger framework was selected as the experimental basis. It is based on the idea of combining local and global factors, which allows for more accurate modeling of complex processes in the financial market.
The integration of ST-Expert and Extralonger seems like a logical step. The first introduces a mechanism for working with dynamic graphs and a mixture of experts capable of adapting to changes in the structure of connections. The second provides a well-established environment for working with time series and already implemented modules for spatiotemporal analysis. Together, they form a symbiosis in which each side enhances the other. Extralonger gains an additional level of adaptability and robustness, while ST-Expert gains a proven platform for integration into algorithmic trading.
Let's imagine what this might look like in practice. Suppose Extralonger analyzes the behavior of a currency pair and generates a forecast based on temporal dynamics. However, at some point, commodity prices or stock indices begin to have a significant impact on the market. If you use only Extralonger's basic functionality, such a change in drivers may go unnoticed. But the built-in ST-Expert modules, which work with graphons and expert blocks, will capture the new connections and reshape the picture. As a result, the forecast remains accurate even if market conditions have changed drastically.
To move from an idea to practical work, it is necessary to identify the integration points. Let me remind you that the Extralonger framework is based on a three-route Transformer built according to a modular principle. It combines three types of analysis: temporal, spatial, and mixed. Each of these routes is responsible for its own layer of understanding market data, and their joint operation makes it possible to form a comprehensive forecast.
Temporal analysis in Extralonger is implemented using a classic Transformer, which processes data sequences and extracts patterns from time series. This module is like a foundation — it provides a solid basis for analysis by identifying familiar dynamic relationships.
Spatial analysis is based on a global-local approach. Here, the architecture views the market as a network of interconnected nodes, in which neighboring elements form local patterns, while distant connections provide a global perspective. This approach is particularly important in a financial context, where instruments may be linked either directly or through more complex mechanisms (such as the technology sector and stock indices).
Finally, the mixed route combines both approaches — temporal and spatial. It allows the model to synthesize different levels of analysis, creating a kind of three-dimensional vision. As a result, Extralonger is able to simultaneously track trend dynamics and account for network dependencies.
This is precisely where the opportunity to integrate ST-Expert arises. Its graphon experts can be seamlessly integrated into the module, enhancing its ability to handle evolving link structures. Moreover, the very idea of a mixture of experts (Mixture of Experts) fits perfectly with the modular concept of Extralonger, where tasks are already divided by route.
Let's start with the temporal route. It is helpful to compare the architecture of a classic Transformer to a graph model. The Self-Attention mechanism essentially constructs a table of logits that reflects the probabilistic influence of each element in the sequence on the others. If we consider the elements of the sequence as nodes, the table of logits becomes a graph in which the edges represent the strength of mutual influence. In this sense, the Transformer does not simply analyze a sequence; it turns it into a dynamic network of interactions, making it possible to identify local and global dependencies that would otherwise remain hidden.
And this opens up an interesting opportunity. We can abandon the traditional mechanism for generating logits in Self-Attention and use a graph based on the principles of the ST-Expert framework instead. This approach makes it possible to establish more meaningful relationships between elements in a sequence, based on statistical correlation, expert rules, and structured dependencies. We expect the model to be able to understand the market more deeply by capturing subtle interrelationships that standard Self-Attention might overlook.
We can use a similar approach in the module for analyzing global-local dependencies. Here, the model constructs a kind of market scaffold, capturing broad patterns and trends. Global connections help predict overall market movements, allowing the model to see the forest rather than just the individual trees.
However, local dependencies require a different approach. We need to construct a sparse graph that accounts for only the most significant and probable connections between sequence nodes. This is similar to the approach of an experienced trader who focuses on key entry and exit points while ignoring noisy, insignificant signals. The methods of the ST-Expert framework can also be applied here, but with particular attention paid to selecting the most important relationships. This approach allows the model to simultaneously maintain a broad view and remain attentive to detail, identifying micro-influences that have a significant impact on short-term fluctuations.
The concept is clear. Now it is time to move from theory to practice — to put these ideas into action using MQL5.
Graph Attention Module
To implement the graphon-based Transformer variant proposed above, we create a CNeuronGraphAttention object, which inherits the base functionality of CNeuronBaseOCL and becomes the center of our graph attention model. This object does more than simply combine traditional value processing with graph structures — it transforms a sequence of data into a dynamic network of relationships.
class CNeuronGraphAttention   :  public CNeuronBaseOCL
  {
protected:
   CNeuronConvOCL    cValue;
   CNeuronGraphons   cGraphs;
   CNeuronSoftMaxOCL cScores;
   CNeuronBaseOCL    cAttention;
   CNeuronBaseOCL    cResidual;
   CNeuronConvOCL    cFeedForward[2];
   //---
   virtual bool      feedForward(CNeuronBaseOCL *NeuronOCL) override;
   virtual bool      updateInputWeights(CNeuronBaseOCL *NeuronOCL) override;
   virtual bool      calcInputGradients(CNeuronBaseOCL *NeuronOCL) override;

public:
                     CNeuronGraphAttention(void) {};
                    ~CNeuronGraphAttention(void) {};
   virtual bool      Init(uint numOutputs, uint myIndex, COpenCLMy *open_cl,
                          uint units, uint window, uint emb_dimension,
                          uint experts, float dropout,
                          ENUM_OPTIMIZATION optimization_type, uint batch);
   //---
   virtual int       Type(void) override const   {  return defNeuronGraphAttention;   }
   //--- methods for working with files
   virtual bool      Save(int const file_handle) override;
   virtual bool      Load(int const file_handle) override;
   //---
   virtual bool      WeightsUpdate(CNeuronBaseOCL *source, float tau) override;
   virtual void      SetOpenCL(COpenCLMy *obj) override;
   virtual void      SetActivationFunction(ENUM_ACTIVATION value) override { };
   virtual void      TrainMode(bool flag) override;
  };
Within the model, graphs constructed according to ST-Expert principles define the structure of relationships between elements in the sequence, allowing significant connections to be identified and noise to be ignored. At the same time, the SoftMax function generates a probabilistic distribution of attention across the graph, emphasizing the most critical interactions, while the residual connections ensure the preservation and integration of both new and previously accumulated dependencies, thereby creating a kind of model memory.
It is important to note that within the object, we deviate from the usual Self-Attention scheme and do not form the standard Query and Key entities. In a classic Transformer, they are used to construct a matrix of logits that reflects the mutual influence of the elements in the sequence. However, in our approach, this function is taken over by a graph constructed according to ST-Expert principles. This allows us to directly manage the relationships between nodes and focus on the most significant interactions, without having to generate unnecessary intermediate tables. In this case, only the Value values remain, which are used to generate the final attention results. Like raw material in the hands of a skilled craftsman, they pass through graph and Feed-Forward blocks, transforming into informative signals for market forecasting.
This approach allows the model to operate in a more targeted manner. Attention is concentrated on the key relationships that are truly important to the financial series, rather than being spread evenly across all elements. As a result, we obtain a mechanism that preserves the effectiveness of the Transformer while providing a much more meaningful and structured interpretation of the relationships within the sequence.
The Init method is responsible for preparing the CNeuronGraphAttention object for use. It is here that the model comes together, like a finely tuned mechanism, ready to process financial data.
bool CNeuronGraphAttention::Init(uint numOutputs, uint myIndex, COpenCLMy *open_cl,
                                 uint units, uint window, uint emb_dimension,
                                 uint experts, float dropout,
                                 ENUM_OPTIMIZATION optimization_type, uint batch)
  {
   if(!CNeuronBaseOCL::Init(numOutputs, myIndex, open_cl, units * window, optimization_type, batch))
      return false;
   activation = None;
First, the parent class initialization is called, where the neuron's general parameters are set. After that, the object's internal components are configured one by one.
The cValue block is initialized first; it is responsible for the initial encoding of the sequence's values. Its analysis window and the number of elements in the sequence being analyzed are specified. Its activation function is disabled so that the data can be passed through as cleanly as possible.
   int index = 0;
   if(!cValue.Init(0, index, OpenCL, window, window, window, units, 1, optimization, iBatch))
      return false;
   cValue.SetActivationFunction(None);
Next, a graphon block called cGraphs is created, built according to ST-Expert principles, which defines the structure of the relationships between the elements of the sequence.
   index++;
   if(!cGraphs.Init(0, index, OpenCL, units, window, emb_dimension, experts, dropout, optimization, iBatch))
      return false;
The output of the cGraphs module is a graph that reflects the probabilities of connections between the nodes of the sequence. This is already valuable information, but for the attention module, we need to transform these probabilities into a complete distribution of the influence that each element in the sequence has on the object being analyzed. This is where the cScores block with the SoftMax function comes into play. It carefully normalizes probabilities, strengthening key connections and weakening secondary ones, thereby creating an accurate and interpretable distribution of attention. As a result, each sequence element is assigned its own importance weight in the analysis, and the model can focus on truly significant interactions while ignoring noise and insignificant fluctuations.
This approach allows graph-based connections created by ST-Expert to be seamlessly integrated with the classical attention mechanism, transforming abstract probabilities into concrete signals ready for further processing and use in forecasting financial time series.
   index++;
   if(!cScores.Init(0, index, OpenCL, units * units, optimization, iBatch))
      return false;
   cScores.SetHeads(units);
Next, the cAttention and cResidual blocks are configured to store the results of the attention mechanism and residual connections. Activation is also disabled for them to prevent signal distortion.
   index++;
   if(!cAttention.Init(0, index, OpenCL, Neurons(), optimization, iBatch))
      return false;
   cAttention.SetActivationFunction(None);
   index++;
   if(!cResidual.Init(0, index, OpenCL, Neurons(), optimization, iBatch))
      return false;
   cResidual.SetActivationFunction(None);
Finally, two consecutive layers of the Feed-Forward block are configured. The first uses SoftPlus activation, enhancing the model's nonlinearity and its ability to identify complex relationships, while the second serves to compress and transform the information into the final attention signal without additional activation.
   index++;
   if(!cFeedForward[0].Init(0, index, OpenCL, window, window, 2 * window, units, 1, optimization, iBatch))
      return false;
   cFeedForward[0].SetActivationFunction(SoftPlus);
   index++;
   if(!cFeedForward[1].Init(0, index, OpenCL, cFeedForward[0].GetFilters(), cFeedForward[0].GetFilters(),
                                                                  window, units, 1, optimization, iBatch))
      return false;
   cFeedForward[1].SetActivationFunction(None);
//---
   return true;
  }
As a result, the Init method seamlessly integrates all components into a single system. Value-processing blocks, graphs, attention distribution, and Feed-Forward layers are now ready for operation, creating a fully functional graph attention mechanism capable of effectively analyzing the dynamics of financial time series.
After the object is initialized, the next step in the model's operation is the forward pass, implemented in the feedForward method.
bool CNeuronGraphAttention::feedForward(CNeuronBaseOCL *NeuronOCL)
  {
   if(!cValue.FeedForward(NeuronOCL))
      return false;
This is an expedition through a complex and dynamic financial landscape. It all starts with the cValue object, which acts as a scout. It carefully examines every market signal, transforming raw data into a representation that is easy to analyze, as if charting the terrain before a hike.
Next, the cGraphs graph module comes into play, building interaction routes between the nodes of the sequence.
   if(!cGraphs.FeedForward(NeuronOCL))
      return false;
You can think of it as a network of roads and paths on this map, where each connection represents the strength of one element's influence on another. The cScores block with SoftMax acts as the expedition leader, determining which paths are most important and which ones should be taken first. It transforms the raw probabilities of connections into a clear movement strategy, highlighting key interactions and ignoring insignificant noisy signals.
   if(!cScores.FeedForward(cGraphs.AsObject()))
      return false;
Once the reconnaissance is complete, the information from cValue and the attention distribution is combined via matrix multiplication, forming the results of the attention module in cAttention. It is like compiling all the intelligence data on a single map to see what forces and influences are acting on the object being analyzed.
   if(!MatMul(cScores.getOutput(), cValue.getOutput(), cAttention.getOutput(),
              cValue.GetUnits(), cValue.GetUnits(), cValue.GetFilters(), 1, false))
      return false;
The next step is to combine the data with the residual signal and normalize it in cResidual, stabilizing the data and preventing random fluctuations from throwing the model off course.
   if(!SumAndNormilize(NeuronOCL.getOutput(), cAttention.getOutput(), cResidual.getOutput(),
                       cValue.GetFilters(), true, 0, 0, 0, 1))
      return false;
Then the stage of the Feed-Forward block begins, acting like the expedition's skilled analysts. The first module, with SoftPlus activation, identifies hidden interdependencies and amplifies important signals, much like researchers pinpointing where key resources are hidden on a map. The second module transforms the information into a compact and interpretable representation, ready for use in forecasting.
   if(!cFeedForward[0].FeedForward(cResidual.AsObject()))
      return false;
   if(!cFeedForward[1].FeedForward(cFeedForward[0].AsObject()))
      return false;
   if(!SumAndNormilize(cFeedForward[1].getOutput(), cResidual.getOutput(), Output,
                       cFeedForward[1].GetFilters(), true, 0, 0, 0, 1))
      return false;
//---
   return true;
  }
Final normalization combines the residual data with the Feed-Forward results, forming the final signal that reflects the model's view of the market — both broad and detailed.
Ultimately, the feedForward method transforms a complex sequence of financial data into structured, meaningful knowledge that is ready for forecasting.
The forward pass is only the first part of the model's work. To obtain truly informative predictions, it is necessary to organize an error analysis process, which is implemented in the calcInputGradients method.
bool CNeuronGraphAttention::calcInputGradients(CNeuronBaseOCL *NeuronOCL)
  {
   if(!NeuronOCL)
      return false;
This stage can be thought of as a reverse expedition along the route already traveled, during which the model assesses which decisions were accurate and where deviations occurred.
The process begins with the final Feed-Forward block of the forward pass, where the signal passes through the inverse activation to correctly compute the error gradients.
   if(!DeActivation(cFeedForward[1].getOutput(), cFeedForward[1].getGradient(),
                    Gradient, cFeedForward[1].Activation()))
      return false;
   if(!cFeedForward[0].CalcHiddenGradients(cFeedForward[1].AsObject()))
      return false;
   if(!cResidual.CalcHiddenGradients(cFeedForward[0].AsObject()))
      return false;
The gradients are then fed to the first layer of the block and to the cResidual residual block, allowing for adjustments to the information that was processed in the previous stages. At this stage, the gradients are summed, which helps maintain the model's robustness and prevents signals from diverging during backpropagation.
   if(!SumAndNormilize(Gradient, cResidual.getGradient(), cAttention.getOutput(),
                       cValue.GetFilters(), false, 0, 0, 0, 1))
      return false;
Next, matrix multiplication propagates the gradients through the cScores attention distribution block and the cValue block, allowing the strength of each element's influence on the others to be adjusted. The cGraphs graph block receives its gradients, refining the probabilities of connections between nodes based on accumulated errors.
   if(!MatMulGrad(cScores.getOutput(), cScores.getGradient(),
                  cValue.getOutput(), cValue.getGradient(),
                  cAttention.getGradient(), cValue.GetUnits(),
                  cValue.GetUnits(), cValue.GetFilters(), 1, false))
      return false;
   if(!cGraphs.CalcHiddenGradients(cScores.AsObject()))
      return false;
The gradients are then passed down to the input-data level in the NeuronOCL object from the cValue block, where it is finally determined how each element of the sequence contributed to the model's error.
   if(!NeuronOCL.CalcHiddenGradients(cGraphs.AsObject()))
      return false;
It is important to note that during the forward pass, the input data travels simultaneously along three routes: through the cValue value block, through the cGraphs graph connections, and through the residual-connection mechanism. Each of these routes forms its own flow of information, reflecting different aspects of the interrelationships within the sequence.
Therefore, during the backward pass, it is necessary to carefully combine the gradients from all three routes. This is like an expedition where, after returning from several parallel trails, the researchers combine their observations to get a complete picture of the landscape. First, gradients are generated at the output of each route. They are then summed, taking residual connections into account, so that the information remains coherent and balanced. Only after such integration does the model gain an accurate understanding of where the errors occurred, which influences were underestimated, and which were overestimated.
   if(!DeActivation(NeuronOCL.getOutput(), cResidual.getGradient(),
                    cAttention.getGradient(), NeuronOCL.Activation()))
      return false;
   if(!SumAndNormilize(NeuronOCL.getGradient(), cResidual.getGradient(), cResidual.getGradient(),
                       cValue.GetWindow(), false, 0, 0, 0, 1))
      return false;
   if(!NeuronOCL.CalcHiddenGradients(cValue.AsObject()))
      return false;
   if(!SumAndNormilize(NeuronOCL.getGradient(), cResidual.getGradient(), NeuronOCL.getGradient(),
                       cValue.GetWindow(), false, 0, 0, 0, 1))
      return false;
//---
   return true;
  }
Thanks to this approach, the graph Transformer can be trained effectively. It takes into account both global and local interdependencies, adjusting them across the entire route, not just on individual segments. As a result, each node in the sequence receives a fair assessment of its role in the model's error, and the training process becomes consistent, stable, and maximally informative.
Training the model parameters is implemented in the updateInputWeights method, which can be viewed as coordinating the operation of the entire system. At this stage, the object does not perform direct weight adjustments on its own, but delegates this task to its internal components.
bool CNeuronGraphAttention::updateInputWeights(CNeuronBaseOCL *NeuronOCL)
  {
   if(!cValue.UpdateInputWeights(NeuronOCL))
      return false;
   if(!cGraphs.UpdateInputWeights(NeuronOCL))
      return false;
   if(!cFeedForward[0].UpdateInputWeights(cResidual.AsObject()))
      return false;
   if(!cFeedForward[1].UpdateInputWeights(cFeedForward[0].AsObject()))
      return false;
//---
   return true;
  }
In other words, the updateInputWeights method acts like a conductor who coordinates all the musicians within the object. Each block makes its own contribution, but overall harmony is achieved only through their combined efforts. As a result, the model gradually improves its predictions by learning from the errors identified during the backward pass and by strengthening the significant relationships between elements in the sequence.
The complete source code for the CNeuronGraphAttention class, with implementations of all methods, is provided in the attachment, demonstrating how the conceptual ideas behind graph attention are transformed into a functional mechanism ready to analyze dynamic financial time series.
Sparse SoftMax
The next step is to create a sparse graph for the local attention module. At the same time, there is no need to completely overhaul the graph generation object — minimal changes will suffice, while preserving the basic architecture and operational logic. In the graph attention module described above, the generated graph of dependencies at the output is converted into a probability distribution using the SoftMax function, which emphasizes the more significant interactions.
At the stage of local attention, we can take it a step further. Let's zero out the less probable connections and retain only the key interdependencies. This approach allows computational resources to be focused on the most significant interactions between nodes, which is particularly important when analyzing local fluctuations in financial time series. In practice, this is similar to the work of an experienced analyst: instead of examining every low-significance signal, they focus only on the critically important factors that actually influence the current trend.
To further optimize the model, a sparse matrix is created at the output that stores only the active, significant connections. This significantly reduces memory usage and speeds up computations without sacrificing information content. The sparse structure allows the model to process large time windows and complex sequences without overloading the compute block, while local attention becomes a fast and accurate tool for identifying micro-influences.
Ultimately, this approach combines two strategic advantages. On the one hand, the global connections defined by ST-Expert graphs are preserved, providing an understanding of the overall market picture; on the other hand, the local connections identified through a sparse matrix allow us to focus on critically important, fine-grained interactions.
We begin the practical implementation of sparse local attention by creating a Sparse SoftMax algorithm on the OpenCL program side. Its task is to transform the connection probabilities obtained from the graph block into an attention distribution, while simultaneously setting less significant elements to zero and creating a sparse matrix.
__kernel void SparseSoftMax(__global const float *data,
                            __global float *outputs,
                            __global float *indexes,
                            const int out_dimension
                           )
  {
   const size_t row = get_global_id(0);
   const size_t col_in = get_local_id(1);
   const int total_rows = (int)get_global_size(0);
   const int total_cols_in = (int)get_local_size(1);
//---
   __local float Temp[LOCAL_ARRAY_SIZE];
   const int ls = min(total_cols_in, (int)LOCAL_ARRAY_SIZE);
Each worker thread processes a separate row of the source data array, with the row representing the probabilities of node relationships. First, the values are checked for validity: NaN or infinite values are excluded and replaced with the minimum value. Each thread then calculates the position of its value relative to the other elements in the row. If a value is among the least significant ones, it will be set to zero.
   const int shift_in = RCtoFlat(row, col_in, total_rows, total_cols_in, 0);
//--- calc position
   float value = IsNaNOrInf(data[shift_in], MIN_VALUE);
   int position = 0;
   for(int l = 0; l < total_cols_in; l += ls)
     {
      if(col_in >= l && col_in < (l + ls))
         Temp[col_in - l] = value;
      BarrierLoc;
      for(int i = 0; i < ls; i++)
        {
         if(i == (col_in - l))
            continue;
         if(Temp[i] > value)
            position++;
         else
            if(Temp[i] == value && i < (col_in - l))
               position++;
        }
      BarrierLoc;
     }
After that, the classic SoftMax function is applied to the remaining elements, but with local normalization by subgroups of elements.
//--- SoftMax
   if(position >= out_dimension)
      value = MIN_VALUE;
   value = LocalSoftMax(value, 1, Temp);
//--- result
   const int shift_out = RCtoFlat(row, position, total_rows, out_dimension, 0);
   if(position < out_dimension)
     {
      outputs[shift_out] = value;
      indexes[shift_out] = (float)col_in;
     }
  }
This approach makes it possible to consider only the most significant relationships while maintaining the stability of numerical calculations. The output is a sparse matrix: values exceeding a specified threshold are retained, while all others are ignored, which sharply reduces the volume of data and improves the model's efficiency.
The final result consists of two arrays:
- outputs, containing normalized values only for significant connections,
- indexes, which records the positions of these active elements.
This information is ready for use in the local attention module, allowing the model to focus on critical local interactions between sequence nodes without overloading memory and computational resources.
On the main program side, we create a new CNeuronSparseSoftMax object, which inherits its basic functionality from the CNeuronSoftMaxOCL layer and specializes in working with sparse distributions. Unlike the standard SoftMax, this object makes it possible to focus attention only on the most significant connections between elements in a sequence, while reducing memory usage and improving computational efficiency.
class CNeuronSparseSoftMax    :  public CNeuronSoftMaxOCL
  {
protected:
   uint              iDimensionIn;
   CBufferFloat      cIndexes;
   //---
   virtual bool      feedForward(CNeuronBaseOCL *NeuronOCL) override;
   virtual bool      calcInputGradients(CNeuronBaseOCL *NeuronOCL) override;

public:
                     CNeuronSparseSoftMax(void) {};
                    ~CNeuronSparseSoftMax(void) {};
   //---
   virtual bool      Init(uint numOutputs, uint myIndex, COpenCLMy *open_cl,
                          uint units, uint dimension_in, uint dimension_out,
                          ENUM_OPTIMIZATION optimization_type, uint batch);
   //---
   virtual bool      Save(int const file_handle) override;
   virtual bool      Load(int const file_handle) override;
   virtual int       Type(void) override const { return defNeuronSparseSoftMax; }
   virtual void      SetOpenCL(COpenCLMy *obj) override;
   virtual CBufferFloat* GetIndexes(void)  { return GetPointer(cIndexes); }
   virtual uint      DimensionOut(void) const {  return uint(Neurons() / iHeads); }
  };
The class stores information about the dimensionality of the input data, iDimensionIn, and a buffer of active connection indices, cIndexes, whose values point to the elements taken into account when forming the attention distribution. The feedForward and calcInputGradients methods are wrappers for the forward and backward pass kernels in the OpenCL program, allowing the model to process data correctly and learn from errors while considering only active, meaningful connections.
The object is initialized in the Init method, which prepares the model to work with sparse attention distributions.
bool CNeuronSparseSoftMax::Init(uint numOutputs, uint myIndex, COpenCLMy *open_cl,
                                uint units, uint dimension_in, uint dimension_out,
                                ENUM_OPTIMIZATION optimization_type, uint batch)
  {
   if(dimension_in < dimension_out)
      return false;
   if(!CNeuronSoftMaxOCL::Init(numOutputs, myIndex, open_cl, units * dimension_out, optimization_type, batch))
      return false;
First, the correctness of the input dimensionality is checked: dimension_in must be at least as large as dimension_out so that the model can correctly form the distribution. Next, the base class is initialized.
After that, the number of attention heads is set, the dimensionality of the input data is stored, and the cIndexes index buffer is created to store only active, meaningful connections.
   SetHeads(units);
   iDimensionIn = dimension_in;
   if(!cIndexes.BufferInit(Neurons(), -1) ||
      !cIndexes.BufferCreate(OpenCL))
      return false;
//---
   return true;
  }
The buffer is initialized and allocated in memory, including support for OpenCL for accelerated computations. As a result, the object is fully ready for operation: it can accept input data, identify key connections, and form a sparse attention distribution while maintaining efficient resource usage.
Thus, CNeuronSparseSoftMax transforms the sparse graph of local attention into a convenient and efficient distribution, where attention is focused on the most significant interconnections. This allows the model to simultaneously maintain the overall picture defined by the main ST-Expert graph and accurately account for local influences, thereby generating detailed and informative forecasts of financial time series.
To organize local attention in our model, a minimal but effective change is sufficient. We can take the already implemented graph Transformer object and replace its SoftMax probabilistic projection module with the sparse version, CNeuronSparseSoftMax. This approach makes it possible to avoid rebuilding the entire architecture while preserving global graph connections and block logic, and at the same time ensures precise identification of local mutual influences.
Sparse SoftMax will focus on the most significant connections between nodes, ignoring less significant ones and thereby optimizing the use of memory and computational resources.
class CNeuronSparseGraphAttention   :  public CNeuronBaseOCL
  {
protected:
   CNeuronConvOCL       cValue;
   CNeuronGraphons      cGraphs;
   CNeuronSparseSoftMax cScores;
   CNeuronBaseOCL       cAttention;
   CNeuronBaseOCL       cResidual;
   CNeuronConvOCL       cFeedForward[2];
   //---
   virtual bool      feedForward(CNeuronBaseOCL *NeuronOCL) override;
   virtual bool      updateInputWeights(CNeuronBaseOCL *NeuronOCL) override;
   virtual bool      calcInputGradients(CNeuronBaseOCL *NeuronOCL) override;

public:
                     CNeuronSparseGraphAttention(void) {};
                    ~CNeuronSparseGraphAttention(void) {};
   virtual bool      Init(uint numOutputs, uint myIndex, COpenCLMy *open_cl,
                          uint units, uint window, uint experts, float dropout,
                          uint emb_dimension, uint sparse_dimension,
                          ENUM_OPTIMIZATION optimization_type, uint batch);
   //---
   virtual int       Type(void) override const   {  return defNeuronSparseGraphAttention;   }
   //--- methods for working with files
   virtual bool      Save(int const file_handle) override;
   virtual bool      Load(int const file_handle) override;
   //---
   virtual bool      WeightsUpdate(CNeuronBaseOCL *source, float tau) override;
   virtual void      SetOpenCL(COpenCLMy *obj) override;
   virtual void      SetActivationFunction(ENUM_ACTIVATION value) override { };
   virtual void      TrainMode(bool flag) override;
  };
The complete code for all the classes presented, along with the implementation of each of their methods, is available in the attachment to this article.
We have done a great deal of work and achieved significant results. Now is the perfect time to take a short break so that the information can sink in and be retained. In the next article, we will continue where we left off, move on to evaluating the effectiveness of the implemented solutions, and see how well the model handles the analysis of financial time series.
Conclusion
In the course of our work, we have followed a challenging path, exploring the graph Transformer architecture and mastering its key components: value blocks, dependency graphs, and attention distribution. Each of these elements played its part, much like members of an expedition who work together to chart a route through the complex and ever-changing landscape of the financial market.
We paid special attention to the implementation of Sparse SoftMax for local attention. This tool enabled the model to identify the most significant correlations while ignoring less significant signals, thereby conserving resources and improving the accuracy with which it navigates market dynamics. Forward and backward passes, as well as weight updates, ensured continuous course correction, allowing the model to learn from its mistakes and gradually improve its predictions.
The results obtained provided a solid foundation for further research. In the next article, we will continue our exploration by evaluating the effectiveness of the implemented solutions, analyzing the accuracy of the forecasts, and determining how well the model handles the dynamics of the financial time series.
Links
Programs used in this article
| # | Name | Type | Description |
|---|---|---|---|
| 1 | Study.mq5 | Expert Advisor | Expert Advisor for offline model training |
| 2 | StudyOnline.mq5 | Expert Advisor | Expert Advisor for online model training |
| 3 | Test.mq5 | Expert Advisor | Expert Advisor for model testing |
| 4 | Trajectory.mqh | Class Library | Structure for describing the system state and model architecture |
| 5 | NeuroNet.mqh | Class Library | Class library for building a neural network |
| 6 | NeuroNet.cl | Library | Code library for an OpenCL program |
Translated from Russian by MetaQuotes Ltd.
Original article: https://www.mql5.com/ru/articles/19624
Warning: All rights to these materials are reserved by MetaQuotes Ltd. Copying or reprinting of these materials in whole or in part is prohibited.
This article was written by a user of the site and reflects their personal views. MetaQuotes Ltd is not responsible for the accuracy of the information presented, nor for any consequences resulting from the use of the solutions, strategies or recommendations described.

 Win Rate and Edge Ratio Heatmap by Hour and Symbol in MQL5
 Building a Divergence System (Part IV): Creating a Reusable Divergence Engine for MQL5
 Graph Theory: Study of Graphs Generated by Some Random Process
 State Persistence in MQL5 (Part 1): A Crash-Safe State Store That Survives a Restart

- Free trading apps
- Over 8,000 signals for copying
- Economic news for exploring financial markets
You agree to website policy and terms of use
An article has been published entitled ‘Neural Networks in Trading: Reliable Trading Signals in All Market Conditions (Attention Modules)’:
Author: Dmitriy Gizlyk